Foundation Degree in Business: RS plc Business Performance Case Study

Verified

Added on  2022/12/14

|7
|1351
|390
Case Study
AI Summary
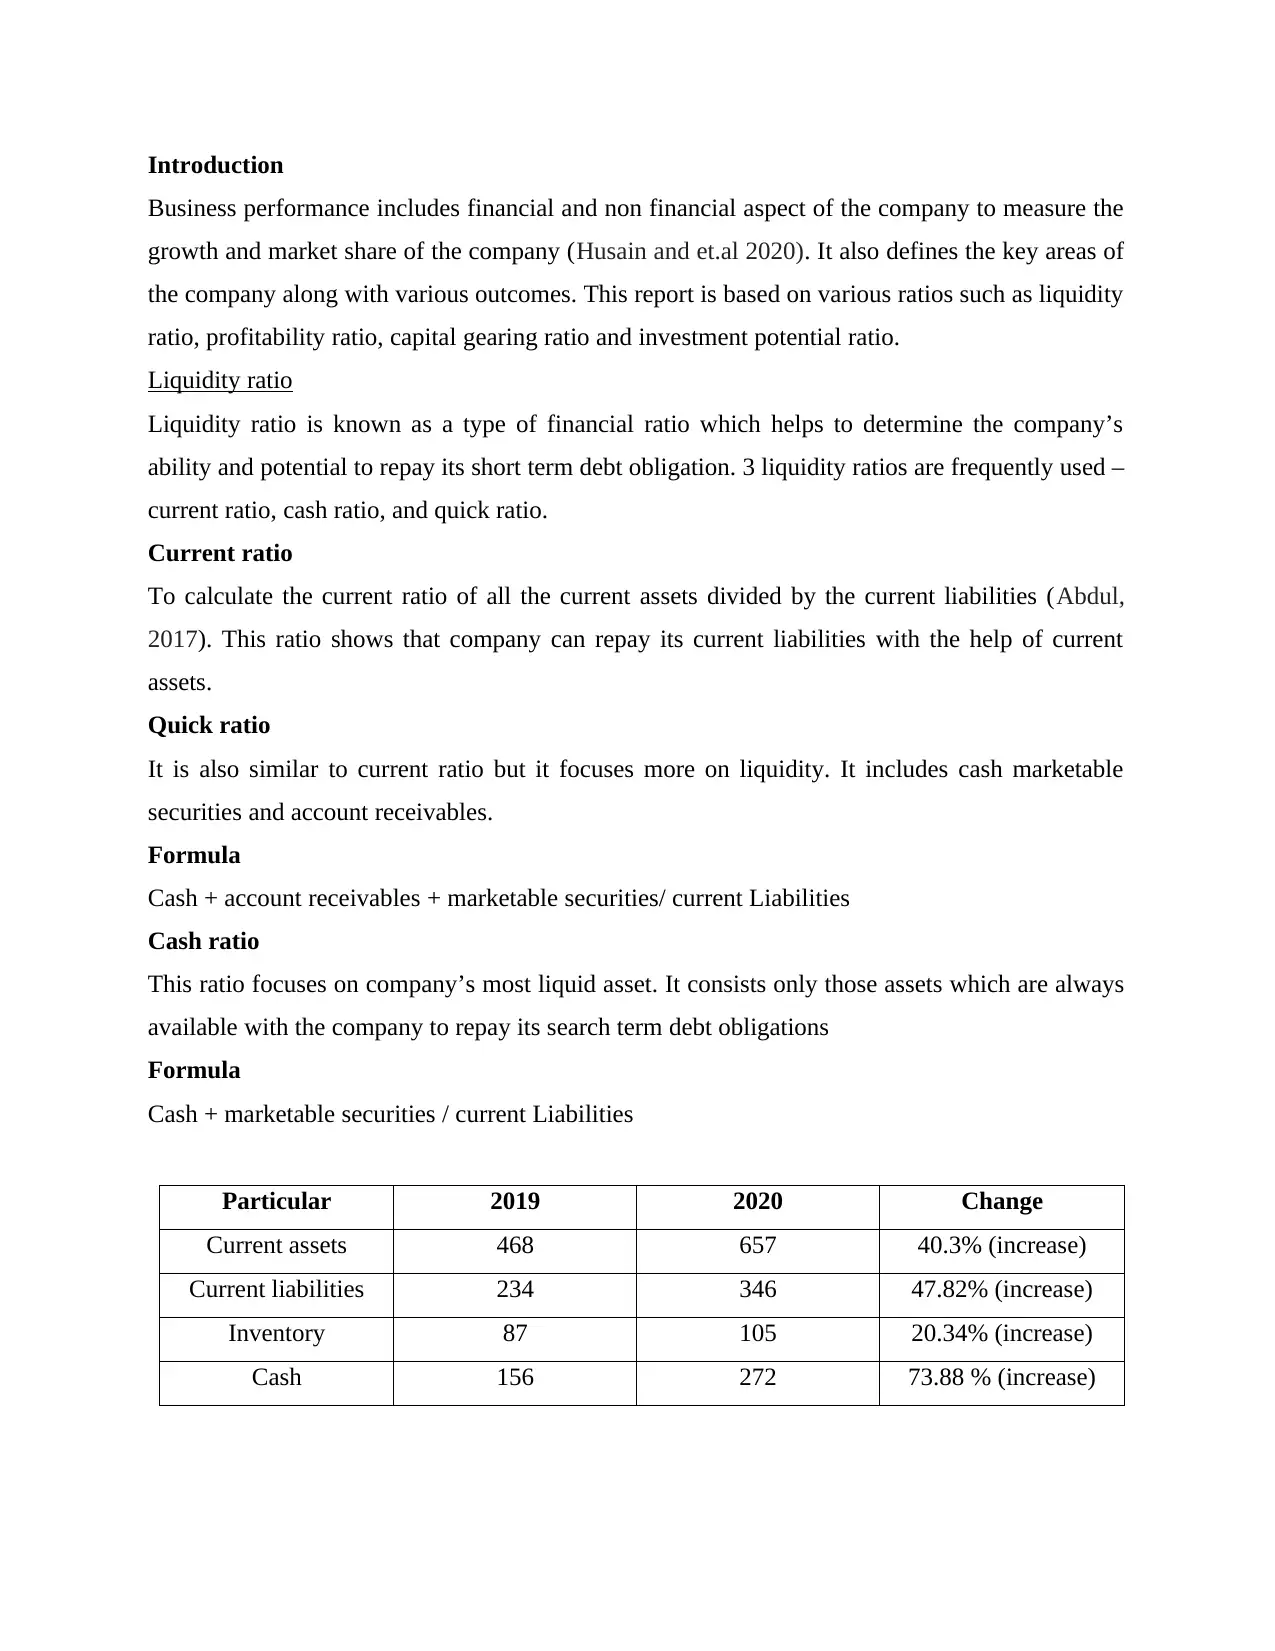
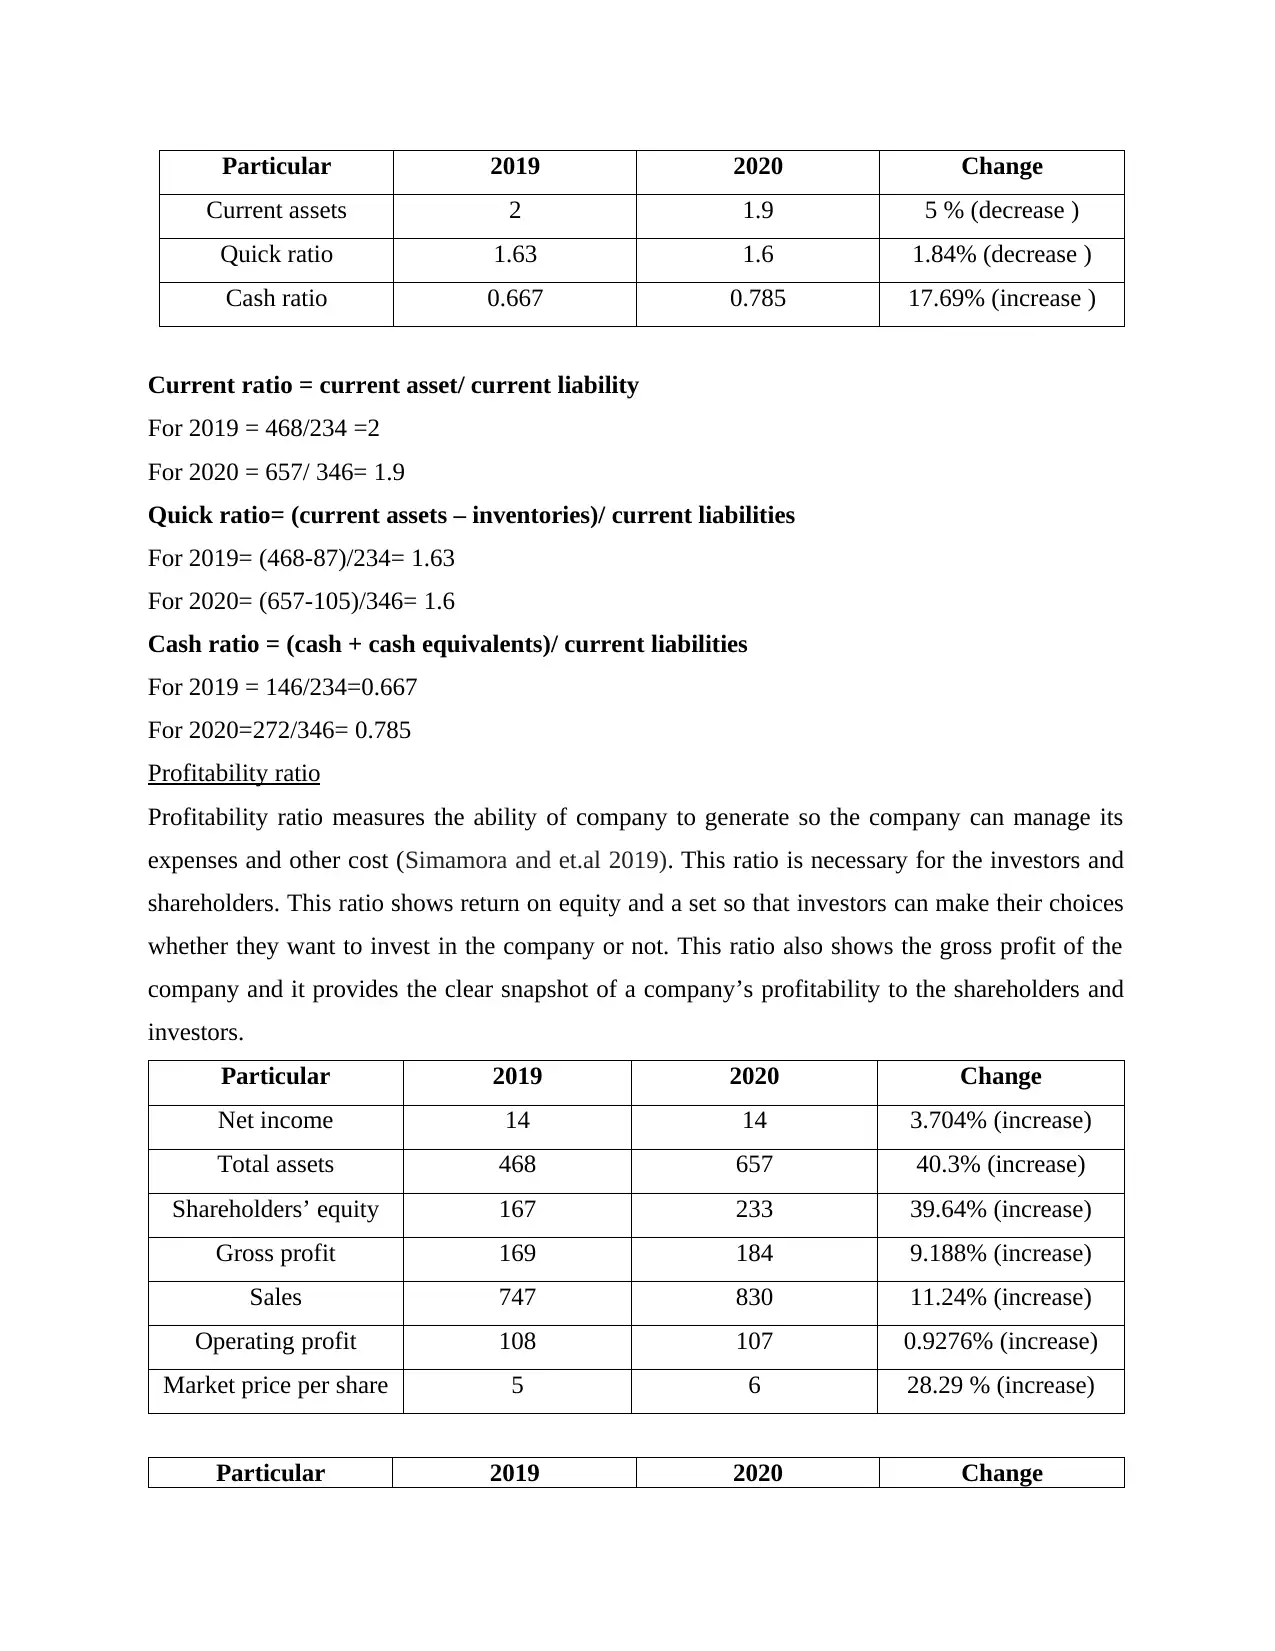
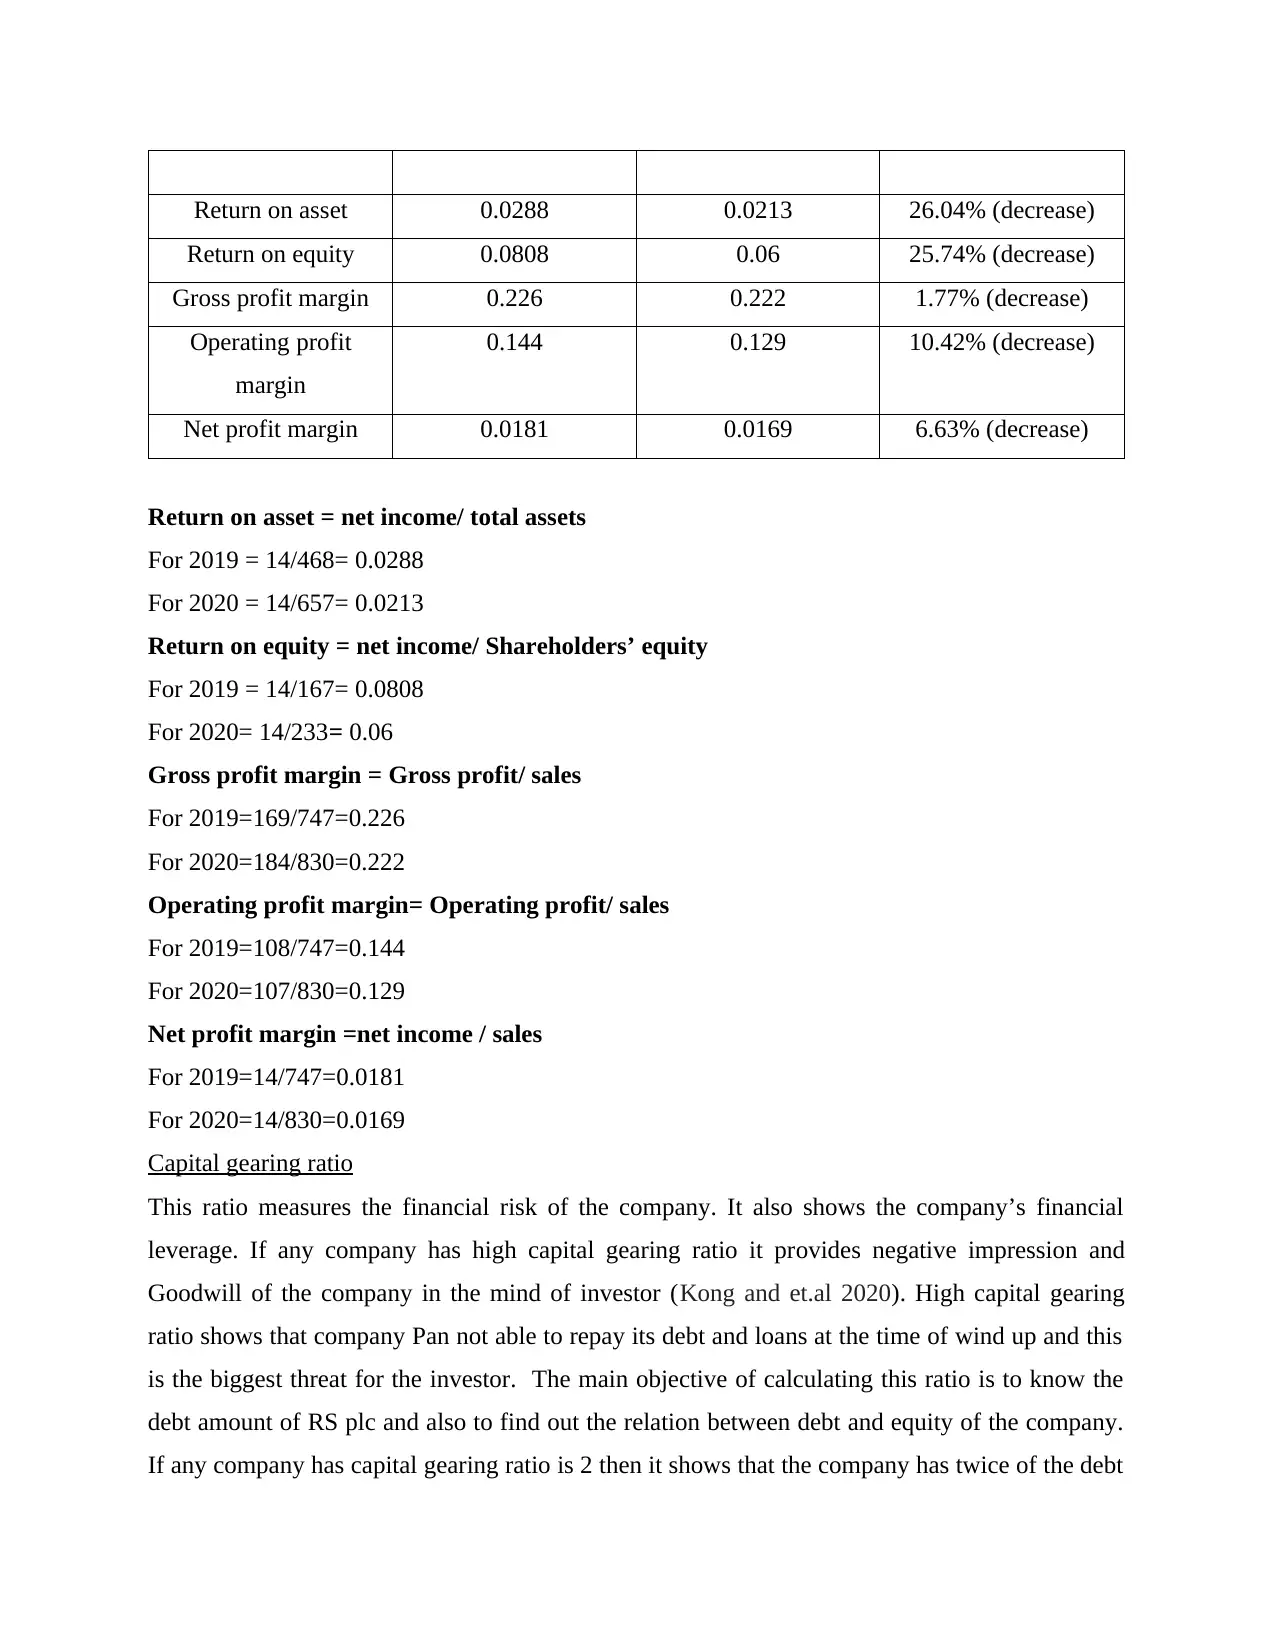
This case study analyzes the business performance of RS plc, a medium-sized retailer, by examining key financial ratios. The analysis includes calculations and interpretations of liquidity ratios (current, quick, and cash ratios), profitability ratios (return on assets, return on equity, gross profit margin, operating profit margin, and net profit margin), capital gearing ratio, and investment potential ratios. The report uses financial data from 2019 and 2020 to assess trends and changes in RS plc's financial health, providing insights for investors and stakeholders. The conclusion summarizes the findings and highlights the importance of these ratios in making informed investment decisions. The report also includes a list of relevant references.
tabler-icon-diamond-filled.svg

Contribute Materials

Your contribution can guide someone’s learning journey. Share your documents today.
Document Page
Business performance
tabler-icon-diamond-filled.svg

Secure Best Marks with AI Grader

Need help grading? Try our AI Grader for instant feedback on your assignments.
Document Page
Table of Contents
Introduction......................................................................................................................................3
Liquidity ratio..............................................................................................................................3
Profitability ratio..........................................................................................................................4
Capital gearing ratio.....................................................................................................................5
Investment potential ratio.............................................................................................................6
Conclusion.......................................................................................................................................6
References........................................................................................................................................7
Document Page
Introduction
Business performance includes financial and non financial aspect of the company to measure the
growth and market share of the company (Husain and et.al 2020). It also defines the key areas of
the company along with various outcomes. This report is based on various ratios such as liquidity
ratio, profitability ratio, capital gearing ratio and investment potential ratio.
Liquidity ratio
Liquidity ratio is known as a type of financial ratio which helps to determine the company’s
ability and potential to repay its short term debt obligation. 3 liquidity ratios are frequently used –
current ratio, cash ratio, and quick ratio.
Current ratio
To calculate the current ratio of all the current assets divided by the current liabilities (Abdul,
2017). This ratio shows that company can repay its current liabilities with the help of current
assets.
Quick ratio
It is also similar to current ratio but it focuses more on liquidity. It includes cash marketable
securities and account receivables.
Formula
Cash + account receivables + marketable securities/ current Liabilities
Cash ratio
This ratio focuses on company’s most liquid asset. It consists only those assets which are always
available with the company to repay its search term debt obligations
Formula
Cash + marketable securities / current Liabilities
Particular 2019 2020 Change
Current assets 468 657 40.3% (increase)
Current liabilities 234 346 47.82% (increase)
Inventory 87 105 20.34% (increase)
Cash 156 272 73.88 % (increase)
Document Page
Particular 2019 2020 Change
Current assets 2 1.9 5 % (decrease )
Quick ratio 1.63 1.6 1.84% (decrease )
Cash ratio 0.667 0.785 17.69% (increase )
Current ratio = current asset/ current liability
For 2019 = 468/234 =2
For 2020 = 657/ 346= 1.9
Quick ratio= (current assets – inventories)/ current liabilities
For 2019= (468-87)/234= 1.63
For 2020= (657-105)/346= 1.6
Cash ratio = (cash + cash equivalents)/ current liabilities
For 2019 = 146/234=0.667
For 2020=272/346= 0.785
Profitability ratio
Profitability ratio measures the ability of company to generate so the company can manage its
expenses and other cost (Simamora and et.al 2019). This ratio is necessary for the investors and
shareholders. This ratio shows return on equity and a set so that investors can make their choices
whether they want to invest in the company or not. This ratio also shows the gross profit of the
company and it provides the clear snapshot of a company’s profitability to the shareholders and
investors.
Particular 2019 2020 Change
Net income 14 14 3.704% (increase)
Total assets 468 657 40.3% (increase)
Shareholders’ equity 167 233 39.64% (increase)
Gross profit 169 184 9.188% (increase)
Sales 747 830 11.24% (increase)
Operating profit 108 107 0.9276% (increase)
Market price per share 5 6 28.29 % (increase)
Particular 2019 2020 Change
tabler-icon-diamond-filled.svg

Secure Best Marks with AI Grader

Need help grading? Try our AI Grader for instant feedback on your assignments.
Document Page
Return on asset 0.0288 0.0213 26.04% (decrease)
Return on equity 0.0808 0.06 25.74% (decrease)
Gross profit margin 0.226 0.222 1.77% (decrease)
Operating profit
margin
0.144 0.129 10.42% (decrease)
Net profit margin 0.0181 0.0169 6.63% (decrease)
Return on asset = net income/ total assets
For 2019 = 14/468= 0.0288
For 2020 = 14/657= 0.0213
Return on equity = net income/ Shareholders’ equity
For 2019 = 14/167= 0.0808
For 2020= 14/233= 0.06
Gross profit margin = Gross profit/ sales
For 2019=169/747=0.226
For 2020=184/830=0.222
Operating profit margin= Operating profit/ sales
For 2019=108/747=0.144
For 2020=107/830=0.129
Net profit margin =net income / sales
For 2019=14/747=0.0181
For 2020=14/830=0.0169
Capital gearing ratio
This ratio measures the financial risk of the company. It also shows the company’s financial
leverage. If any company has high capital gearing ratio it provides negative impression and
Goodwill of the company in the mind of investor (Kong and et.al 2020). High capital gearing
ratio shows that company Pan not able to repay its debt and loans at the time of wind up and this
is the biggest threat for the investor. The main objective of calculating this ratio is to know the
debt amount of RS plc and also to find out the relation between debt and equity of the company.
If any company has capital gearing ratio is 2 then it shows that the company has twice of the debt
Document Page
as compared to equity. Apart from this, capital gearing ratio identifies the capital structure of the
company and helps the company to keep an eye on the capital and put more focus on rearranging
the entire structure of the company.
Formula= (total debt/ shareholders equity)*100
For 2019 = 423/233*100=181.55%
For 2020= 301/167*100= 180.24%
Investment potential ratio
This ratio shows the return on investment. This ratio evaluates the profitability generated by the
company this ratio is also beneficial and important for the investors. This ratio put more
emphasis on time factor (Andow and et.al 2018). This ratio also known as return on investment
ratio. This ratio is most important for the perspective of investors as it shows the return on their
investment in the company. This ratio provides the final result and outcome of the company to
the investor. To provide better result it uses the capital invested by the shareholder in the
company and it also contains the short term and long term debt of the company. Apart from this,
it uses the assets of the company to know whether the company can repay its debt or not.
Therefore this ratio provides all the valuable information to the investor which is necessary for
them to know then only they can invest their money in the company if they get satisfied by
seeing the investment ratio and potential of the company.
Conclusion
From the above report it can be concluded that this report focuses on the growth and market
share of the company. This report includes various ratios which helps the investor to make
certain decisions about their investment. Apart from this equity ratio profitability ratio capital
gearing ratio is being mentioned in this report which helps the shareholders and investors as well.
Besides this investment potential ratio also mention in this report which shows the income and
earning of the company.
Document Page
References
Books and journal
Abdul, A.A.A., 2017. The relationship between solvency ratios and profitability ratios:
Analytical study in food industrial companies listed in Amman Bursa. International
Journal of Economics and Financial Issues. 7(2). p.86.
Andow, H.A. and Wetsi, S.Y., 2018. Capital Structure and Share Price: Empirical Evidence
From Listed Deposit Money Banks (DMB) in Nigeria. International Journal of New
Technology and Research. 4(2). p.263130.
Husain, T. and Sunardi, N., 2020. Firm's Value Prediction Based on Profitability Ratios and
Dividend Policy. Finance & Economics Review.2(2), pp.13-26.
Kong and et.al 2020, December. Predicting Liquidity Ratio of Mutual Funds via Ensemble
Learning. In 2020 IEEE International Conference on Big Data (Big Data) (pp. 5441-
5450). IEEE.
Simamora, R.A. and Hendarjatno, H., 2019. The effects of audit client tenure, audit lag, opinion
shopping, liquidity ratio, and leverage to the going concern audit opinion. Asian Journal
of Accounting Research.
chevron_up_icon
1 out of 7
circle_padding
hide_on_mobile
zoom_out_icon
logo.png

Your All-in-One AI-Powered Toolkit for Academic Success.

Available 24*7 on WhatsApp / Email

[object Object]