Business Finance Module: Analyzing Financial Statements and Ratios
VerifiedAdded on 2021/02/22
|12
|2839
|46
Homework Assignment
AI Summary
This business finance assignment provides a comprehensive overview of accounting principles and financial statement analysis. It begins with the presentation of transactions through T-accounts and balance sheets, detailing journal entries for various financial activities. The assignment the...
Read More
Contribute Materials
Your contribution can guide someone’s learning journey. Share your
documents today.

Business Finance
Secure Best Marks with AI Grader
Need help grading? Try our AI Grader for instant feedback on your assignments.

Table of Contents
INTRODUCTION................................................................................................................................3
Task 1 ...................................................................................................................................................3
1.1 & 1.2 Presenting the set of transactions by preparing relevant T- accounts and Balance Sheet
T- accounts.......................................................................................................................................3
2.1 Preparation of Trading A/C and Balance sheet for a business organisation..............................6
2.2 Evaluation of a set of Final Business Accounts ........................................................................6
3.1 Analysing and Interpretation of business accounts using ratio analysis between two
companies........................................................................................................................................8
CONCLUSION...................................................................................................................................11
REFERENCES...................................................................................................................................12

INTRODUCTION
Business Finance is about the various case studies related to the preparation of final
accounts of various companies. It also includes the summary of income statements and balance
sheet by calculating the % change in the statements based on the past year's performance of the
company. Also, it includes the evaluation of a set of final business accounts. It also includes the
analysis and interpretation of the business accounts using the ratio analysis. It shows the
performance of the various companies on the basis of their past performances of the company.
Task 1
1.1 & 1.2 Presenting the set of transactions by preparing relevant T- accounts and Balance Sheet T-
accounts
Journal Entries of Adek Lisowski as on 01 January 20xx
Date Particulars Debit Credit
2 Jan. 20xx Bank a/c Dr. 740
To J Jennings a/c (debtor) 740
3 Jan. 20xx Purchases a/c Dr. 1070
To G Frazer a/c(Creditors) 1070
4 Jan. 20xx Office Equipments a/c Dr. 560
To Bank a/c 560
5 Jan. 20xx A Hussain (Debtors) a/c Dr. 930
To Sales a/c 930
8 Jan. 20xx G Frazer (Creditors) a/c Dr. 880
To Bank a/c 880
11 Jan. 20xx Sales Return a/c Dr. 37
To A Hussain (debtor) a/c 37
14 Jan. 20xx J Jennings (Debtors) a/c Dr. 590
To Sales a/c 590
17 Jan. 20xx Drawings a/c Dr. 500
To Bank a/c 500
20 Jan. 20xx Purchases a/c Dr. 760
To G Frazer (Creditors) a/c 760
22 Jan. 20xx Bank a/c Dr. 1100
To A Hussain (debtors) a/c 1100
26 Jan. 20xx A Hussain (debtors) a/c 710
To Sales a/c 710
28 Jan. 20xx G Frazer (Creditors) a/c 98

To purchases return a/c 98
31 Jan. 20xx Wages a/c 480
To Bank a/c 480
Ledger Postings of Adek Lisowski as on 01 January 20xx
Bank A/C
Date Particulars
Amount
(Dr.) Date Particulars
Amount
(Cr.)
1 Jan 20xx To Bal. B/d 2040 4 Jan. 20xx
By Office
Equipments
a/c 560
2 Jan. 20xx To J Jennings a/c (debtor) 740 8 Jan. 20xx
By G Frazer
(Creditors)
a/c 880
22 Jan. 20xx To A Hussain (debtors) a/c 1100 17 Jan. 20xx
By Drawings
a/c 500
31 Jan. 20xx
By Wages
a/c 480
31 Jan. 20xx By Bal. C/d 1460
3880 3880
Purchases a/c
Date Particulars
Amount
(Dr.) Date Particulars
Amount
(Cr.)
3 Jan. 20xx To G Frazer a/c(Creditors) 1070 31 Jan. 20xx By Bal. C/d 1830
20 Jan. 20xx To G Frazer (Creditors) a/c 760
1830 1830
Sales A/C
Date Particulars
Amount
(Dr.) Date Particulars
Amount
(Cr.)
31 Jan. 20xx To Bal. C/d 2230 5 Jan. 20xx
BY A
Hussain
(Debtors) a/c 930
14 Jan. 20xx
BYJ
Jennings
(Debtors) a/c 590
26 Jan. 20xx
A Hussain
(debtors) a/c 710
2230 2230
Purchases return a/c
Date Particulars
Amount
(Dr.) Date Particulars
Amount
(Cr.)
31 Jan. 20xx To Bal. C/d 98 28 Jan. 20xx
By G Frazer
(Creditors)
a/c 98
Secure Best Marks with AI Grader
Need help grading? Try our AI Grader for instant feedback on your assignments.

98 98
Sales return a/c
Date Particulars
Amount
(Dr.) Date Particulars
Amount
(Cr.)
11 Jan. 20xx To A Hussain (debtor) a/c 37 31 Jan. 20xx By Bal. C/d 37
37 37
J Jennings a/c (debtor)
Date Particulars
Amount
(Dr.) Date Particulars
Amount
(Cr.)
1 Jan 20xx To Bal. B/d 740 2 Jan. 20xx By Bank a/c 740
14 Jan. 20xx To Sales a/c 590 31 Jan. 20xx By Bal. C/d 590
1330 1330
A Hussain (Debtors) a/c
Date Particulars
Amount
(Dr.) Date Particulars
Amount
(Cr.)
1 Jan 20xx To Bal. B/d 1100 11 Jan. 20xx
By Sales
Return a/c 37
5 Jan. 20xx To Sales a/c 930 22 Jan. 20xx By Bank a/c 1100
26 Jan. 20xx By A Hussain (debtors) a/c 710
31 Jan. 20xx By Bal. C/d 1603
2740 2740
G Frazer a/c(Creditors)
Date Particulars
Amount
(Dr.) Date Particulars
Amount
(Cr.)
8 Jan. 20xx To Bank a/c 880 1 Jan. 20xx By Bal. B/d 880
28 Jan. 20xx To purchases return a/c 98 3 Jan. 20xx
By
Purchases
a/c 1070
31 Jan. 20xx To Bal. C/d 1732 20 Jan. 20xx
By
Purchases
a/c Dr. 760
2710 2710
Office Equipments a/c
Date Particulars
Amount
(Dr.) Date Particulars
Amount
(Cr.)
4 Jan. 20xx To Bank a/c 560 31 Jan. 20xx By Bal. C/d 560
560 560
Drawings a/c
Date Particulars
Amount
(Dr.) Date Particulars
Amount
(Cr.)
17 Jan. 20xx To Bank a/c 500 31 Jan. 20xx By Bal. C/d 500

500 500
Wages a/c
Date Particulars
Amount
(Dr.) Date Particulars
Amount
(Cr.)
31 Jan. 20xx To Bank a/c 480 31 Jan. 20xx By Bal. C/d 480
480 480
Trial Balance of Adek Lisowski as on 01 January 20xx
S. No. Particulars Amount (Dr.) Amount (Cr.)
1 Capital a/c 6800
2 Motor Vehicle a/c 3800
3 Bank A/C 1460
4 Purchases a/c 1830
5 Sales a/c 2230
6 Purchases return a/c 98
7 Sales return a/c 37
8 J Jennings a/c (debtor) 590
9 A Hussain (Debtors) a/c 1603
10 G Frazer a/c(Creditors) 1732
11 Office Equipments a/c 560
12 Drawings a/c 500
13 Wages a/c 480
10860 10860
2.1 Preparation of Trading A/C and Balance sheet for a business organisation
Trading and Profit/ Loss account for Adya Kumar as at 31 December 20xx
Trading A/C
Particulars Amount (Dr.) Particulars Amount (Cr.)
To opening stock a/c 13250 By sales a/c 85500
To purchases a/c 55000 By closing stock a/c 18100
To Gross Profit c/f 35350
103600 103600
Profit and Loss a/c
To wages and salaries 9220 by Gross Profit b/d 35350
To office expenses 850
To rates 1200
To delivery van 5250
To Telephone charges 800
To travel expenses 330
To Net Profit c/f 17700
35350 35350
2.2 Evaluation of a set of Final Business Accounts

Analysis and Interpretation of Income Statement of LMN Plc.
Income Statement
Particulars 2016 $(m) 2017 $(m) % change
Revenue 150 250 66.67%
Less:Cost of Sales -100 -175 75.00%
Gross Profit 50 75 50.00%
Less:Operating Expenses -38 -49 28.95%
Operating Profit 12 26 116.67%
Less:Interest Payable 0 -1
Net Profit after tax 12 25 108.33%
Less:taxation -5 -11 120.00%
Net Profit after tax 7 14 100.00%
LMN Plc. Revenue increases by 66.67% over the past year of the company. Company's
overall performance is good because net profit after tax has been increased by 100% which shows
the good sign for the company. Company's operating profit have also been increased by 116.67%
which is very good for any company (Abernathy and et.al, 2017). Company should try to maintain
the same performance every year so that the company's growth will be increasing fast.
Analysis and Interpretation of Balance Sheet of LMN Plc.
Balance Sheet
Particulars 2016 $(m) 2017 $ (m) % change
$ (m) $ (m) $ (m) $ (m) %
Assets
Non current assets (fixed
assets)
Plant & Equipment 52 85 63.46%
Current Assets
Inventory 12 16 33.33%
Trade Receivables 18 40 122.22%
Cash 10 4 -60.00%
40 60 50.00%
Total Assets 92 145 57.61%
Liabilities & Capital
Shareholders Fund
Share Capital 60 60 0.00%
Reserves 12 20 66.67%
72 80 11.11%
Current Liabilities
Trade Payables 11 28 154.55%
Overdraft 9 17 88.89%
20 45 125.00%
Non current Liabilities
Loans 0 0 20 20
Total Liabilities &
Capital 92 145 57.61%
Paraphrase This Document
Need a fresh take? Get an instant paraphrase of this document with our AI Paraphraser

LMN plc. Balance sheet shows that even though the assets of the company has been by
63.46% but than also its profit has been by 100% which shows that assets are productively used in
the company. The company should invest more in the assets in order to increase the sales of the
company (Easton and et.al., 2018). The company is retaining its profits and that's why reserves have
been increased by 66.67%. It means that the company is using its own profits for investment.
3.1 Analysing and Interpretation of business accounts using ratio analysis between two companies
Liquidity Ratio
Current Ratio
Particulars C Plc D Plc
Current Assets 7.9 11.1
Current Liabilities 5.1 10.7
Current Ratio 1.55 1.04
Current Ratio
0
0.2
0.4
0.6
0.8
1
1.2
1.4
1.6
1.8 1.55
1.04
C Plc
D Plc
Acid/ Quick Ratio
Particulars C Plc D Plc
Quick Assets 4.10 7.00
Current Liabilities 5.1 10.7
Acid ratio 0.80 0.65

Acid ratio
0
0.1
0.2
0.3
0.4
0.5
0.6
0.7
0.8
0.9 0.80
0.65
C Plc
D Plc
Turnover Ratio
Debtors Turnover Ratio
Particulars C Plc D Plc
Net Sales/ revenue 43.9 96.3
Average Debtors 4.5 0.7
Debtors Turnover Ratio 9.756 137.571
Debtors collection Period (in
days) 37 3
Debtors Turnover Ratio
0
20
40
60
80
100
120
140
160
9.756
137.571
C Plc
D Plc
Creditors Turnover Ratio
Particulars C Plc D Plc
COGS 33.6 84.7
Average Creditors 5.1 10.7
Creditors Turnover Ratio 6.588 7.916
Creditors Payment Period (in
days) 55 46
0
0.1
0.2
0.3
0.4
0.5
0.6
0.7
0.8
0.9 0.80
0.65
C Plc
D Plc
Turnover Ratio
Debtors Turnover Ratio
Particulars C Plc D Plc
Net Sales/ revenue 43.9 96.3
Average Debtors 4.5 0.7
Debtors Turnover Ratio 9.756 137.571
Debtors collection Period (in
days) 37 3
Debtors Turnover Ratio
0
20
40
60
80
100
120
140
160
9.756
137.571
C Plc
D Plc
Creditors Turnover Ratio
Particulars C Plc D Plc
COGS 33.6 84.7
Average Creditors 5.1 10.7
Creditors Turnover Ratio 6.588 7.916
Creditors Payment Period (in
days) 55 46

Creditors Turnover Ratio
0
1
2
3
4
5
6
7
8
9
6.588
7.916
C Plc
D Plc
Inventory Turnover Ratio
Particulars C Plc D Plc
COGS 33.6 84.7
Average Inventory 3.8 4.1
Inventory Turnover ratio 8.842 20.659
Inventory Turnover ratio
0
5
10
15
20
25
8.842
20.659
C Plc
D Plc
Gearing Ratio
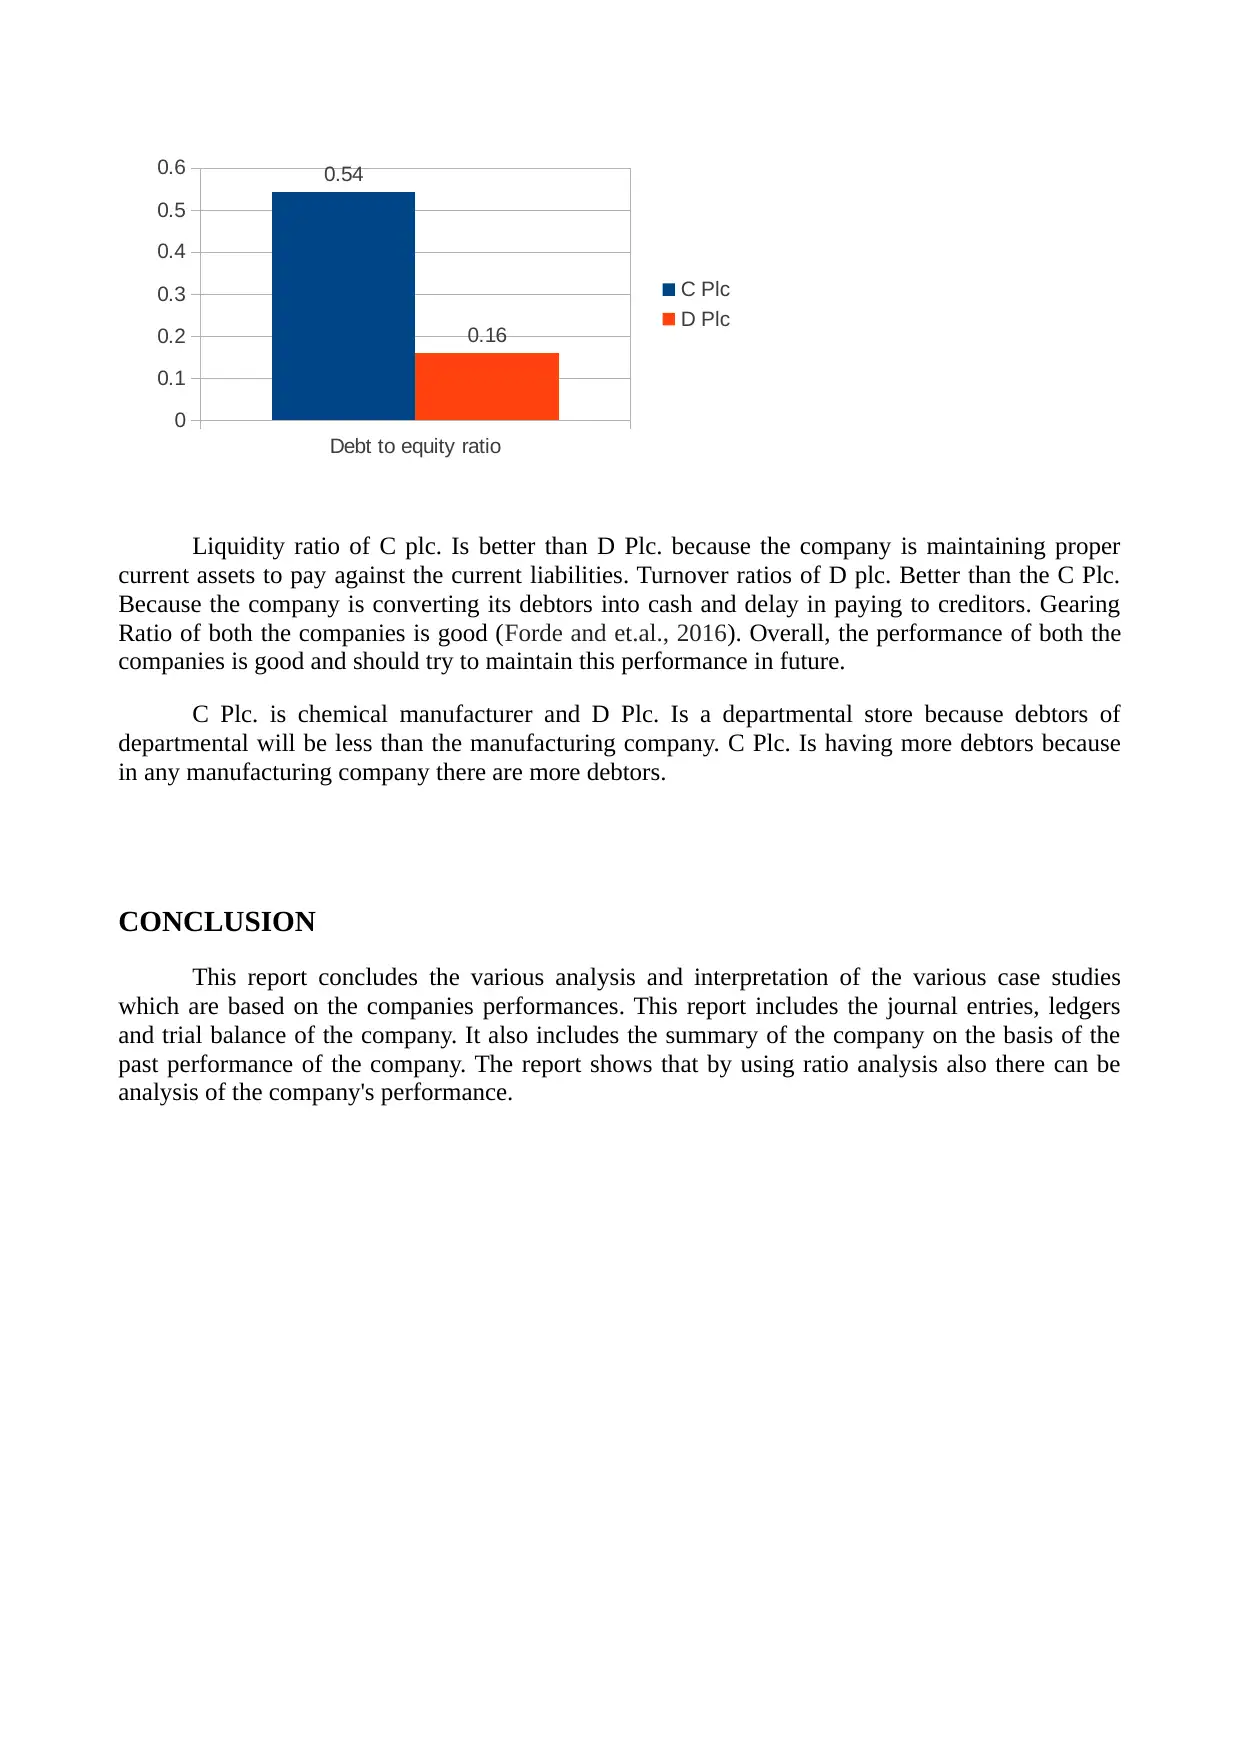
Debt to Equity Ratio
Particulars C Plc D Plc
Total Debt 3.2 2.1
Total shareholders fund 5.9 13.1
Debt to equity ratio 0.54 0.16
0
1
2
3
4
5
6
7
8
9
6.588
7.916
C Plc
D Plc
Inventory Turnover Ratio
Particulars C Plc D Plc
COGS 33.6 84.7
Average Inventory 3.8 4.1
Inventory Turnover ratio 8.842 20.659
Inventory Turnover ratio
0
5
10
15
20
25
8.842
20.659
C Plc
D Plc
Gearing Ratio
Debt to Equity Ratio
Particulars C Plc D Plc
Total Debt 3.2 2.1
Total shareholders fund 5.9 13.1
Debt to equity ratio 0.54 0.16
Secure Best Marks with AI Grader
Need help grading? Try our AI Grader for instant feedback on your assignments.
Debt to equity ratio
0
0.1
0.2
0.3
0.4
0.5
0.6 0.54
0.16
C Plc
D Plc
Liquidity ratio of C plc. Is better than D Plc. because the company is maintaining proper
current assets to pay against the current liabilities. Turnover ratios of D plc. Better than the C Plc.
Because the company is converting its debtors into cash and delay in paying to creditors. Gearing
Ratio of both the companies is good (Forde and et.al., 2016). Overall, the performance of both the
companies is good and should try to maintain this performance in future.
C Plc. is chemical manufacturer and D Plc. Is a departmental store because debtors of
departmental will be less than the manufacturing company. C Plc. Is having more debtors because
in any manufacturing company there are more debtors.
CONCLUSION
This report concludes the various analysis and interpretation of the various case studies
which are based on the companies performances. This report includes the journal entries, ledgers
and trial balance of the company. It also includes the summary of the company on the basis of the
past performance of the company. The report shows that by using ratio analysis also there can be
analysis of the company's performance.

REFERENCES
Books and Journals
Abernathy, J. L. And et.al, 2017. Income statement reporting discretion allowed by FIN 48: Interest
and penalty expense classification. The Journal of the American Taxation
Association. 39(1). pp.45-66.
Easton, M. and et.al., 2018. Financial Statement Analysis & Valuation. 5e.
Forde, M. C. And et.al., 2016. Predicting the Ultimate Load Capacity of Concrete Bridge Beams
from the" Relaxation Ratio" Analysis of AE Signals. Progress in Acoustic Emission. 18.
pp.359-364.
Online
Ratio Analysis. [Online]. Available through: <https://www.accountingtools.com/articles/ratio-
analysis.html >.
1 out of 12

Your All-in-One AI-Powered Toolkit for Academic Success.
+13062052269
info@desklib.com
Available 24*7 on WhatsApp / Email
![[object Object]](/_next/static/media/star-bottom.7253800d.svg)
Unlock your academic potential
© 2024 | Zucol Services PVT LTD | All rights reserved.