Statistics of Business and Finance: Stock Analysis and CAPM
VerifiedAdded on 2023/06/04
|9
|1305
|320
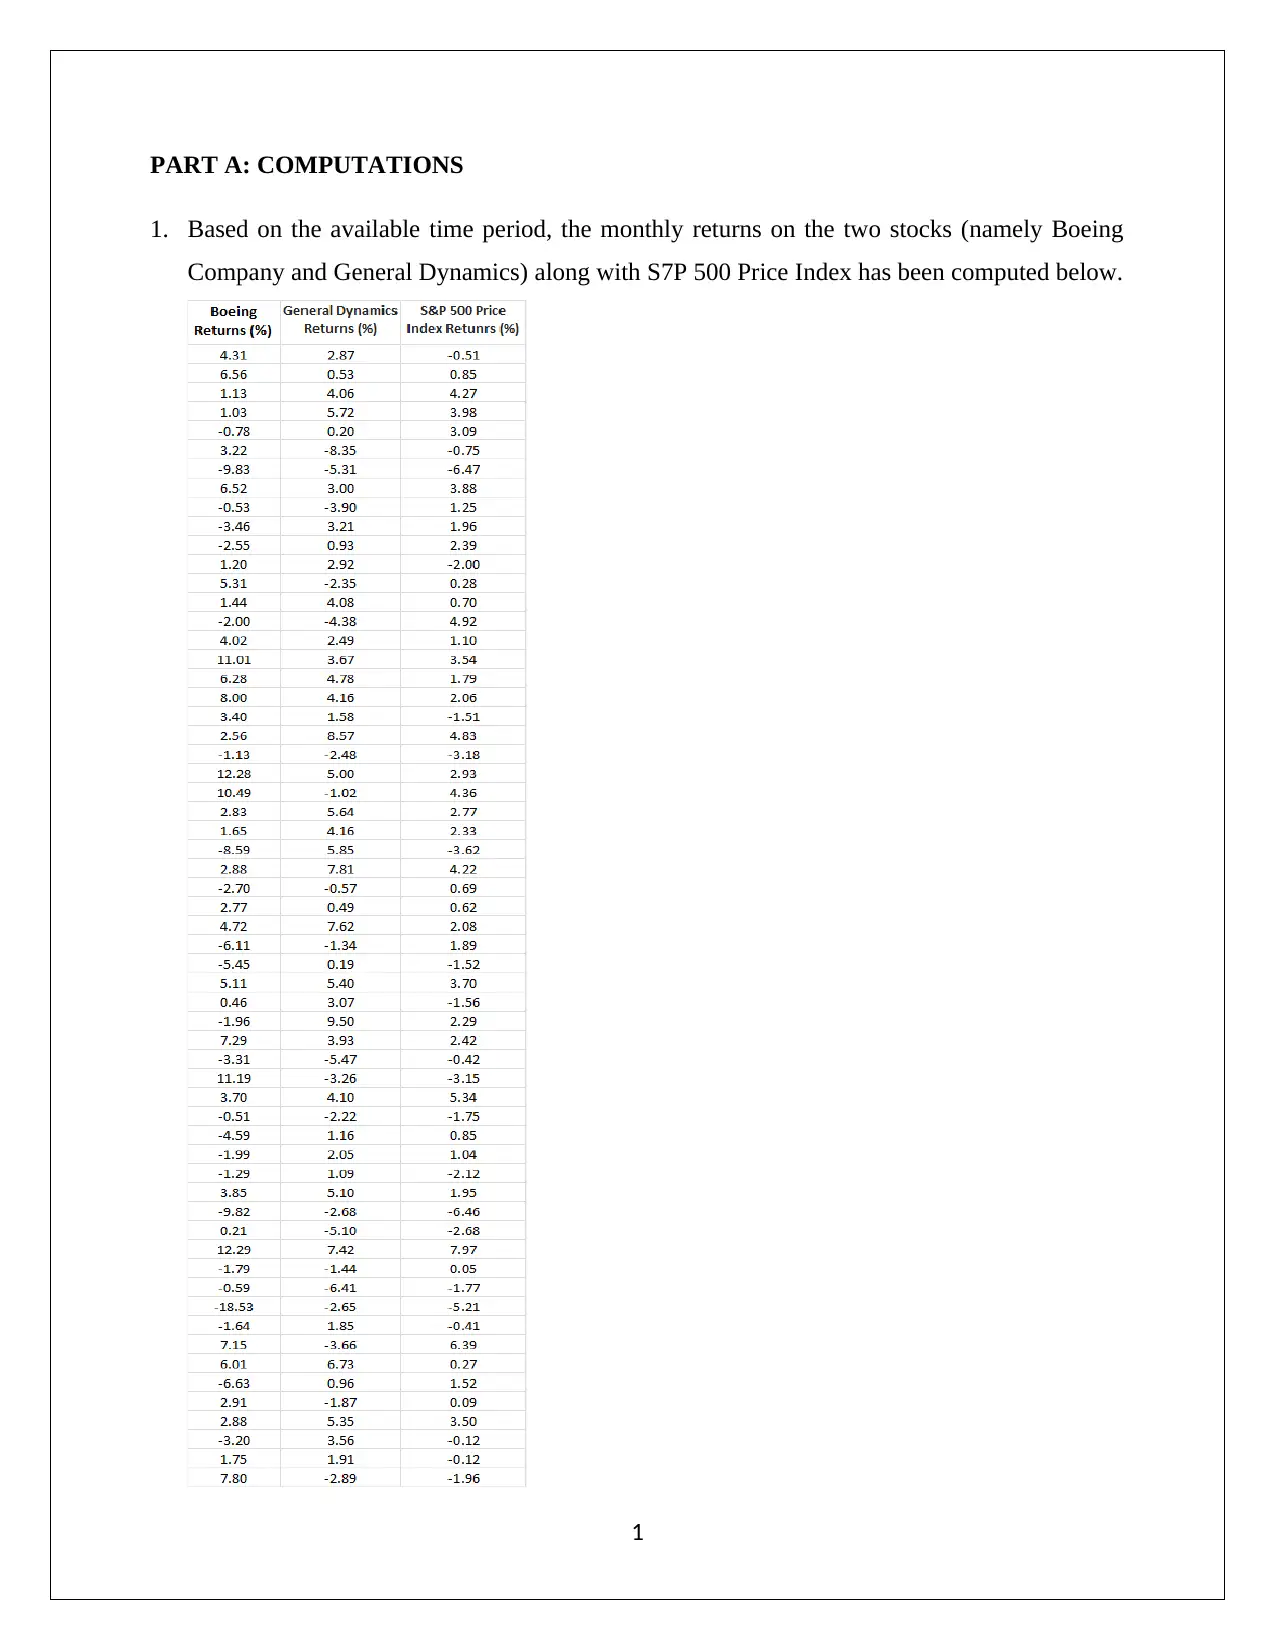
Homework Assignment
AI Summary
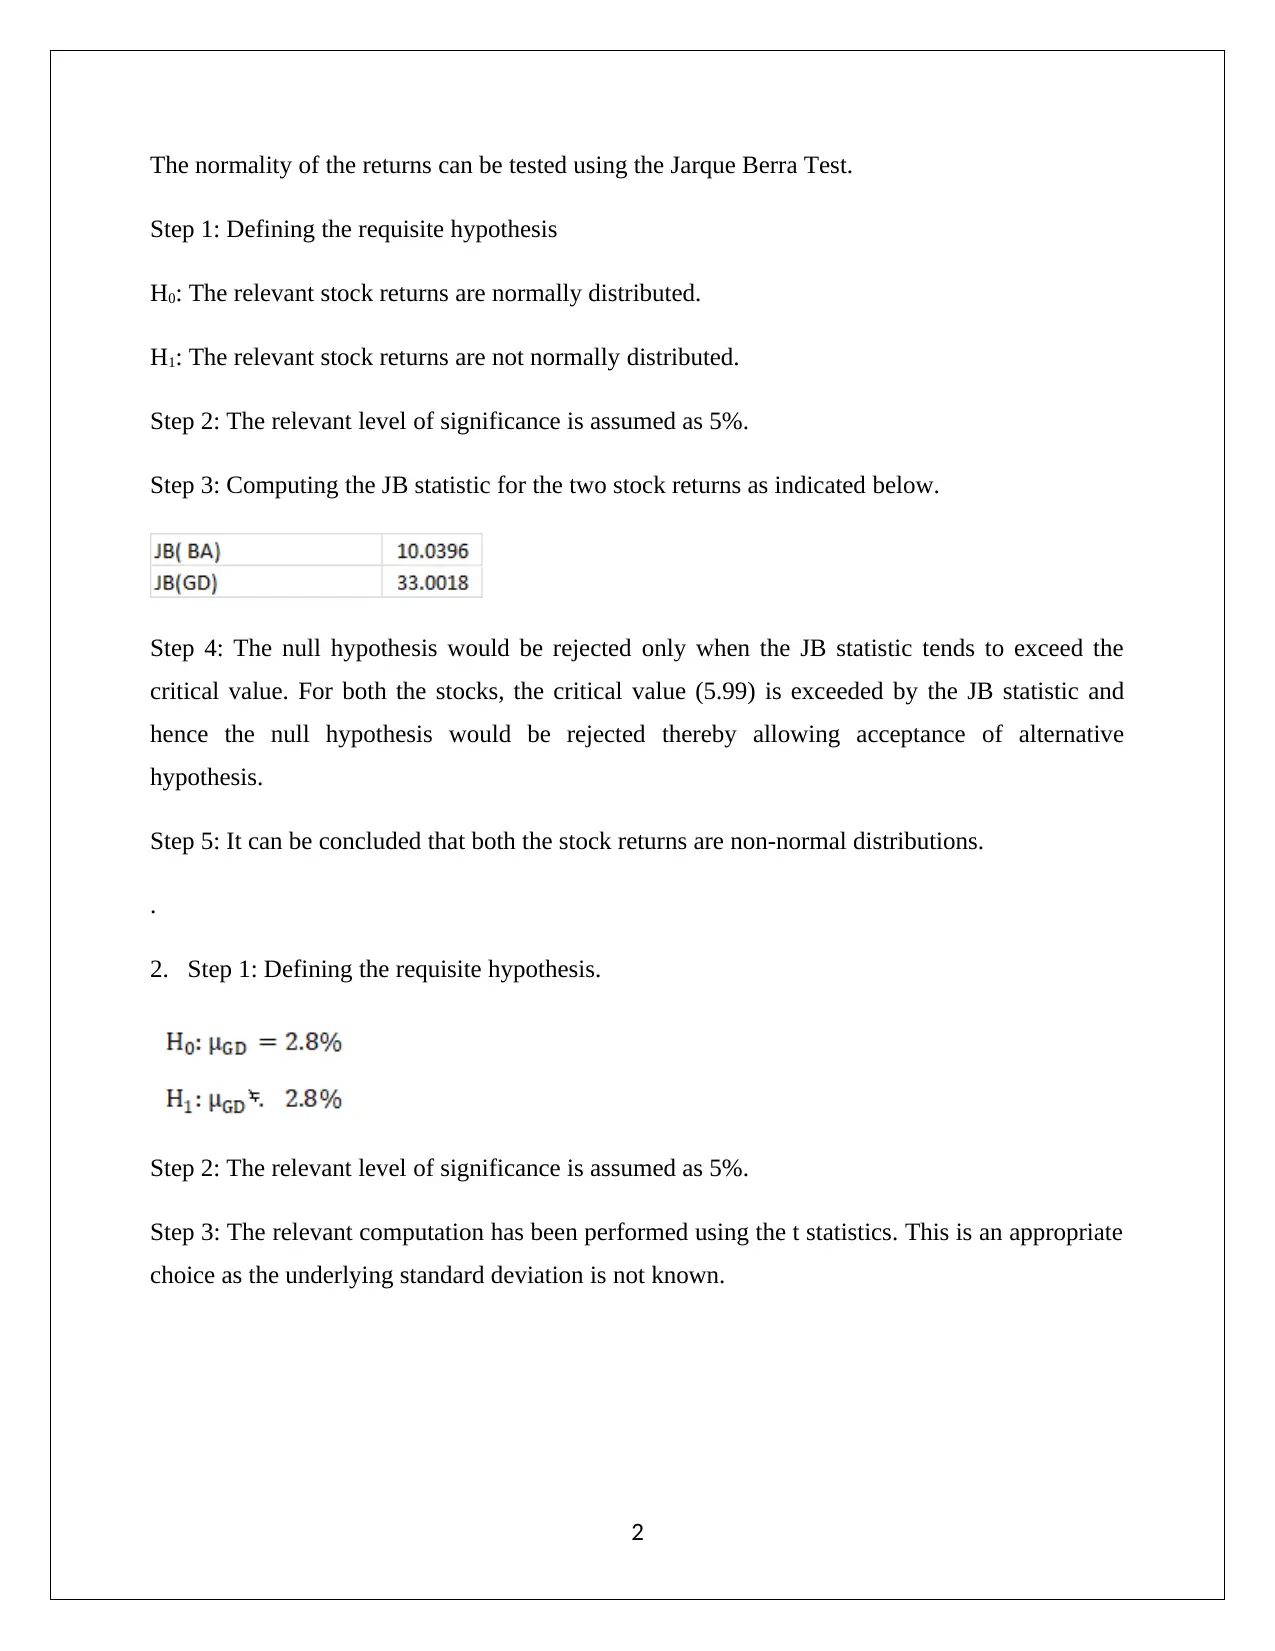
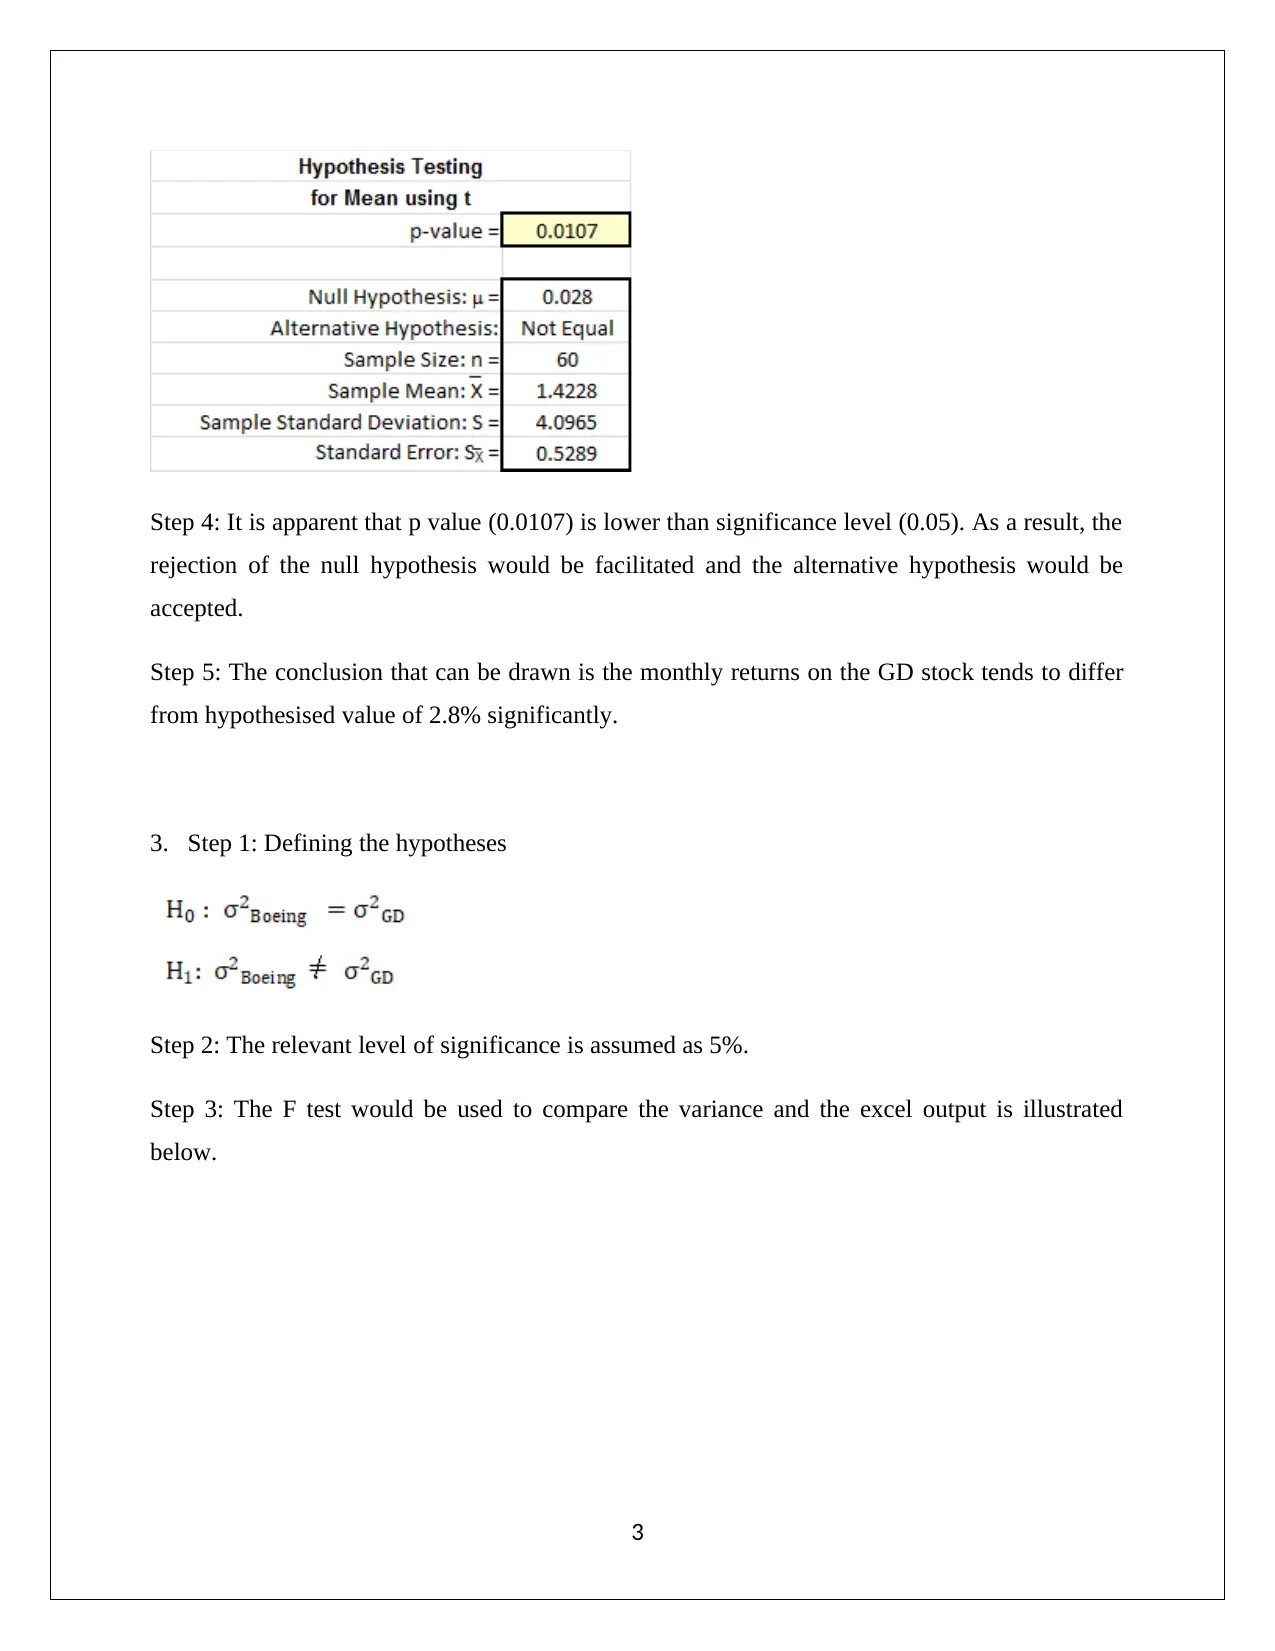
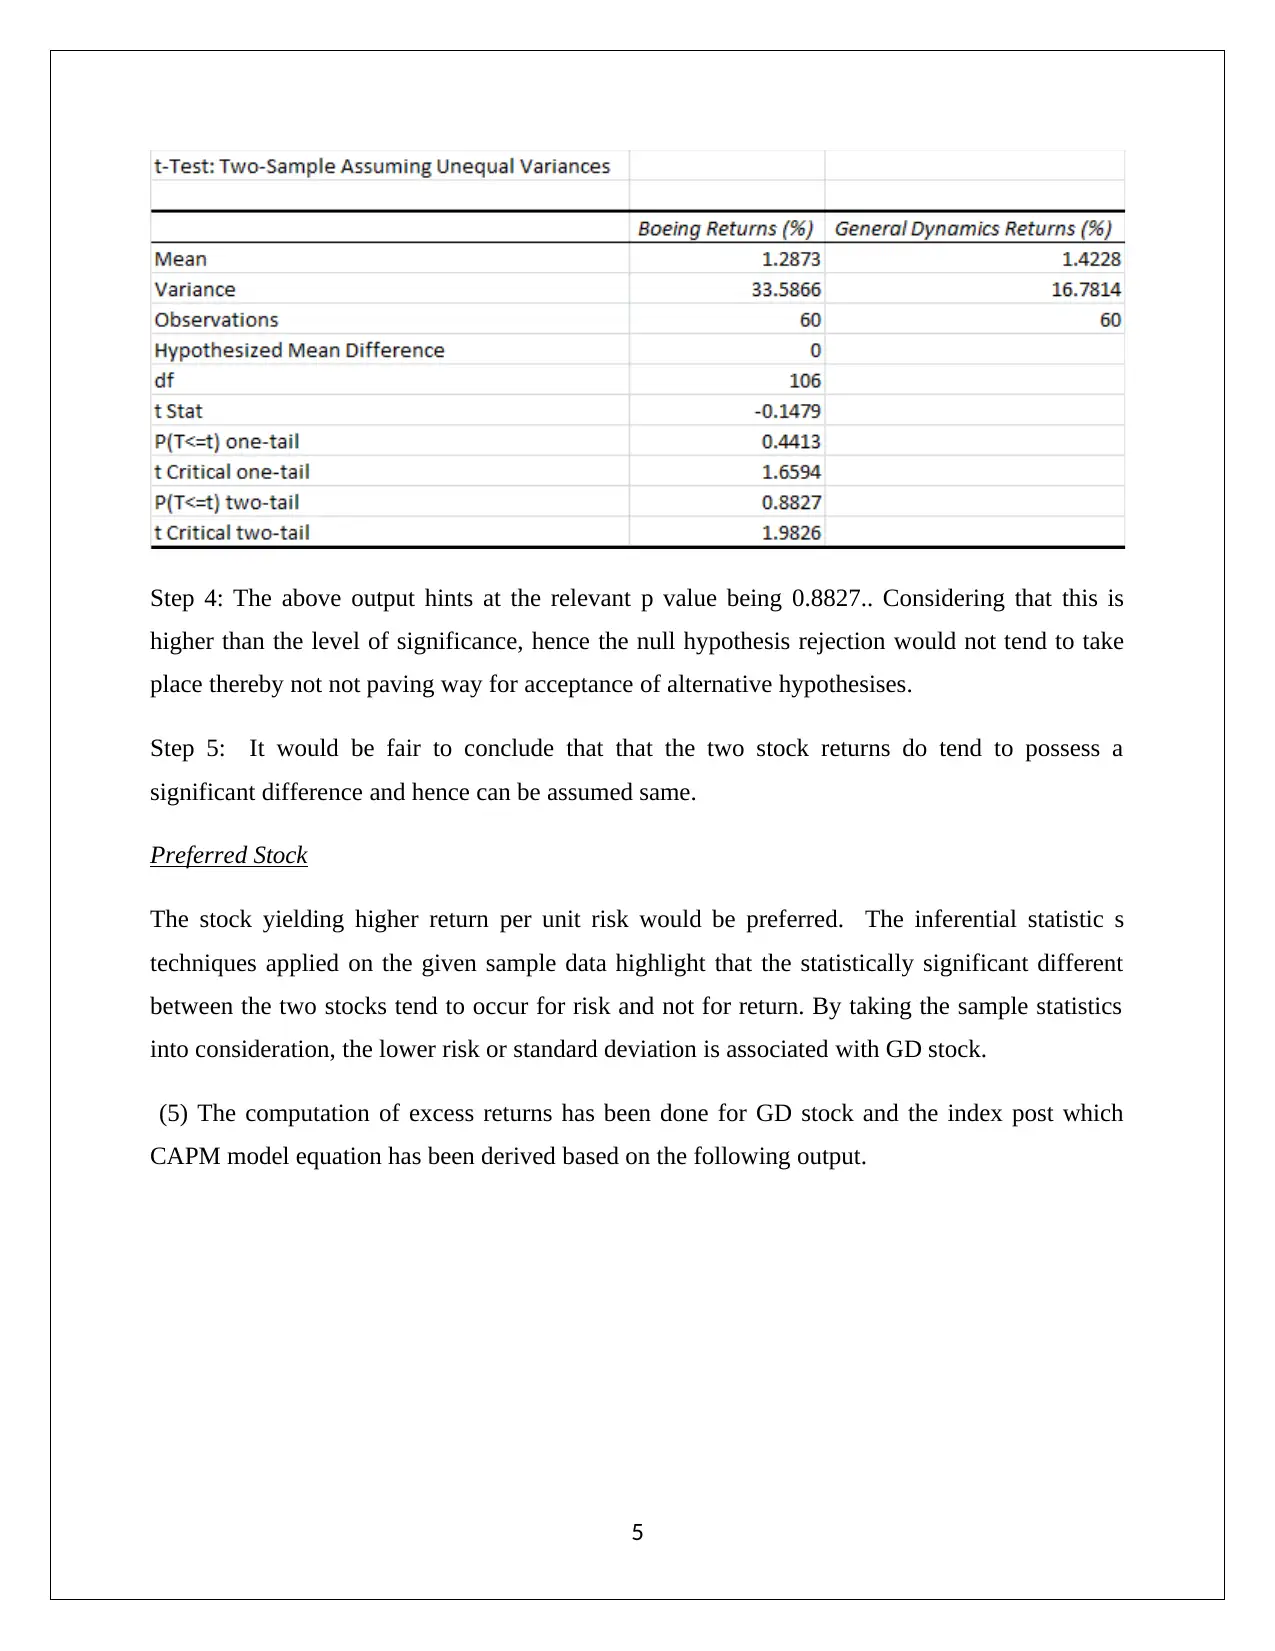
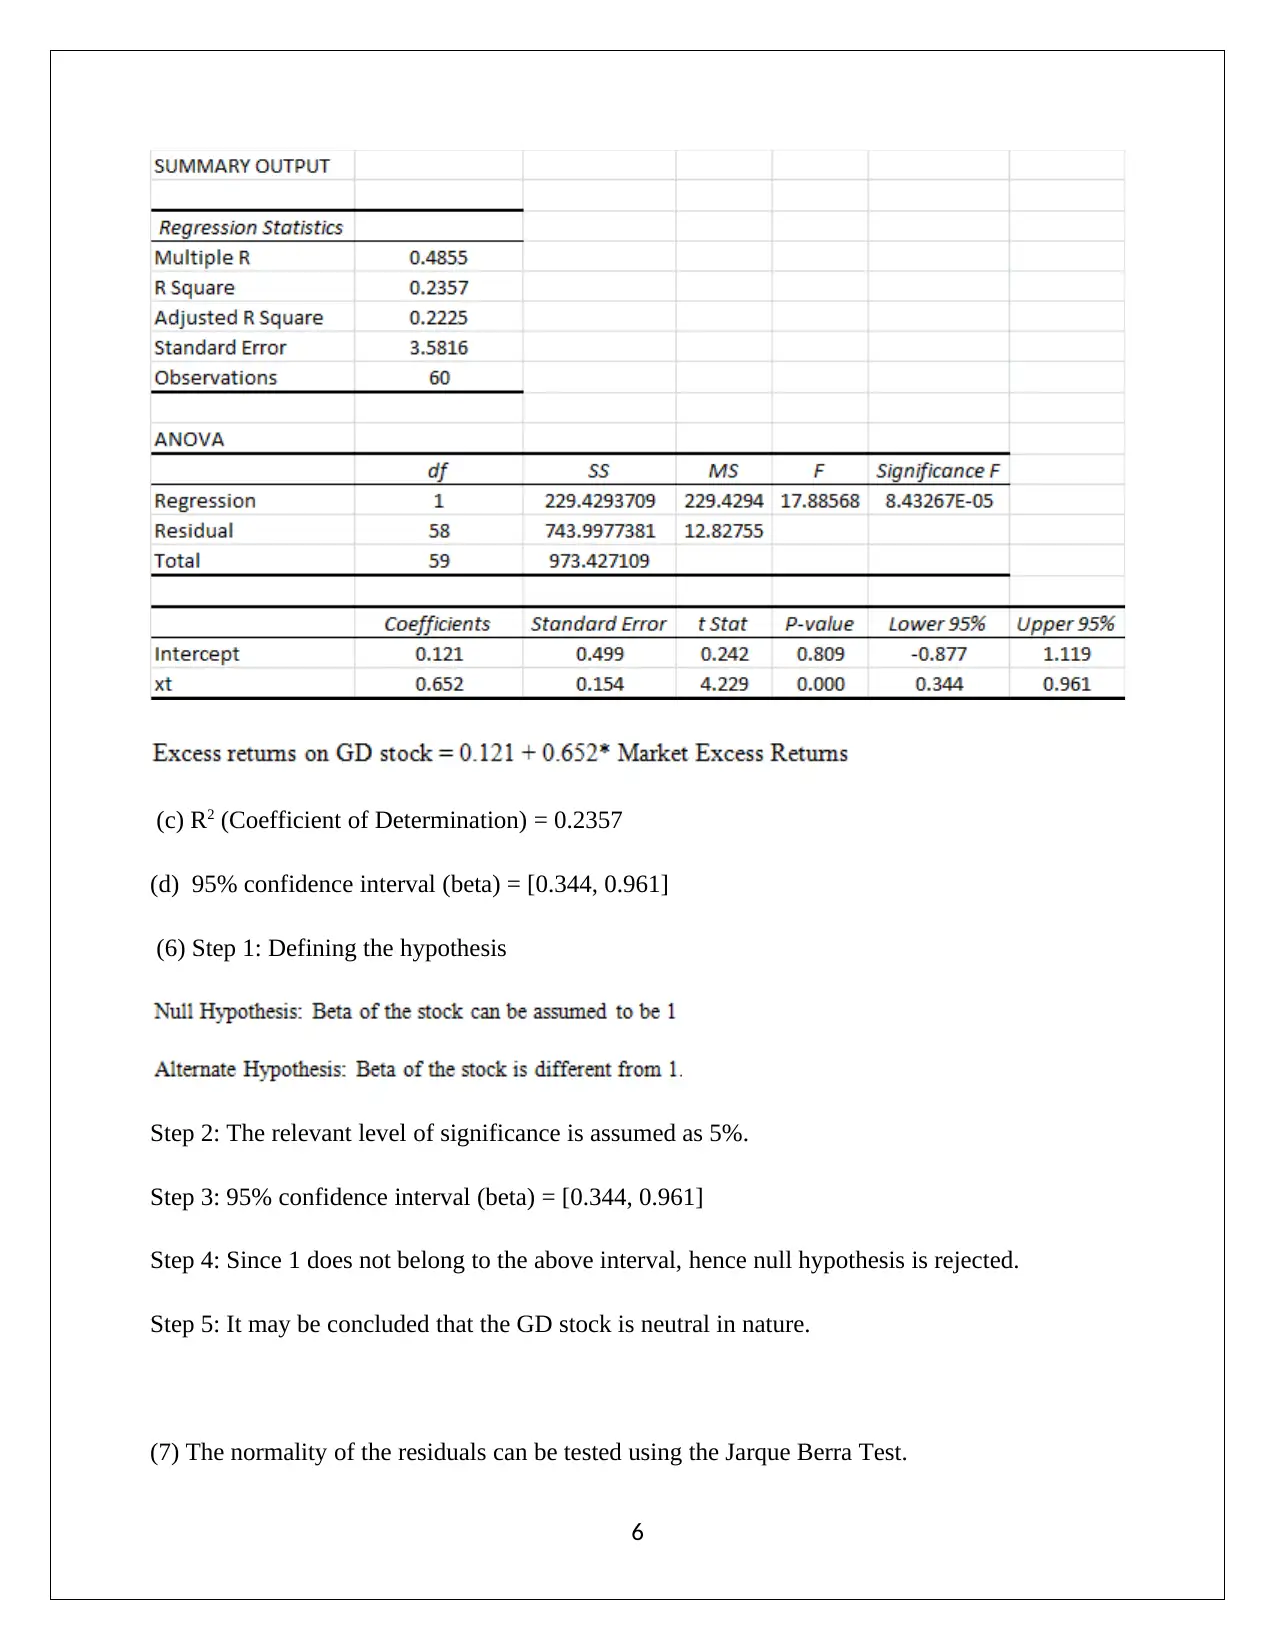
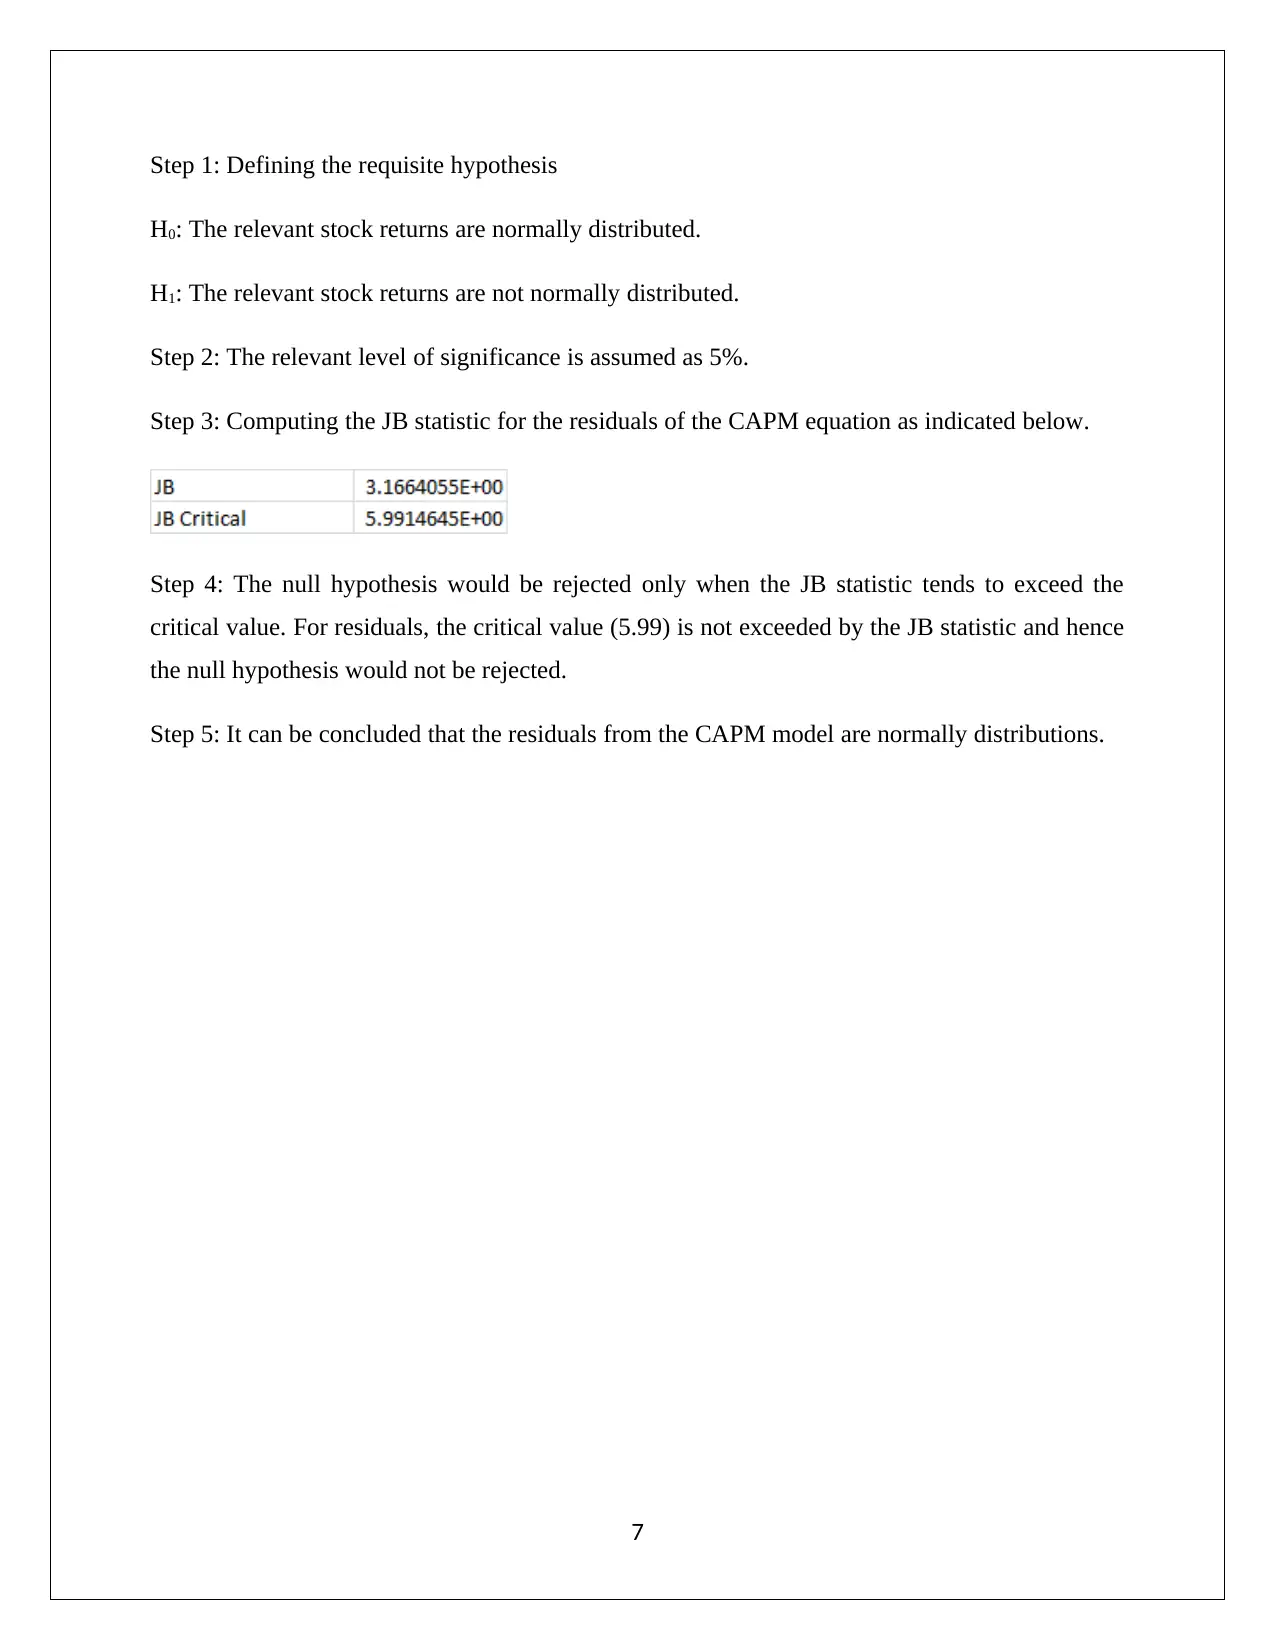
This assignment focuses on the statistical analysis of stock returns for Boeing Company and General Dynamics. It involves computing monthly returns, testing for normality using the Jarque-Bera test, and conducting hypothesis tests to compare returns and risks. The analysis includes t-tests, F-tests, and the application of the CAPM model to determine beta, the coefficient of determination, and confidence intervals. The assignment concludes with interpretations of the statistical results, including the significance of differences in risk and return, the interpretation of beta, and an assessment of the model's fit. The student concludes that General Dynamics stock is preferred due to its higher average returns and lower risk. The normality of the residuals from the CAPM model is also assessed.

1 out of 9
Related Documents


Your All-in-One AI-Powered Toolkit for Academic Success.
+13062052269
info@desklib.com
Available 24*7 on WhatsApp / Email
![[object Object]](/_next/static/media/star-bottom.7253800d.svg)
Copyright © 2020–2026 A2Z Services. All Rights Reserved. Developed and managed by ZUCOL.