TPG Telecom's Financial Review: A Comprehensive Business Analysis
VerifiedAdded on 2023/05/27
|23
|5400
|357
Report
AI Summary
This report provides a comprehensive overview of TPG Telecom's financial position, analyzing its performance in the market. It examines key aspects such as customer growth, corporate revenues, and financial results, including a detailed analysis of revenue streams, cash flow, and balance sheet components like debt, cash equivalents, receivables, payables, assets, and liabilities. The report also touches upon TPG Telecom's securities trading policy, ensuring compliance with insider trading laws. By reviewing the company's operating and financial data, the report aims to assess the overall financial health and strategic initiatives employed by TPG Telecom to maintain and enhance its market position.
Running head: BUSINESS FINANCE
TPG Telecom
Business Finance
12/24/2018
TPG Telecom
Business Finance
12/24/2018
Paraphrase This Document
Need a fresh take? Get an instant paraphrase of this document with our AI Paraphraser
BUSINESS FINANCE 1
Table of Contents
Introduction................................................................................................................................2
Overview of TPG Telecom....................................................................................................2
Financial Market....................................................................................................................3
Types of Financial Market.................................................................................................4
Securities Trading Policy.......................................................................................................6
Operating and Financial Review............................................................................................6
Customer Growth...............................................................................................................6
Corporate Revenues...........................................................................................................7
Financial Results Review.......................................................................................................8
Revenue..............................................................................................................................8
Analysis of Cash Flow...........................................................................................................9
Free Cash flow...................................................................................................................9
Non –Operating Cash Flow..............................................................................................10
Balance Sheet.......................................................................................................................11
Debt..................................................................................................................................11
Cash and Cash Equivalents..............................................................................................11
Receivables and Payables................................................................................................12
Assets...............................................................................................................................12
Liabilities..........................................................................................................................12
Conclusion................................................................................................................................13
References................................................................................................................................14
BUSINESS FINANCE 2
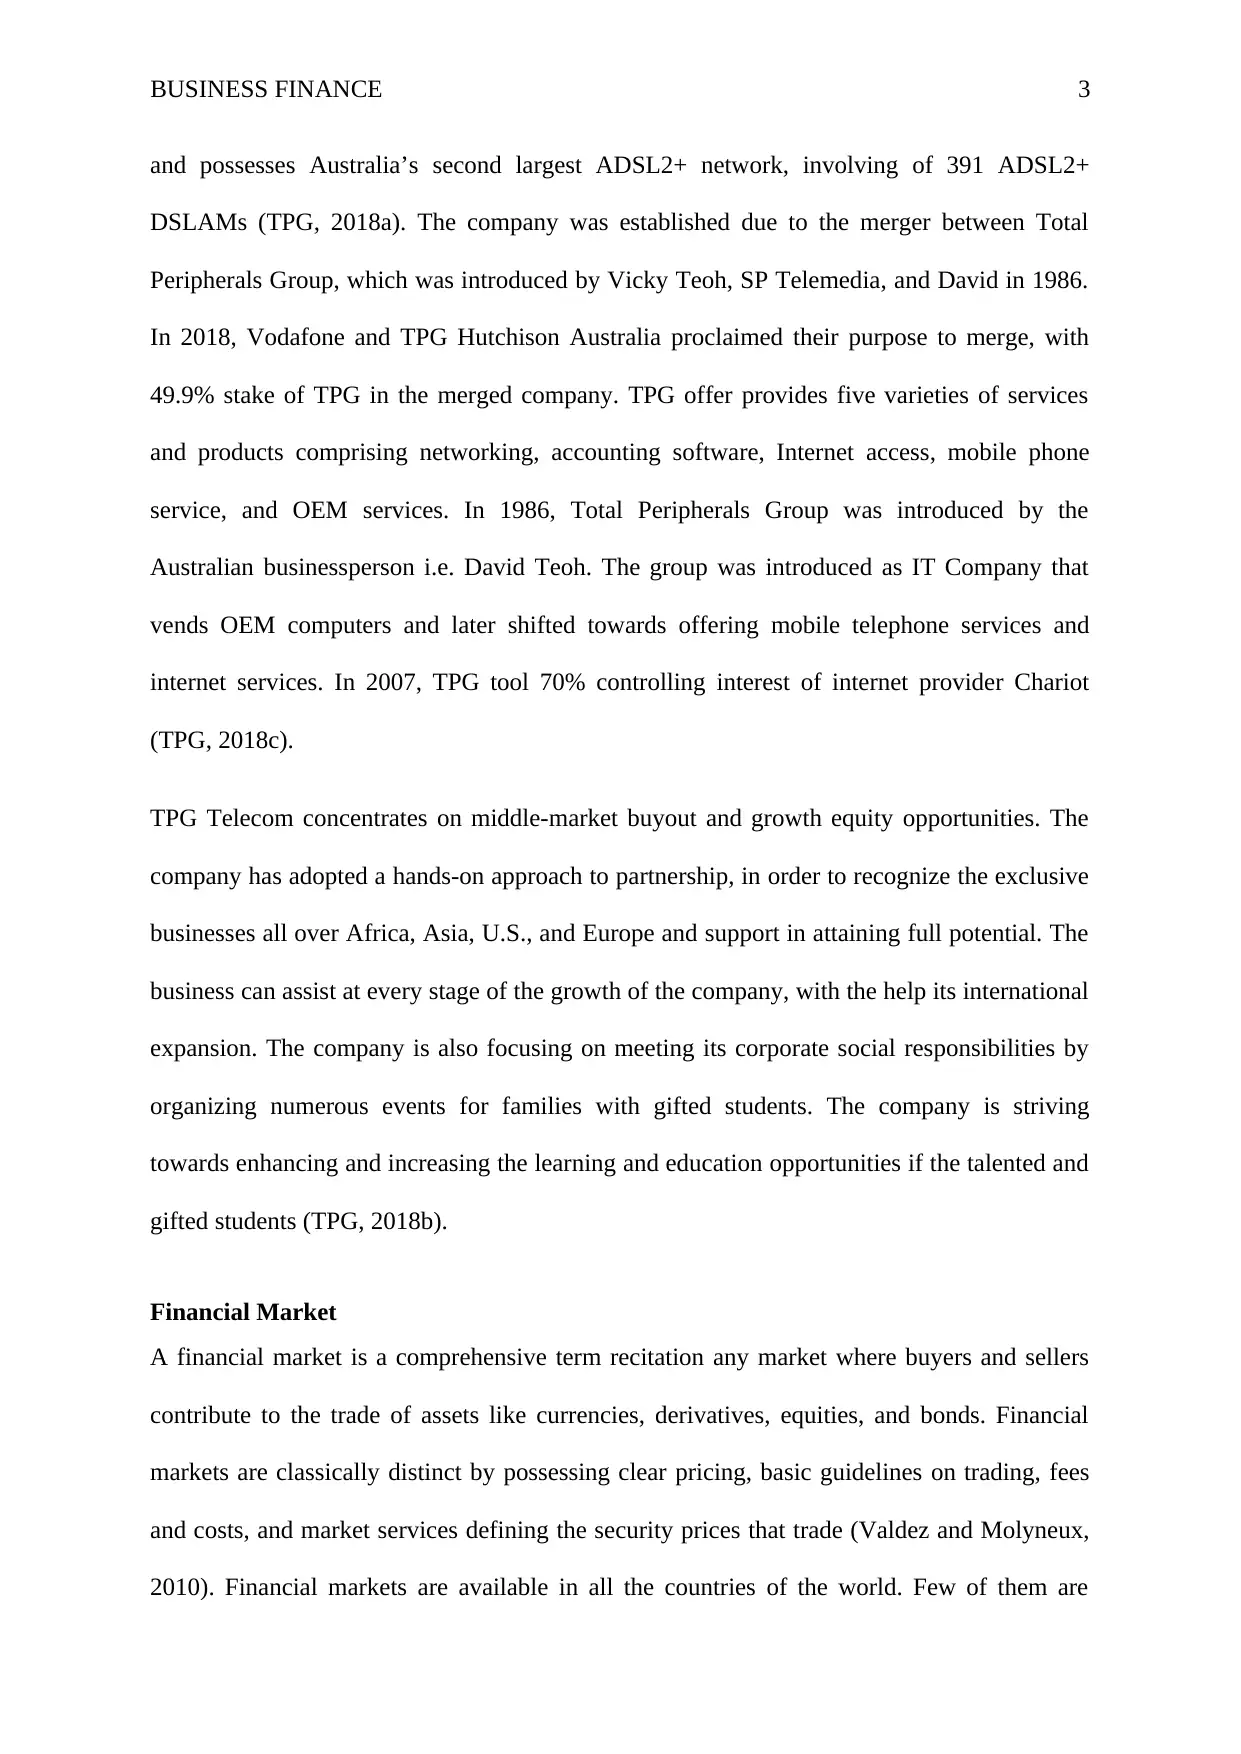
Introduction
Business finance is the money required to introduce and operate a business, which comprises
diversifying or modernizing operations and expansion. The business finance term comprises
the manner in which a firm uses and obtain money, frequently in terms of loans. In other
words, it is about strategies for investing, earning, and saving revenue. Business finance is
very essential for every firm to take on business and achieve success; a business needs
noteworthy investment to obtain new capital, inventory, or staff (Tracy and Tracy, 2011). In
the short-term, businesses need finance in the context of working capital in order to fulfil
operational expenses like raw materials, interest payments, remunerative payments,
inventory, etc. Correct financial for short-term and long-term and upkeep of good flow of
working capital is vital to retain the operations going. This is the duty of the business
managers to manage the investment and funds in the company such that they can be used at
the right time and place. All the situations are diverse, but smart managers take success cost
and their options for attaining financial growth (Borowski, 2010). The aim of this report is to
provide an overview of the financial position of TPG Telecom. The report will present
financial statements of TPG Telecom that will represent whether the financial position of the
company is strong or weak. Moreover, the different strategies used by the business to survive
and grow in the market will be elaborated into the report.
Overview of TPG Telecom
TPG Telecom Limited is an IT and Telecommunication Company of Australia that
specializes in business and consumer internet services along with mobile telephone services.
According to the reports of 2015, TPG Telecom is the second largest Australian internet
service provider and is the biggest virtual network operator. The company has around
360,000 mobile subscribers, 358,000 landline subscribers, and 671,000 ADSL2+ subscribers,
⊘ This is a preview!⊘
Do you want full access?
Subscribe today to unlock all pages.
Trusted by 1+ million students worldwide
BUSINESS FINANCE 3
and possesses Australia’s second largest ADSL2+ network, involving of 391 ADSL2+
DSLAMs (TPG, 2018a). The company was established due to the merger between Total
Peripherals Group, which was introduced by Vicky Teoh, SP Telemedia, and David in 1986.
In 2018, Vodafone and TPG Hutchison Australia proclaimed their purpose to merge, with
49.9% stake of TPG in the merged company. TPG offer provides five varieties of services
and products comprising networking, accounting software, Internet access, mobile phone
service, and OEM services. In 1986, Total Peripherals Group was introduced by the
Australian businessperson i.e. David Teoh. The group was introduced as IT Company that
vends OEM computers and later shifted towards offering mobile telephone services and
internet services. In 2007, TPG tool 70% controlling interest of internet provider Chariot
(TPG, 2018c).
TPG Telecom concentrates on middle-market buyout and growth equity opportunities. The
company has adopted a hands-on approach to partnership, in order to recognize the exclusive
businesses all over Africa, Asia, U.S., and Europe and support in attaining full potential. The
business can assist at every stage of the growth of the company, with the help its international
expansion. The company is also focusing on meeting its corporate social responsibilities by
organizing numerous events for families with gifted students. The company is striving
towards enhancing and increasing the learning and education opportunities if the talented and
gifted students (TPG, 2018b).
Financial Market
A financial market is a comprehensive term recitation any market where buyers and sellers
contribute to the trade of assets like currencies, derivatives, equities, and bonds. Financial
markets are classically distinct by possessing clear pricing, basic guidelines on trading, fees
and costs, and market services defining the security prices that trade (Valdez and Molyneux,
2010). Financial markets are available in all the countries of the world. Few of them are
Paraphrase This Document
Need a fresh take? Get an instant paraphrase of this document with our AI Paraphraser
BUSINESS FINANCE 4
small, with a limited number of participants, whereas others such as Forex markets and New
York Stock Exchange (NYSE) are involved in the trading of trillions of dollars every day.
Types of Financial Market
Capital Markets
In the capital market, institutions and individuals trade their financial securities. Institutions
and organizations from the private and public sectors also frequently vend securities in this
market to raise funds. Therefore, this kind of market is created of both the secondary and
primary markets. There are two types of market in the capital market i.e. Stock market and
bond market (Goyal and Goyal, 2014).
Stock Market
In Stock markets, stockholders are permitted to buy and sell their shares in the publicly traded
businesses. These are the essential market economy area because they offer business as
access to investors and capital with a share of ownership with the business and the possibility
of gains depending on the future performance of the company (Campbell, Lo and MacKinlay,
2012).
Bond Markets
A bond is commonly known as a debt investment under which an investor advances money to
a business that can be governmental or corporate. This business takes funds for the prescribed
time duration at a fixed rate of interest. Different businesses, states, U.S. and a foreign
government, and municipalities utilize bonds in order to finance a range of activities and
projects (Madura, 2016).
Money Market
The money market is the financial market segment under which trading of financial
instruments with great liquidity and short maturities take place. Participants use the money
BUSINESS FINANCE 5
market for lending and borrowing in the short run, from numerous days in a year. Securities
of money market comprised of banker’s acceptance, municipal notes, negotiable certificates
of deposit (CDs), repurchase agreement, federal funds, U.S. Treasury bills, Eurodollars, and
commercial paper (Burton, 2010).
Spot or Cash Market
Capitalizing in the cash market is extremely cultured, as it possesses opportunities for both
big gains and big losses. Under the cash market, products are vended for cash and are
delivered directly.
Derivatives Markets
The derivative is the name selected for this market because the value is derived from its
original assets. A derivative is an agreement and the price of the contract is dogged by the
core asset price in the market (Levinson, 2018).
Primary and Secondary Market
New securities are issued in the primary market on an exchange. Businesses, government,
and other different groups attain financing with the help of equity or debt based securities.
Primary markets are also called as "new issue markets," are enabled by guaranteeing groups,
which contain investment brands that will arrange a beginning range of the price for a
oversee security and then supervise its transaction straight to investors.
The market where investors buy assets or securities from a different investor is known as a
secondary market. The SEC or Securities and Exchange Commission records securities
preceding to their initial issuance, then they initiate trading in the market such as Nasdaq,
New York Stock Exchange, or other different stock exchange where the assets and securities
have been putative for trading and listing (Talmor and Vasvari, 2011).
⊘ This is a preview!⊘
Do you want full access?
Subscribe today to unlock all pages.
Trusted by 1+ million students worldwide
BUSINESS FINANCE 6
TPG is also an investment company. It is the biggest investment firm in terms of private
equity in the world, concentrated towards growth capital and leveraged buyouts, TPG handles
investment funds concentrating in public equity, debt investments, growth capital, and
venture capital. The company invests in a wide variety of industries comprising industrials,
health care, consumer/retail, travel, leisure, media, and telecommunications.
Securities Trading Policy
TPG Telecom has adopted the Securities Trading policy in order to confirm that the
employees, executives, and directors of the company follow the laws related to insider
trading. This policy offers guidance for the employees, executives, and directors in terms of
their dealing in the company's security. It forms part of the corporate governance compliance
of the company and any breach to the policy can result in disciplinary action that can be
comprised of termination of the employment. Penalties for the breach of the provision of
insider trading of the corporation's act comprises fines and in few of the cases imprisonment
(TPG, 2010).
Operating and Financial Review
Customer Growth
Group Broadband Subscribers
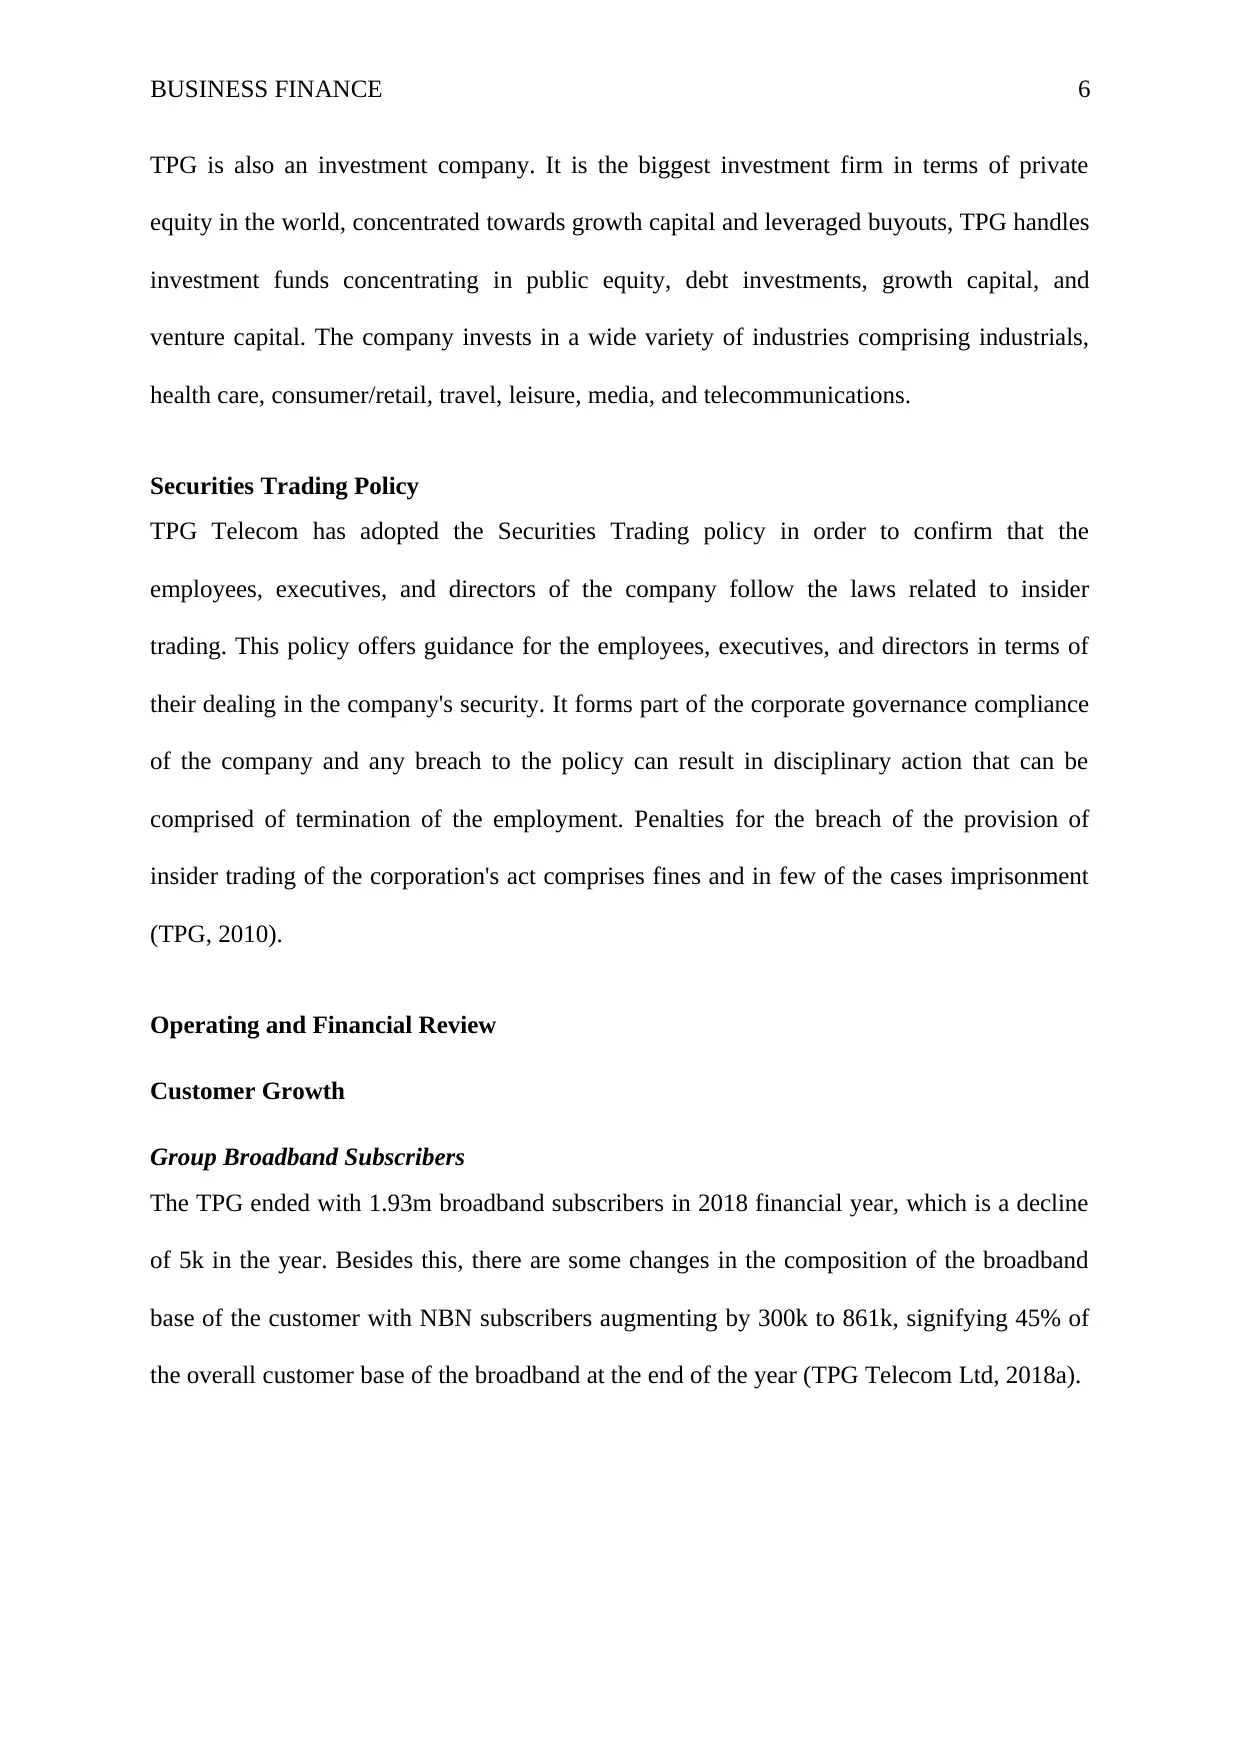
The TPG ended with 1.93m broadband subscribers in 2018 financial year, which is a decline
of 5k in the year. Besides this, there are some changes in the composition of the broadband
base of the customer with NBN subscribers augmenting by 300k to 861k, signifying 45% of
the overall customer base of the broadband at the end of the year (TPG Telecom Ltd, 2018a).
TPG is also an investment company. It is the biggest investment firm in terms of private
equity in the world, concentrated towards growth capital and leveraged buyouts, TPG handles
investment funds concentrating in public equity, debt investments, growth capital, and
venture capital. The company invests in a wide variety of industries comprising industrials,
health care, consumer/retail, travel, leisure, media, and telecommunications.
Securities Trading Policy
TPG Telecom has adopted the Securities Trading policy in order to confirm that the
employees, executives, and directors of the company follow the laws related to insider
trading. This policy offers guidance for the employees, executives, and directors in terms of
their dealing in the company's security. It forms part of the corporate governance compliance
of the company and any breach to the policy can result in disciplinary action that can be
comprised of termination of the employment. Penalties for the breach of the provision of
insider trading of the corporation's act comprises fines and in few of the cases imprisonment
(TPG, 2010).
Operating and Financial Review
Customer Growth
Group Broadband Subscribers
The TPG ended with 1.93m broadband subscribers in 2018 financial year, which is a decline
of 5k in the year. Besides this, there are some changes in the composition of the broadband
base of the customer with NBN subscribers augmenting by 300k to 861k, signifying 45% of
the overall customer base of the broadband at the end of the year (TPG Telecom Ltd, 2018a).
Paraphrase This Document
Need a fresh take? Get an instant paraphrase of this document with our AI Paraphraser
BUSINESS FINANCE 7
Source [(TPG Telecom Ltd, 2018a)]
Corporate Revenues
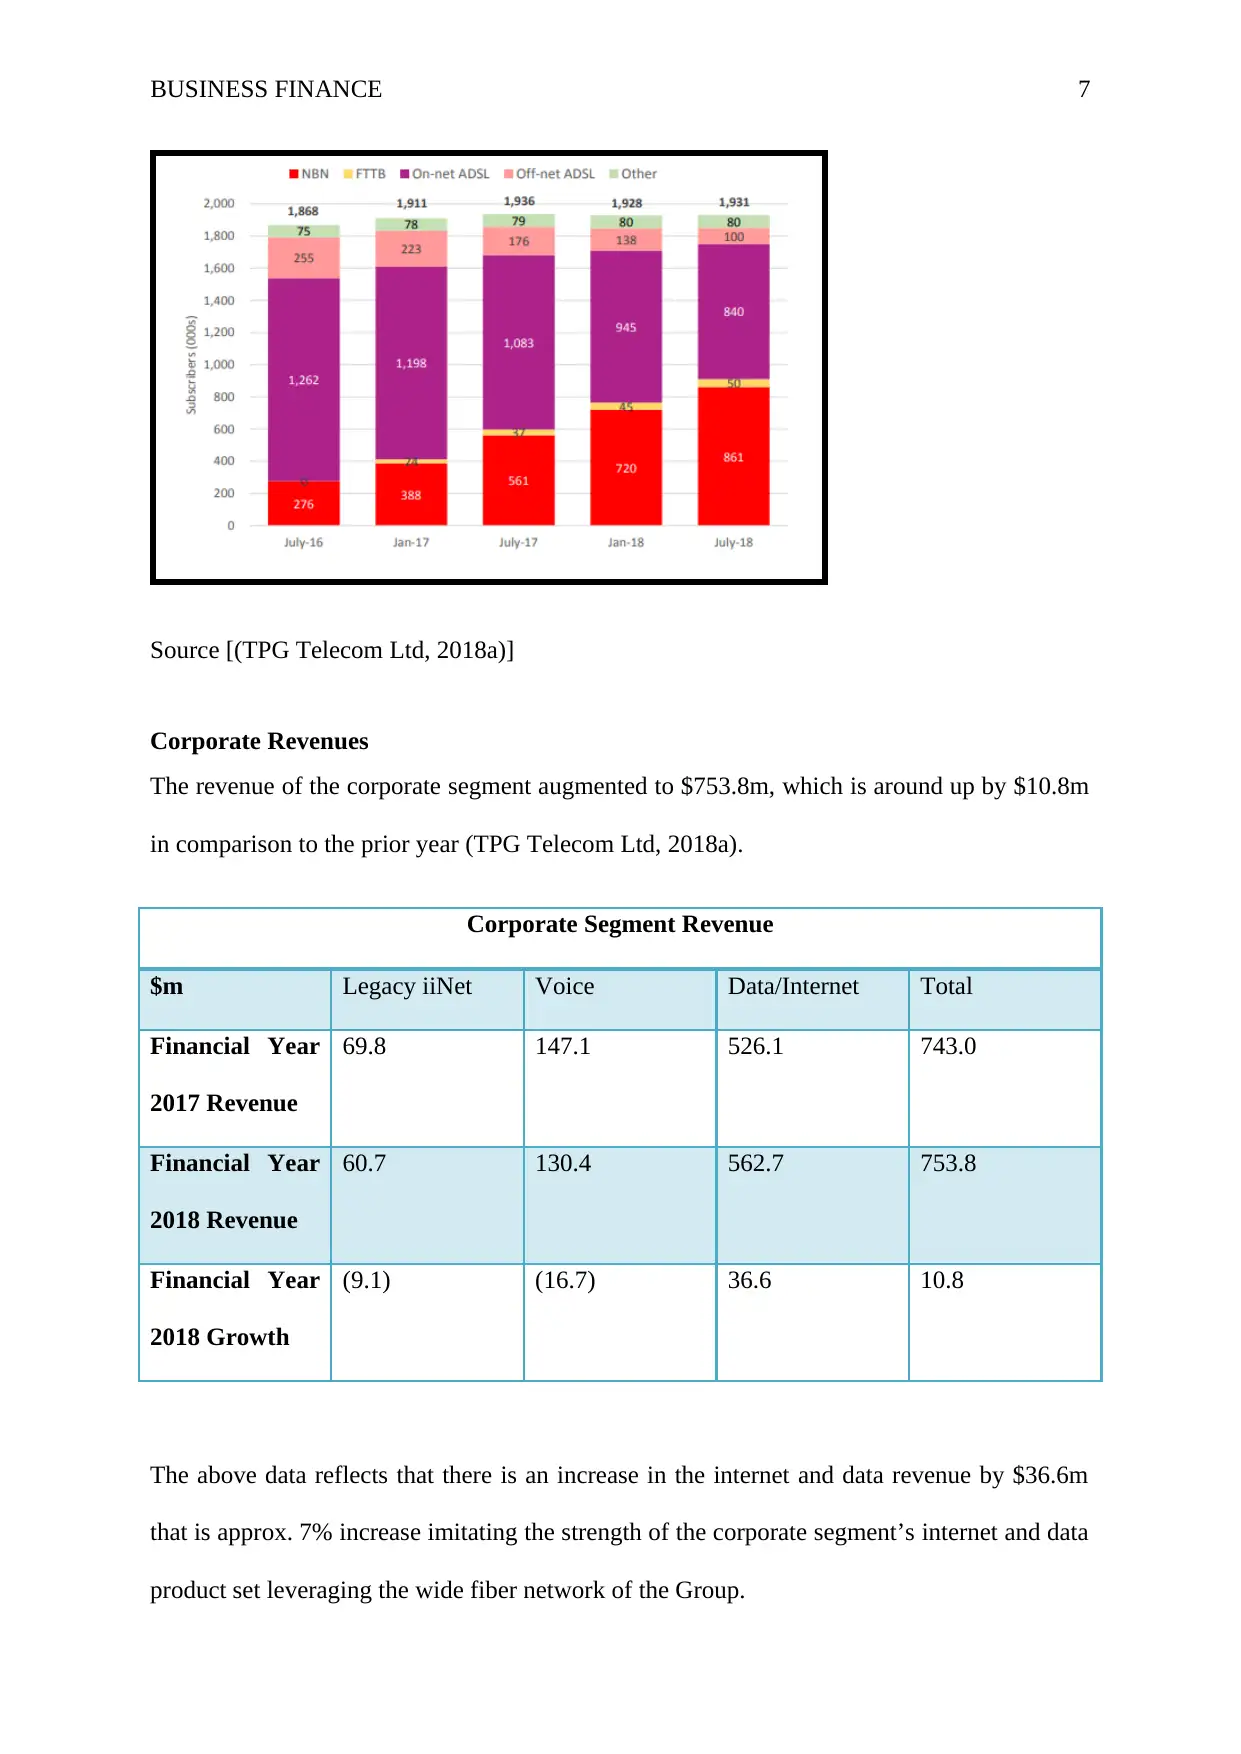
The revenue of the corporate segment augmented to $753.8m, which is around up by $10.8m
in comparison to the prior year (TPG Telecom Ltd, 2018a).
Corporate Segment Revenue
$m Legacy iiNet Voice Data/Internet Total
Financial Year
2017 Revenue
69.8 147.1 526.1 743.0
Financial Year
2018 Revenue
60.7 130.4 562.7 753.8
Financial Year
2018 Growth
(9.1) (16.7) 36.6 10.8
The above data reflects that there is an increase in the internet and data revenue by $36.6m
that is approx. 7% increase imitating the strength of the corporate segment’s internet and data
product set leveraging the wide fiber network of the Group.
Source [(TPG Telecom Ltd, 2018a)]
Corporate Revenues
The revenue of the corporate segment augmented to $753.8m, which is around up by $10.8m
in comparison to the prior year (TPG Telecom Ltd, 2018a).
Corporate Segment Revenue
$m Legacy iiNet Voice Data/Internet Total
Financial Year
2017 Revenue
69.8 147.1 526.1 743.0
Financial Year
2018 Revenue
60.7 130.4 562.7 753.8
Financial Year
2018 Growth
(9.1) (16.7) 36.6 10.8
The above data reflects that there is an increase in the internet and data revenue by $36.6m
that is approx. 7% increase imitating the strength of the corporate segment’s internet and data
product set leveraging the wide fiber network of the Group.
BUSINESS FINANCE 8
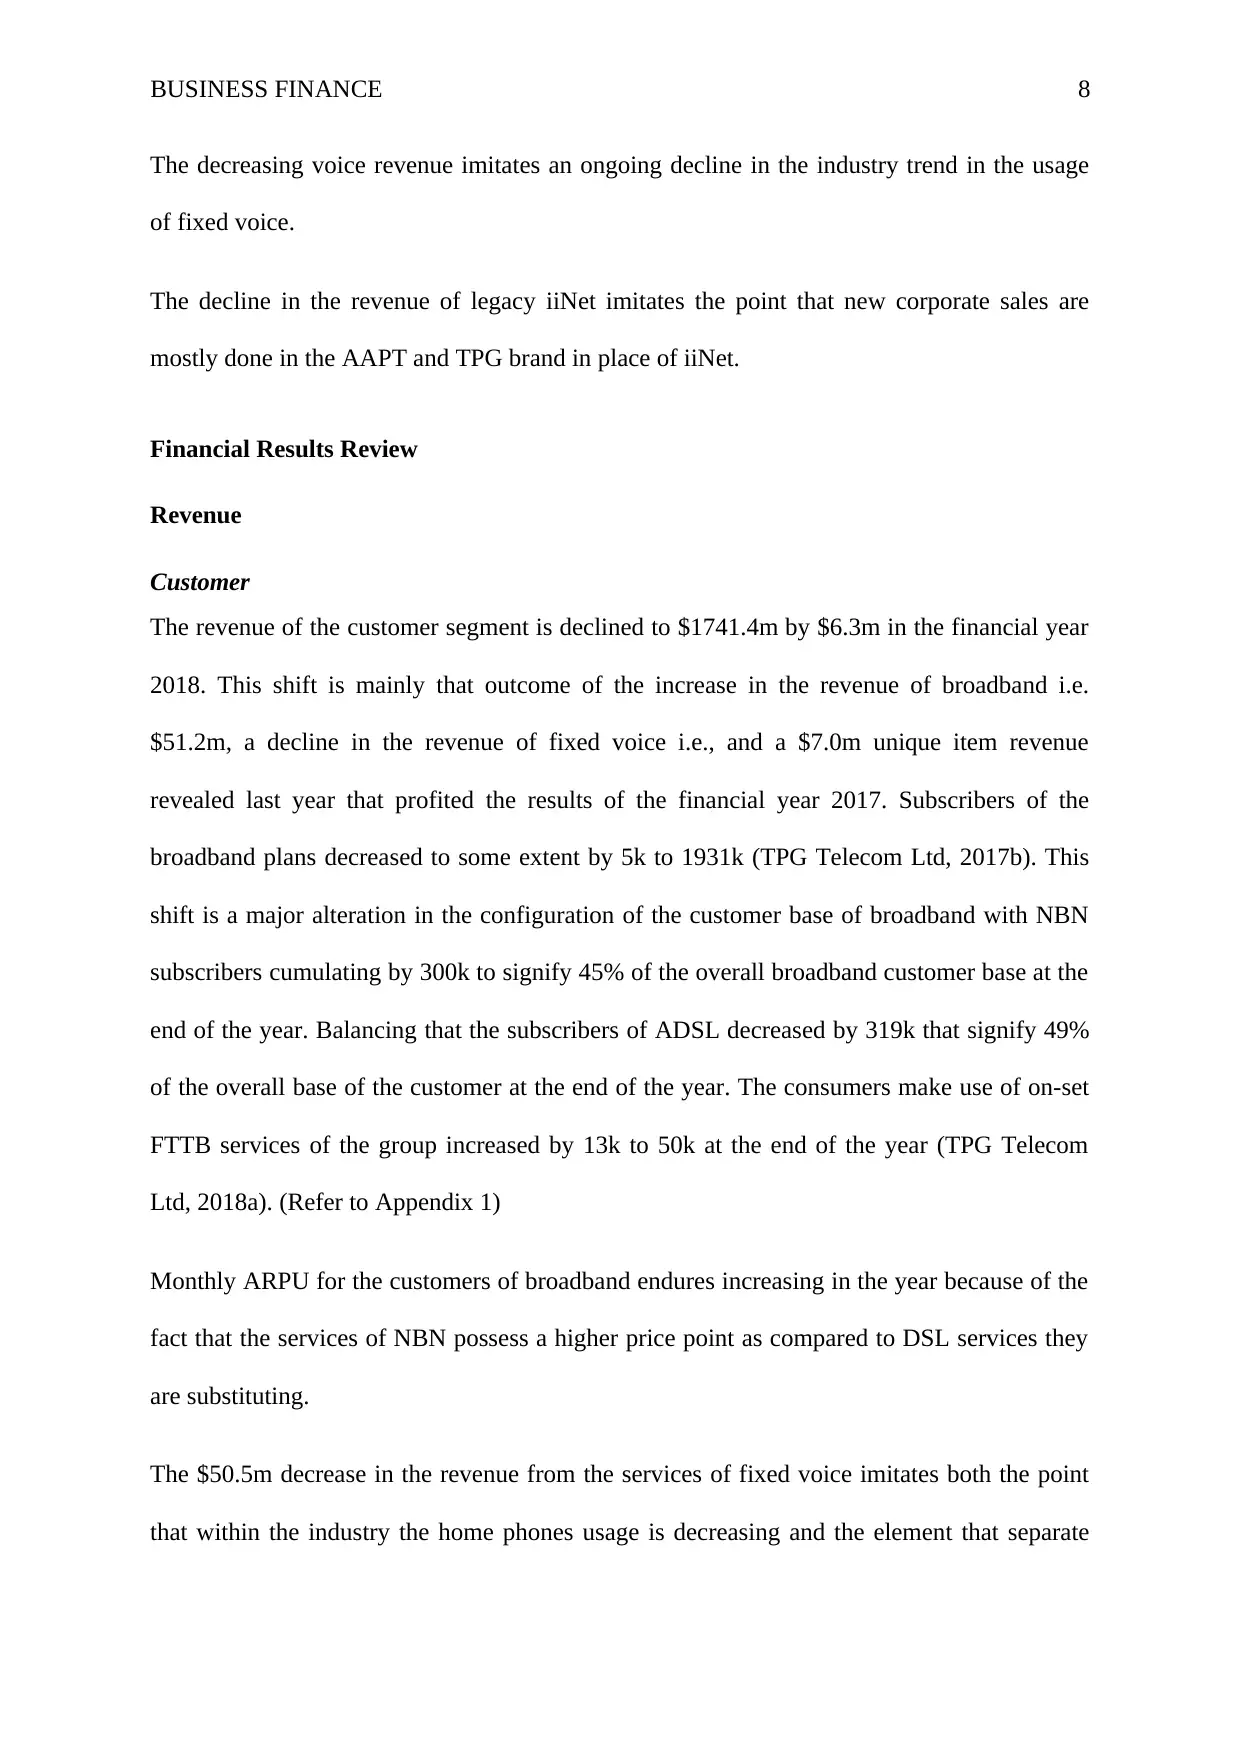
The decreasing voice revenue imitates an ongoing decline in the industry trend in the usage
of fixed voice.
The decline in the revenue of legacy iiNet imitates the point that new corporate sales are
mostly done in the AAPT and TPG brand in place of iiNet.
Financial Results Review
Revenue
Customer
The revenue of the customer segment is declined to $1741.4m by $6.3m in the financial year
2018. This shift is mainly that outcome of the increase in the revenue of broadband i.e.
$51.2m, a decline in the revenue of fixed voice i.e., and a $7.0m unique item revenue
revealed last year that profited the results of the financial year 2017. Subscribers of the
broadband plans decreased to some extent by 5k to 1931k (TPG Telecom Ltd, 2017b). This
shift is a major alteration in the configuration of the customer base of broadband with NBN
subscribers cumulating by 300k to signify 45% of the overall broadband customer base at the
end of the year. Balancing that the subscribers of ADSL decreased by 319k that signify 49%
of the overall base of the customer at the end of the year. The consumers make use of on-set
FTTB services of the group increased by 13k to 50k at the end of the year (TPG Telecom
Ltd, 2018a). (Refer to Appendix 1)
Monthly ARPU for the customers of broadband endures increasing in the year because of the
fact that the services of NBN possess a higher price point as compared to DSL services they
are substituting.
The $50.5m decrease in the revenue from the services of fixed voice imitates both the point
that within the industry the home phones usage is decreasing and the element that separate
⊘ This is a preview!⊘
Do you want full access?
Subscribe today to unlock all pages.
Trusted by 1+ million students worldwide
BUSINESS FINANCE 9
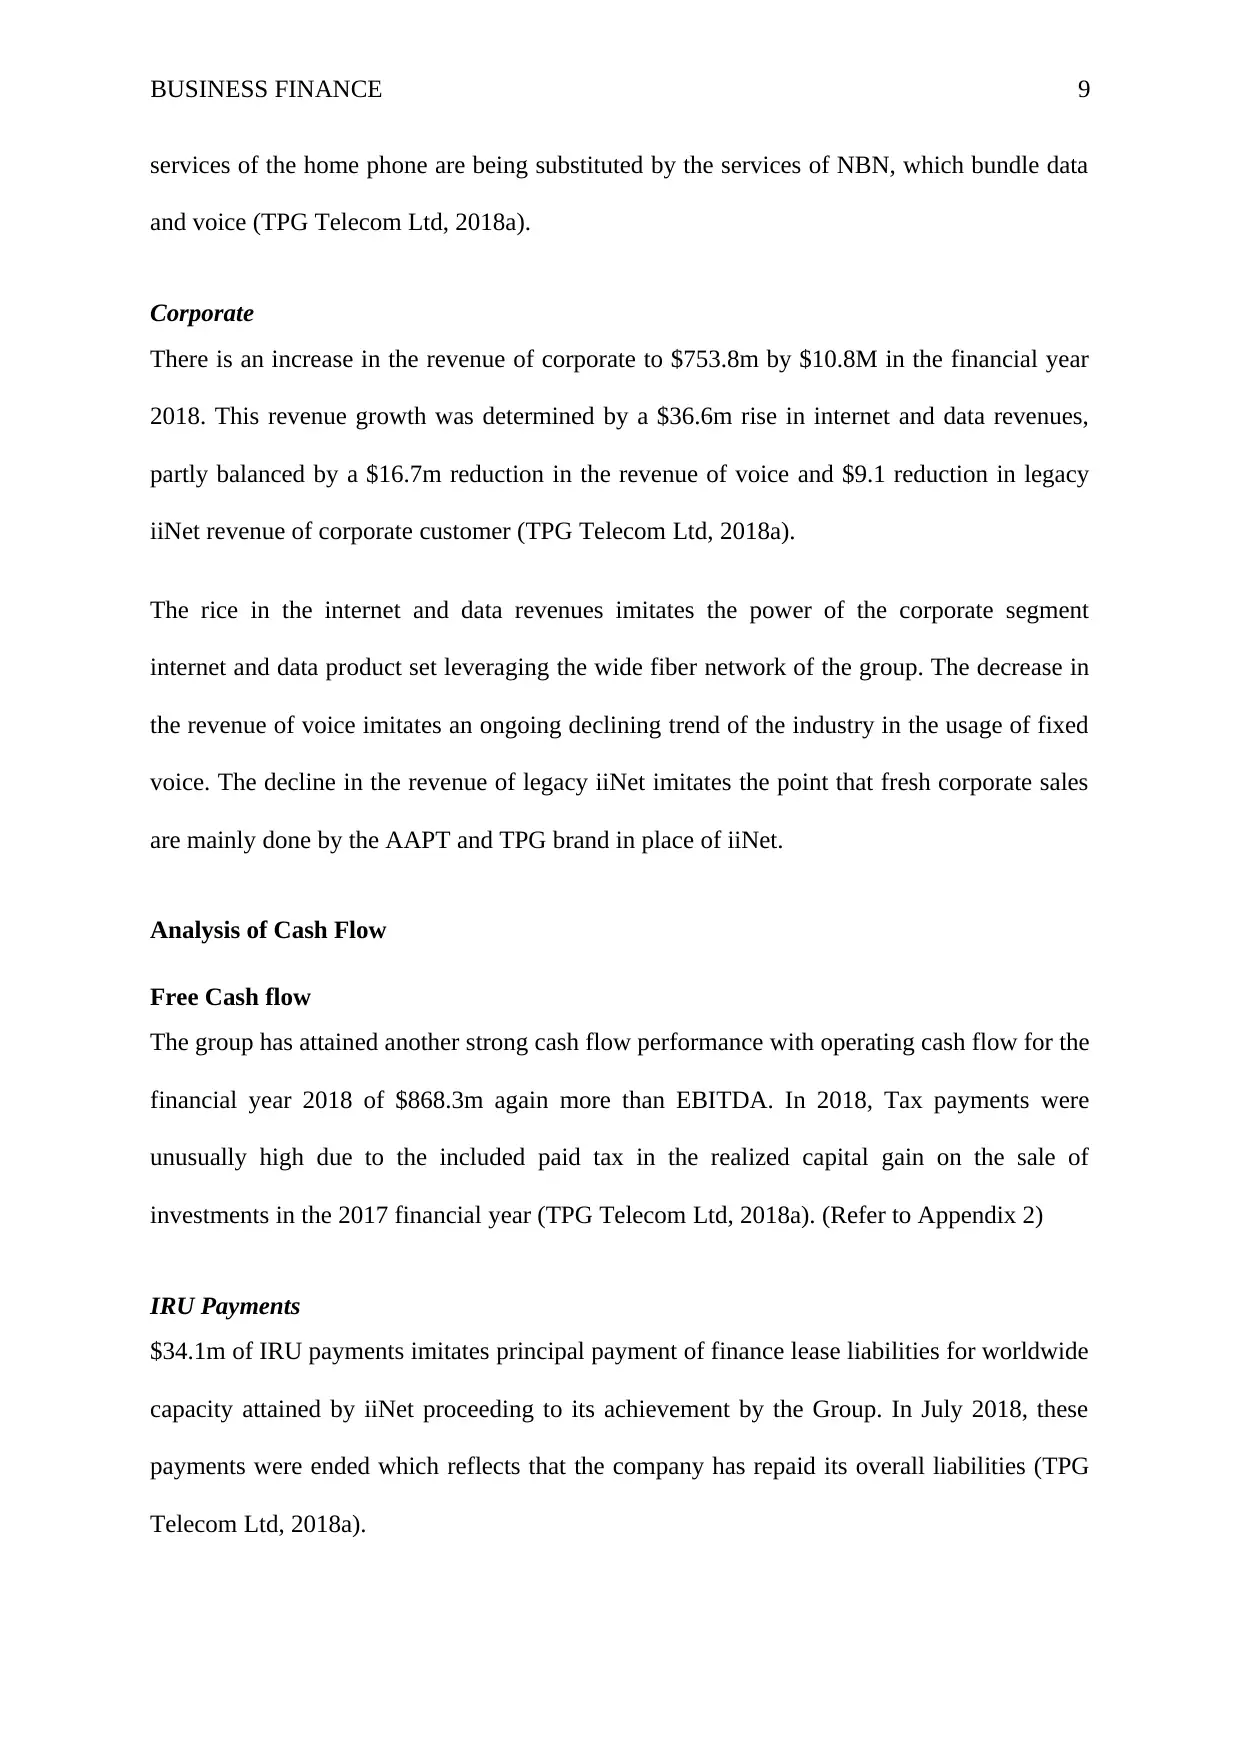
services of the home phone are being substituted by the services of NBN, which bundle data
and voice (TPG Telecom Ltd, 2018a).
Corporate
There is an increase in the revenue of corporate to $753.8m by $10.8M in the financial year
2018. This revenue growth was determined by a $36.6m rise in internet and data revenues,
partly balanced by a $16.7m reduction in the revenue of voice and $9.1 reduction in legacy
iiNet revenue of corporate customer (TPG Telecom Ltd, 2018a).
The rice in the internet and data revenues imitates the power of the corporate segment
internet and data product set leveraging the wide fiber network of the group. The decrease in
the revenue of voice imitates an ongoing declining trend of the industry in the usage of fixed
voice. The decline in the revenue of legacy iiNet imitates the point that fresh corporate sales
are mainly done by the AAPT and TPG brand in place of iiNet.
Analysis of Cash Flow
Free Cash flow
The group has attained another strong cash flow performance with operating cash flow for the
financial year 2018 of $868.3m again more than EBITDA. In 2018, Tax payments were
unusually high due to the included paid tax in the realized capital gain on the sale of
investments in the 2017 financial year (TPG Telecom Ltd, 2018a). (Refer to Appendix 2)
IRU Payments
$34.1m of IRU payments imitates principal payment of finance lease liabilities for worldwide
capacity attained by iiNet proceeding to its achievement by the Group. In July 2018, these
payments were ended which reflects that the company has repaid its overall liabilities (TPG
Telecom Ltd, 2018a).
Paraphrase This Document
Need a fresh take? Get an instant paraphrase of this document with our AI Paraphraser
BUSINESS FINANCE 10
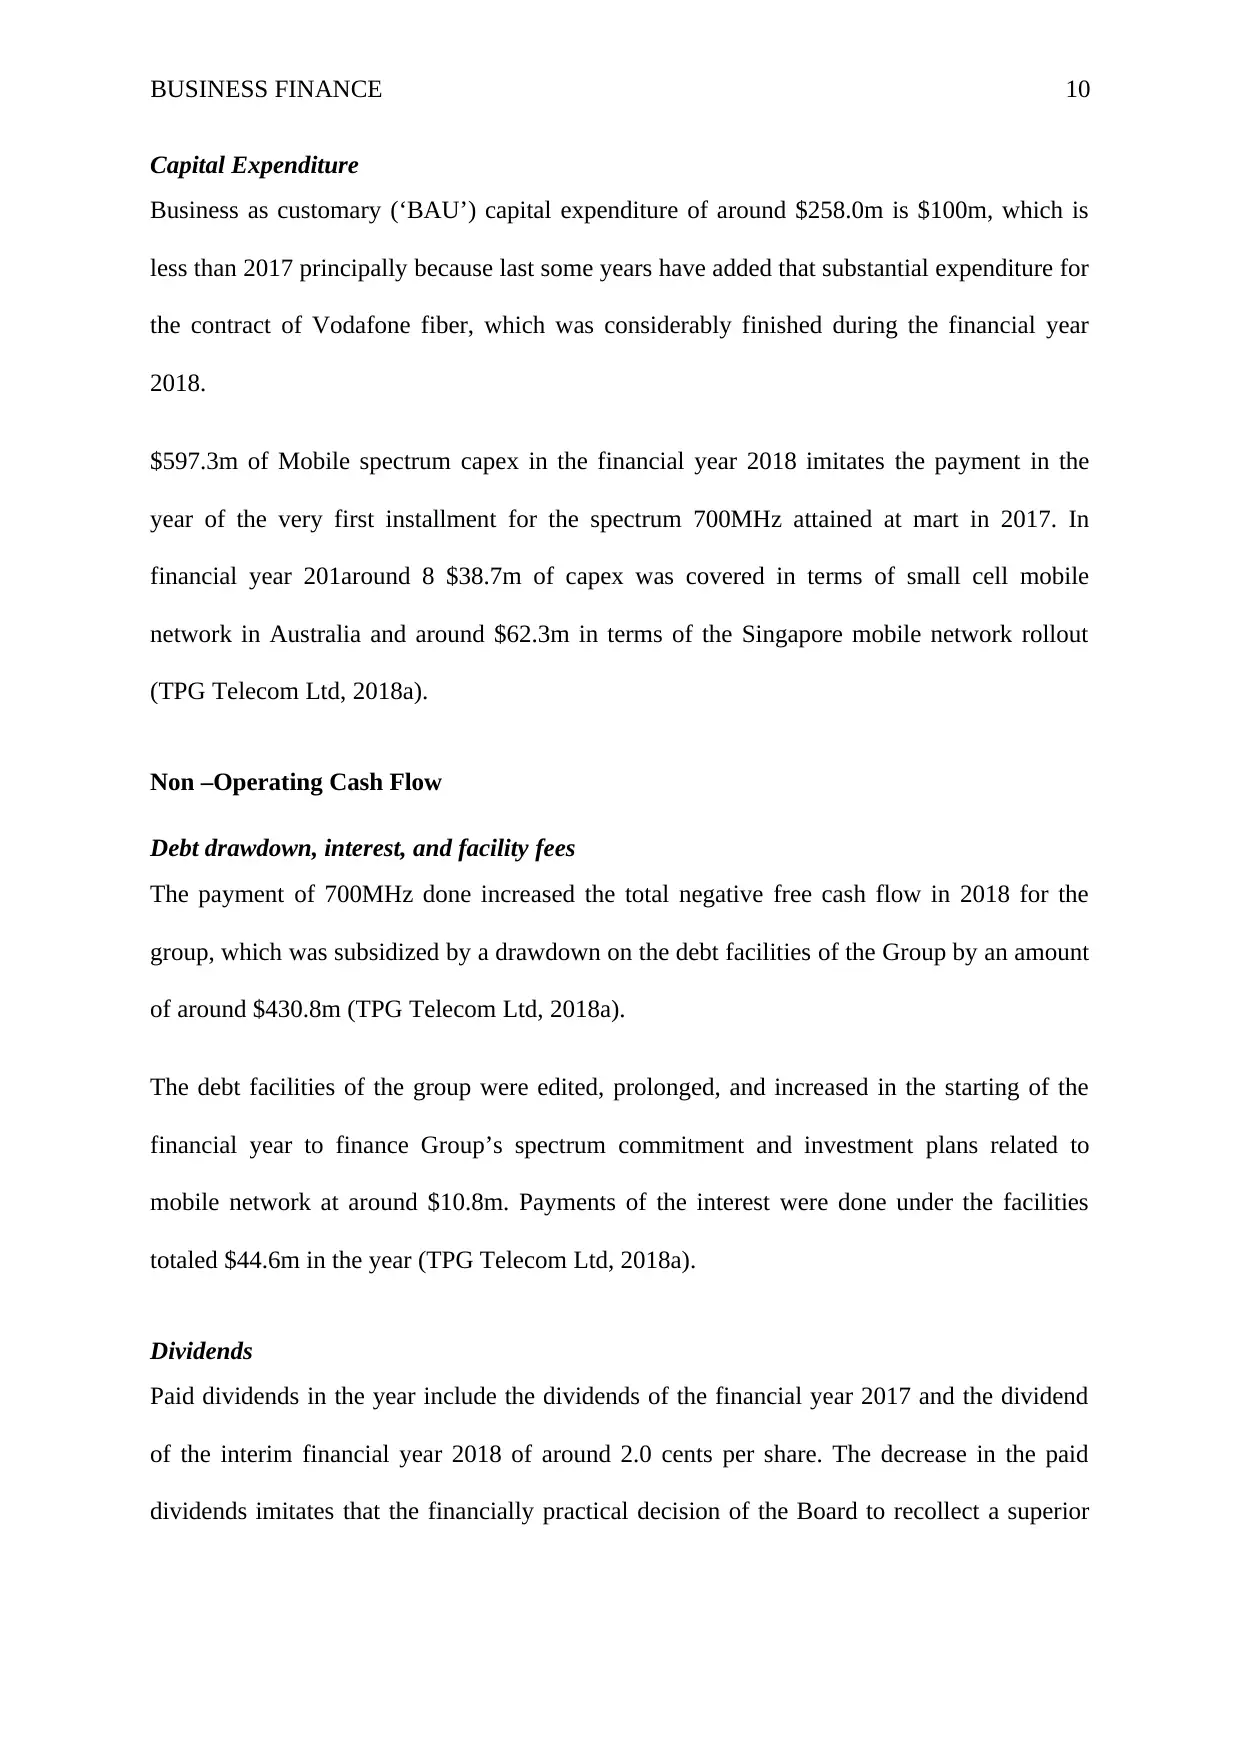
Capital Expenditure
Business as customary (‘BAU’) capital expenditure of around $258.0m is $100m, which is
less than 2017 principally because last some years have added that substantial expenditure for
the contract of Vodafone fiber, which was considerably finished during the financial year
2018.
$597.3m of Mobile spectrum capex in the financial year 2018 imitates the payment in the
year of the very first installment for the spectrum 700MHz attained at mart in 2017. In
financial year 201around 8 $38.7m of capex was covered in terms of small cell mobile
network in Australia and around $62.3m in terms of the Singapore mobile network rollout
(TPG Telecom Ltd, 2018a).
Non –Operating Cash Flow
Debt drawdown, interest, and facility fees
The payment of 700MHz done increased the total negative free cash flow in 2018 for the
group, which was subsidized by a drawdown on the debt facilities of the Group by an amount
of around $430.8m (TPG Telecom Ltd, 2018a).
The debt facilities of the group were edited, prolonged, and increased in the starting of the
financial year to finance Group’s spectrum commitment and investment plans related to
mobile network at around $10.8m. Payments of the interest were done under the facilities
totaled $44.6m in the year (TPG Telecom Ltd, 2018a).
Dividends
Paid dividends in the year include the dividends of the financial year 2017 and the dividend
of the interim financial year 2018 of around 2.0 cents per share. The decrease in the paid
dividends imitates that the financially practical decision of the Board to recollect a superior
BUSINESS FINANCE 11
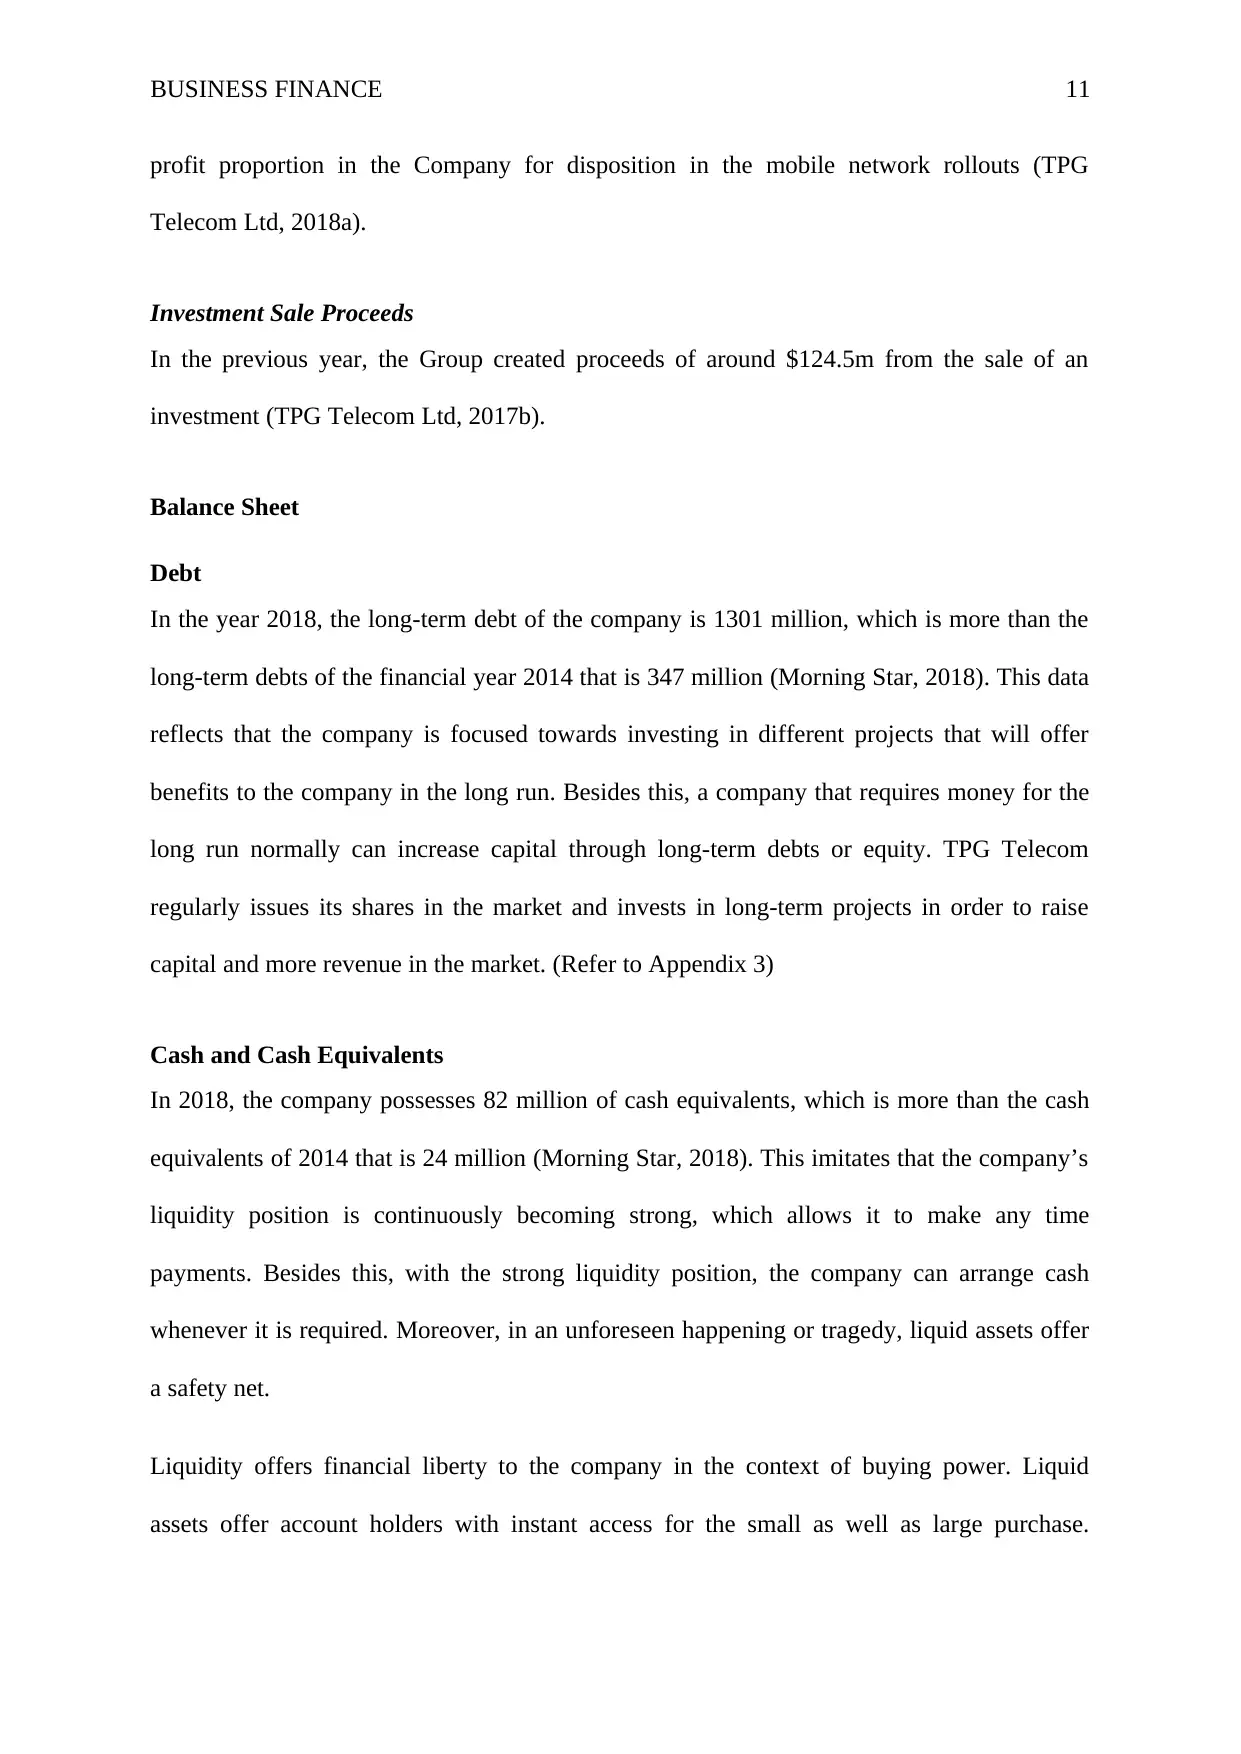
profit proportion in the Company for disposition in the mobile network rollouts (TPG
Telecom Ltd, 2018a).
Investment Sale Proceeds
In the previous year, the Group created proceeds of around $124.5m from the sale of an
investment (TPG Telecom Ltd, 2017b).
Balance Sheet
Debt
In the year 2018, the long-term debt of the company is 1301 million, which is more than the
long-term debts of the financial year 2014 that is 347 million (Morning Star, 2018). This data
reflects that the company is focused towards investing in different projects that will offer
benefits to the company in the long run. Besides this, a company that requires money for the
long run normally can increase capital through long-term debts or equity. TPG Telecom
regularly issues its shares in the market and invests in long-term projects in order to raise
capital and more revenue in the market. (Refer to Appendix 3)
Cash and Cash Equivalents
In 2018, the company possesses 82 million of cash equivalents, which is more than the cash
equivalents of 2014 that is 24 million (Morning Star, 2018). This imitates that the company’s
liquidity position is continuously becoming strong, which allows it to make any time
payments. Besides this, with the strong liquidity position, the company can arrange cash
whenever it is required. Moreover, in an unforeseen happening or tragedy, liquid assets offer
a safety net.
Liquidity offers financial liberty to the company in the context of buying power. Liquid
assets offer account holders with instant access for the small as well as large purchase.
⊘ This is a preview!⊘
Do you want full access?
Subscribe today to unlock all pages.
Trusted by 1+ million students worldwide
1 out of 23
Related Documents


Your All-in-One AI-Powered Toolkit for Academic Success.
+13062052269
info@desklib.com
Available 24*7 on WhatsApp / Email
![[object Object]](/_next/static/media/star-bottom.7253800d.svg)
Unlock your academic potential
Copyright © 2020–2026 A2Z Services. All Rights Reserved. Developed and managed by ZUCOL.