Business Finance (BANK 2007) Report: Investment Analysis and WACC
VerifiedAdded on 2023/02/01
|8
|1965
|36
Report
AI Summary
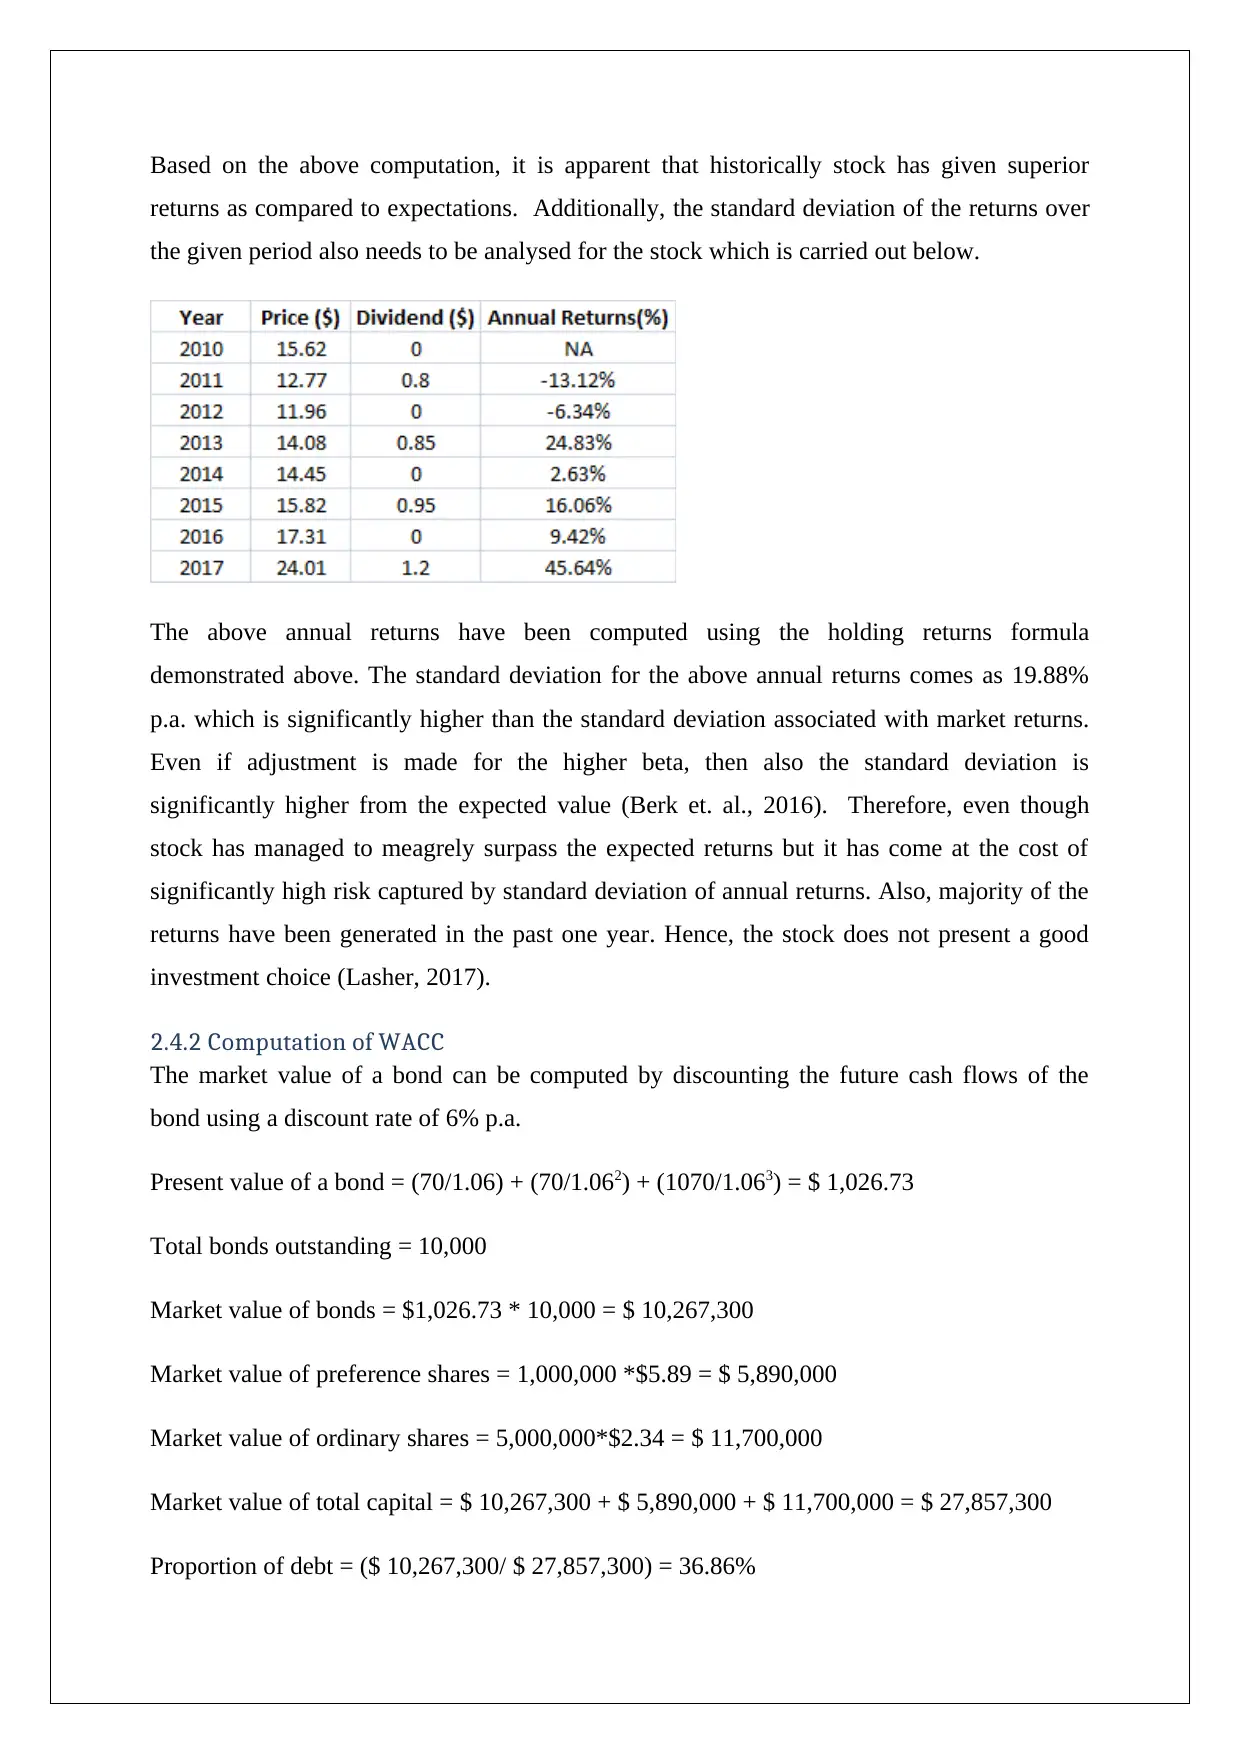
This report addresses financial queries raised by a client, offering advice on investment proposals using financial tools and techniques. It analyzes the Capital Asset Pricing Model (CAPM) to determine expected stock returns and discusses market efficiency concepts. The report also covers the assumptions of the dividend discount model and utilizes Net Present Value (NPV) as a capital budgeting tool, evaluating investment opportunities and computing the Weighted Average Cost of Capital (WACC). The analysis includes an evaluation of a chosen stock, concluding that it is not a good investment choice due to high risk, and compares two projects based on their equivalent annual annuity, recommending one for investment. The report's key findings and recommendations are presented in the conclusion, with references to supporting literature.

BUSINESS FINANCE
STUDENT ID:
[Pick the date]
STUDENT ID:
[Pick the date]
Paraphrase This Document
Need a fresh take? Get an instant paraphrase of this document with our AI Paraphraser

Table of Contents
1.0 Introduction.....................................................................................................................................3
2.0 Discussion/Workings.......................................................................................................................3
2.1 Capital Asset Pricing Model.........................................................................................................3
2.2 Concepts of Market Efficiency.....................................................................................................3
2.3 Assumption of General Dividend Valuation Model......................................................................4
2.4 NPV as a Capital Budgeting Tool..................................................................................................4
2.4.1 Evaluation of Investment......................................................................................................4
2.4.2 Computation of WACC..........................................................................................................5
2.4.3 Evaluation of Projects...........................................................................................................6
3.0 Conclusion.......................................................................................................................................7
4.0 References.......................................................................................................................................7

1.0 Introduction
The objective of this report is to provide responses to the various financial queries raised by
the client. Additionally advice needs to be given to the client with regards to various
investment proposals that the client is currently evaluating. The same is based on various
financial tools and techniques. A key limitation of the report is that the analysis of the various
investment decisions to be made by the client have been made on the available data. This
available data is historical data and also the models used in analysis are based on various
assumptions which are assumed to be true for the given analysis.
2.0 Discussion/Workings
The discussion with regards to financial questions of client is carried out below.
2.1 Capital Asset Pricing Model
Capital Asset Pricing Model is a model which is used to highlight the relationship between
risk and return. In the process, it can be used to determine the expected returns of a stock
based on the underlying risk which is measured through beta. The relevant mathematical
expression for this model is shown as follows (Berk et. al., 2016).
Expected returns = Risk free rate + Beta* Market Risk Premium
In order to compute the expected returns, it starts with the risk free rate and then provides a
premium for assumption of risk to the investor based on the beta of the stock. A higher beta
value would imply higher risk and higher expected returns (Damodaran, 2015).
2.2 Concepts of Market Efficiency
The concept of efficient capital markets implies that markets are efficient with regards to
representing all public and private information in the price of the underlying security. As a
result, the investors cannot beat the market on a consistent basis through the use of
fundamental or technical analysis. In an efficient market, there is no information asymmetry
and prices tend to adjust quickly to the new information that enters the market(Lasher, 2017).
From the perspective of financial managers, efficient markets are significant as in such
markets, the impact of various managerial decisions are accurately and spontaneously
reflected in the price. As a result, the prices do not tend to deviate from the fair prices for an
extended time (Ross et. al., 2015).
⊘ This is a preview!⊘
Do you want full access?
Subscribe today to unlock all pages.

Trusted by 1+ million students worldwide

2.3 Assumption of General Dividend Valuation Model
There are various assumptions required to simply the general dividend discount model in
order to use the same for valuing the company stock. One of these assumptions is that a
particular growth rate of dividends would continue over the long run which allows for
computational easy as evident form the Gordon dividend discount formula (Lasher, 2017).
Another assumption is that the company would continue to pay dividend every year with
certainty which in reality may not be true owing to earnings fluctuation. Also, it is estimated
that dividends would be paid on a given date only on a year on year basis which is a
necessary assumption to estimate the present value of the future dividends (Brealey, Myers
and Allen, 2014).
2.4 NPV as a Capital Budgeting Tool
One of the key capital budgeting techniques is NPV analysis. This tends to compute the net
total of the present value of all incremental future cash flows expected from the underlying
project over the useful life. A key role in the computation of NPV is played by the discount
rate which would be determined based on the funding mix used for a given project. In order
to compute the NPV, the first step is to compute the aftertax incremental cash flows
associated with the project over the project’s useful life (Damodaran, 2015). Further, these
cash flows are then discounted to obtain the present value of these cash flows. The sum of
these present values is referred as NPV. A positive value of NPV would imply that the
project if financially feasible. A project with a higher NPV value is preferred to one with a
lower NPV value (Petty et. al., 2016).
2.4.1 Evaluation of Investment
Based on the given information, the first step is to estimate the expected return on the chosen
company stock taking the CAPM approach into consideration.
Expected returns = 3 + 1.1*(8-3) = 8.5% p.a.
Based on the empirical data, the compounded returns during the seven year period from 2010
to 2017 may be computed as shown below.
Total dividend payment received per share = 0.80 + 0.85 + 0.95 + 1.20 = $ 3.8
Holding period return = [(24.01 + 3.8 – 15.62)/(15.62)]*100 = 78.04%
CAGR over 2010 -2017 = [(1+0.7804)1/7 -1]*100 = 8.59% p.a.
Paraphrase This Document
Need a fresh take? Get an instant paraphrase of this document with our AI Paraphraser

Based on the above computation, it is apparent that historically stock has given superior
returns as compared to expectations. Additionally, the standard deviation of the returns over
the given period also needs to be analysed for the stock which is carried out below.
The above annual returns have been computed using the holding returns formula
demonstrated above. The standard deviation for the above annual returns comes as 19.88%
p.a. which is significantly higher than the standard deviation associated with market returns.
Even if adjustment is made for the higher beta, then also the standard deviation is
significantly higher from the expected value (Berk et. al., 2016). Therefore, even though
stock has managed to meagrely surpass the expected returns but it has come at the cost of
significantly high risk captured by standard deviation of annual returns. Also, majority of the
returns have been generated in the past one year. Hence, the stock does not present a good
investment choice (Lasher, 2017).
2.4.2 Computation of WACC
The market value of a bond can be computed by discounting the future cash flows of the
bond using a discount rate of 6% p.a.
Present value of a bond = (70/1.06) + (70/1.062) + (1070/1.063) = $ 1,026.73
Total bonds outstanding = 10,000
Market value of bonds = $1,026.73 * 10,000 = $ 10,267,300
Market value of preference shares = 1,000,000 *$5.89 = $ 5,890,000
Market value of ordinary shares = 5,000,000*$2.34 = $ 11,700,000
Market value of total capital = $ 10,267,300 + $ 5,890,000 + $ 11,700,000 = $ 27,857,300
Proportion of debt = ($ 10,267,300/ $ 27,857,300) = 36.86%

Proportion of preference shares = ($ 5,890,000/$ 27,857,300) =21.14%
Proportion of shares = ($ 11,700,000/$ 27,857,300) = 42%
a) After-tax cost of debt = 6%*(1-0.3) = 4.2% p.a.
Cost of preference shares = (0.75/5.89)*100 = 12.73% p.a.
The cost of equity would be determined using the Gordon dividend discount model. Let the
cost of equity be denote)d by k%
Hence, 2.34 = (0.35*1.02)/(k-0.02)
Solving the above, we get k= 17.26% p.a.
b) After tax WACC for the company =0.3686*4.2% + 0.2114*12.73% + 0.42*17.26% =
11.49% p.a.
c) Considering that the cost of capital at 11.49% p.a. is greater than the expected returns of
10% p.a. for the company, hence the ROI would be negative and hence investment in the
given telecommunication stock would not be recommended (Brealey,Myers and Allen,
2014).
2.4.3 Evaluation of Projects
In order to compare the given projects, the NPV of the two projects need to be found.
PV of annual cash flows of $19,000,000 over a period of 9 years = 19,000,000*(1-1.18-9)
/0.18 = $ 81.76 million
NPV (Project 1) = $ 81.76 million - $ 74 million = $ 7.76 million
Equivalent annual annuity (Project 1) = (0.18*7.76)/(1-1.18-9) =$ 1.80 million
PV of annual cash flows of $12,000,000 over a period of 15 years = 12,000,000*(1-1.18-15)
/0.18 = $ 61.10 million
NPV (Project 2) = $ 61.10 million - $ 52 million = $ 9.1 million
Equivalent annual annuity (Project 2) = (0.18*9.1)/(1-1.18-15) =$ 1.79 million
It is imperative to note that since the life of the two projects is different, hence equivalent
annual annuity would provide correct comparison. Based on this parameter, it is apparent that
Project 1 is superior and must be chosen for investment (Damodaran, 2015),
⊘ This is a preview!⊘
Do you want full access?
Subscribe today to unlock all pages.

Trusted by 1+ million students worldwide

3.0 Conclusion
The financial questions of the investor related to CAPM, efficient markets, NPV and
assumptions of dividend discount model have been addressed. Also, the analysis does not
support investment in the company shortlisted by the client as the risk is too high for the
returns delivered. With regards to the investment in telecommunication company, the returns
are lower than the WACC owing to which investment is not prudent. Further, with regards to
the two projects, project 1 is superior and the client should invest in the company if it decides
to invest in this project.
Paraphrase This Document
Need a fresh take? Get an instant paraphrase of this document with our AI Paraphraser

4.0 References
Berk, J., DeMarzo, P., Harford, J., Ford, G., Mollica, V. and Finch, N. (2016) Fundamentals
of corporate finance. London: Pearson Higher Education AU, pp. 145
Brealey, R.A., Myers, S.C. and Allen, F. (2014) Principles of corporate finance. 2nd ed. New
York: McGraw-Hill, pp. 155-156
Damodaran, A. (2015) Applied corporate finance: A user’s manual. 3rd ed. New York:
Wiley, John & Sons, pp. 113-114
Lasher, W. R., (2017) Practical Financial Management. 5th ed. London: South- Western
College Publisher, pp. 165
Petty, J.W., Titman, S., Keown, A., Martin, J.D., Martin, P., Burrow, M., and Nguyen, H. (2016)
Financial Management, Principles and Applications. 6th ed. NSW: Pearson Education, French
Forest Australia, pp. 145-146
Ross,S.A., Tryaler,R., Bird, R.,Westerfield, R.W. and Jorden,B.D. (2015) Essentials of
Corporate Finance. 2nd ed. New York City: McGraw-Hill, pp. 122-123
1 out of 8
Related Documents

Your All-in-One AI-Powered Toolkit for Academic Success.
+13062052269
info@desklib.com
Available 24*7 on WhatsApp / Email
Unlock your academic potential
Copyright © 2020–2025 A2Z Services. All Rights Reserved. Developed and managed by ZUCOL.