Business Analytics Report: Financial Analysis of KB Ltd and Basu Plc
VerifiedAdded on 2023/06/05
|17
|4558
|339
Report
AI Summary
This report presents a comprehensive business analytics analysis, starting with an introduction to business analytics and its applications. It then delves into a detailed examination of KB Ltd's profit and loss, supported by a mathematical model to evaluate performance. The report further analyzes cost behavior, revenue, and the impact of changing costs and selling prices. The analysis extends to Basu Plc, calculating its breakeven point, margin of safety, and estimated sales volume based on targeted profit. It includes a breakeven chart and discusses the model's benefits and limitations. Finally, the report analyzes and interprets national statistical archives for GDP and employment, offering insights into the broader economic context. The report concludes with a summary of the findings and a list of references.

Business Analytic
Paraphrase This Document
Need a fresh take? Get an instant paraphrase of this document with our AI Paraphraser
Table of Contents
INTRODUCTION...........................................................................................................................3
Question 1........................................................................................................................................3
a) Presentation of mathematical model.......................................................................................3
b) The profit and loss of the KB Ltd...........................................................................................4
b) Presentation of a graph if changes in the costs and selling price............................................5
c) Evaluate the costing and revenue behaviour...........................................................................6
Question 3........................................................................................................................................7
a) Calculate breakeven point and margin of safety for Basu Plc................................................7
b) calculate of estimated sales volume if the targeted profit is given.........................................8
c) Break even chart for Basu PLC...............................................................................................9
d) Benefits and limitation of the breakeven model.....................................................................9
Question 4......................................................................................................................................10
Analysis and Interpretation of the National Statistical Archives for GDP and Employment...10
CONCLUSION..............................................................................................................................15
REFERENCES..............................................................................................................................16
INTRODUCTION
Business analytic mean to gain insight and drive business planning by the skills,
technologies and practices for continuous iterative exploration and investigation. The data driven
organisations use their data as a corporate asset. The business success depends on the quality of
data, business experts who understand the tools and the organisation. When company analysis of
the data, firstly they evaluate the business objective of the analysis, choose the analysis
technology, used of various system and sources to get the business data and by using data
warehouse to cleanse and integrated the data. There is various type to evaluate the business
analytics such as descriptive, prescriptive and predictive analytics. The business analytic is
totally different from business intelligence. The organisation is used business intelligence before
implementing of BA. It analysis the business making decision. The high quality of data depends
on the business analytics (Cariño and et.al, 2020). This report includes, the data of Kilburn farms
limited to analyse the profit and loss of KB Ltd and prepare the mathematical model to evaluate
the performance. Further this report includes the breakeven point and margin of safety of the
Basu Plc.
Question 1
a) Presentation of mathematical model
The mathematical concepts and language are used to describe the mathematical model.
The steps which are followed to develop model known as mathematical modelling. It is used in
various area such as natural science, it sectors and social science. To make prediction the model
can use different components to explain the system. It can use different forms, models, equations
and theoretic model of game. The mathematical model can be classified into the various types:
1. Linear and nonlinear- If all the data exhibit linearity, it is called as linear. This model is
also used nonlinear. The meaning of linear and non-linear is dependent on circumstance,
and linear techniques may have non-linear aspects in them.
2. Static and dynamic-When changes in the state of system, then used of static and when
organisation calculates the equilibrium system then uses of the static. The different
equation is represented through dynamic models (Foulkes, 2018).
3. Explicit and implicit- In explicit model, output all the parameters may be calculated by a
finite series of computation and all the input parameters are known as overall model. If
⊘ This is a preview!⊘
Do you want full access?
Subscribe today to unlock all pages.
Trusted by 1+ million students worldwide
inputs data need be solved to by an iterative procedure and known of the output
parameters, it is called as implicit (Giannakis and et.al, 2020).
In according to given question, if company plans properly of production, then it achieves
the competitive advantages by delivering low cost item with improving quality and short time
period. The main objective of the mathematical model that is exist of a loss new quality function
and the add the value of repairs cost to the ordering and holding cost of stock is included in the
classical model. This technique is used in the real global environment to demonstrate the initial
setting effect of the average attribute characteristic. The company produces the product of
200000 units and sell the product @3 per unit. The variable cost and fixed cost are incurred to
produce the product. The company should reduce its variable cost and fixed cost that they
achieve the highest profit.
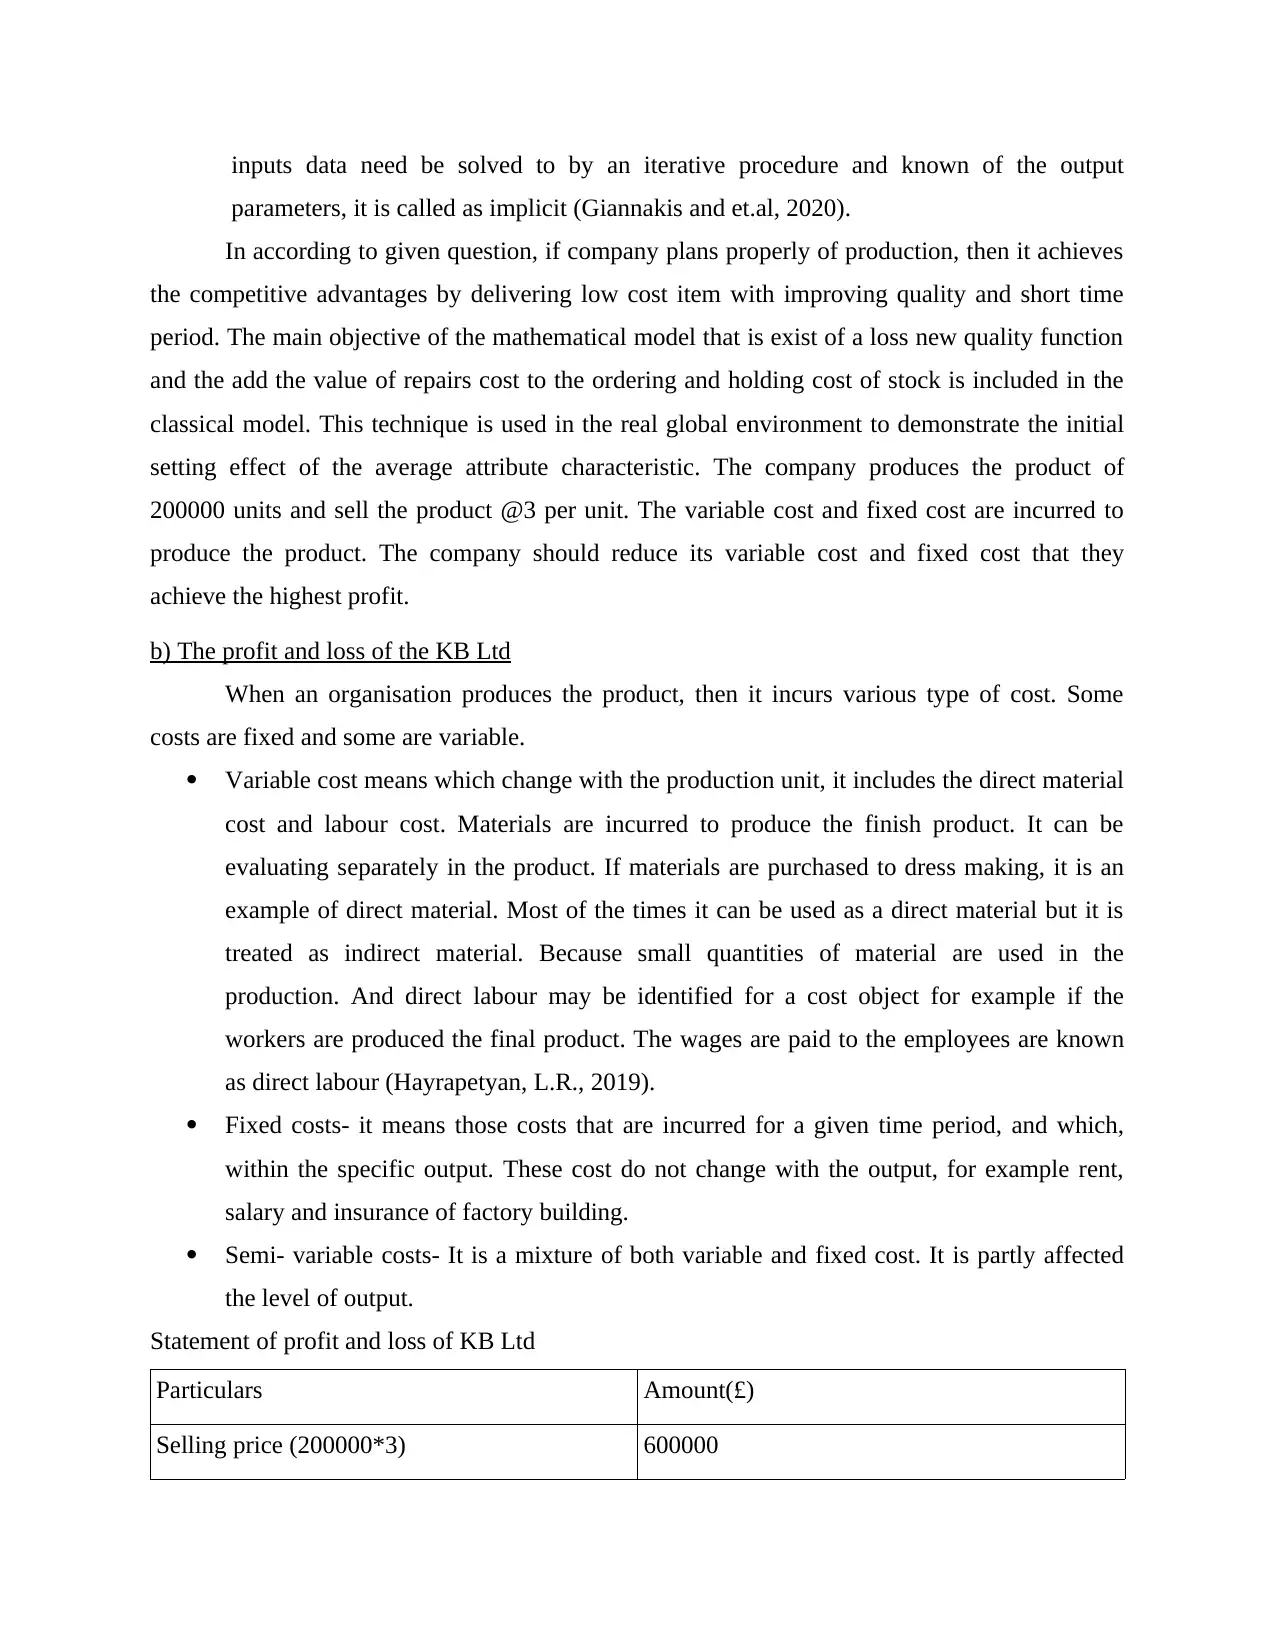
b) The profit and loss of the KB Ltd
When an organisation produces the product, then it incurs various type of cost. Some
costs are fixed and some are variable.
Variable cost means which change with the production unit, it includes the direct material
cost and labour cost. Materials are incurred to produce the finish product. It can be
evaluating separately in the product. If materials are purchased to dress making, it is an
example of direct material. Most of the times it can be used as a direct material but it is
treated as indirect material. Because small quantities of material are used in the
production. And direct labour may be identified for a cost object for example if the
workers are produced the final product. The wages are paid to the employees are known
as direct labour (Hayrapetyan, L.R., 2019).
Fixed costs- it means those costs that are incurred for a given time period, and which,
within the specific output. These cost do not change with the output, for example rent,
salary and insurance of factory building.
Semi- variable costs- It is a mixture of both variable and fixed cost. It is partly affected
the level of output.
Statement of profit and loss of KB Ltd
Particulars Amount(£)
Selling price (200000*3) 600000
parameters, it is called as implicit (Giannakis and et.al, 2020).
In according to given question, if company plans properly of production, then it achieves
the competitive advantages by delivering low cost item with improving quality and short time
period. The main objective of the mathematical model that is exist of a loss new quality function
and the add the value of repairs cost to the ordering and holding cost of stock is included in the
classical model. This technique is used in the real global environment to demonstrate the initial
setting effect of the average attribute characteristic. The company produces the product of
200000 units and sell the product @3 per unit. The variable cost and fixed cost are incurred to
produce the product. The company should reduce its variable cost and fixed cost that they
achieve the highest profit.
b) The profit and loss of the KB Ltd
When an organisation produces the product, then it incurs various type of cost. Some
costs are fixed and some are variable.
Variable cost means which change with the production unit, it includes the direct material
cost and labour cost. Materials are incurred to produce the finish product. It can be
evaluating separately in the product. If materials are purchased to dress making, it is an
example of direct material. Most of the times it can be used as a direct material but it is
treated as indirect material. Because small quantities of material are used in the
production. And direct labour may be identified for a cost object for example if the
workers are produced the final product. The wages are paid to the employees are known
as direct labour (Hayrapetyan, L.R., 2019).
Fixed costs- it means those costs that are incurred for a given time period, and which,
within the specific output. These cost do not change with the output, for example rent,
salary and insurance of factory building.
Semi- variable costs- It is a mixture of both variable and fixed cost. It is partly affected
the level of output.
Statement of profit and loss of KB Ltd
Particulars Amount(£)
Selling price (200000*3) 600000
Paraphrase This Document
Need a fresh take? Get an instant paraphrase of this document with our AI Paraphraser
Less- variable cost@0.9 (20000*0.9) (180000)
Contribution 420000
Less: fixed cost -100000
Profit 320000
If company sells 2000000@3 per unit, then company earns the profit of £320000. It means
company have sufficient profit to run the business till long term. If company earns more profit
then company should adopt the various techniques (Heindl and Liefner, 2019).
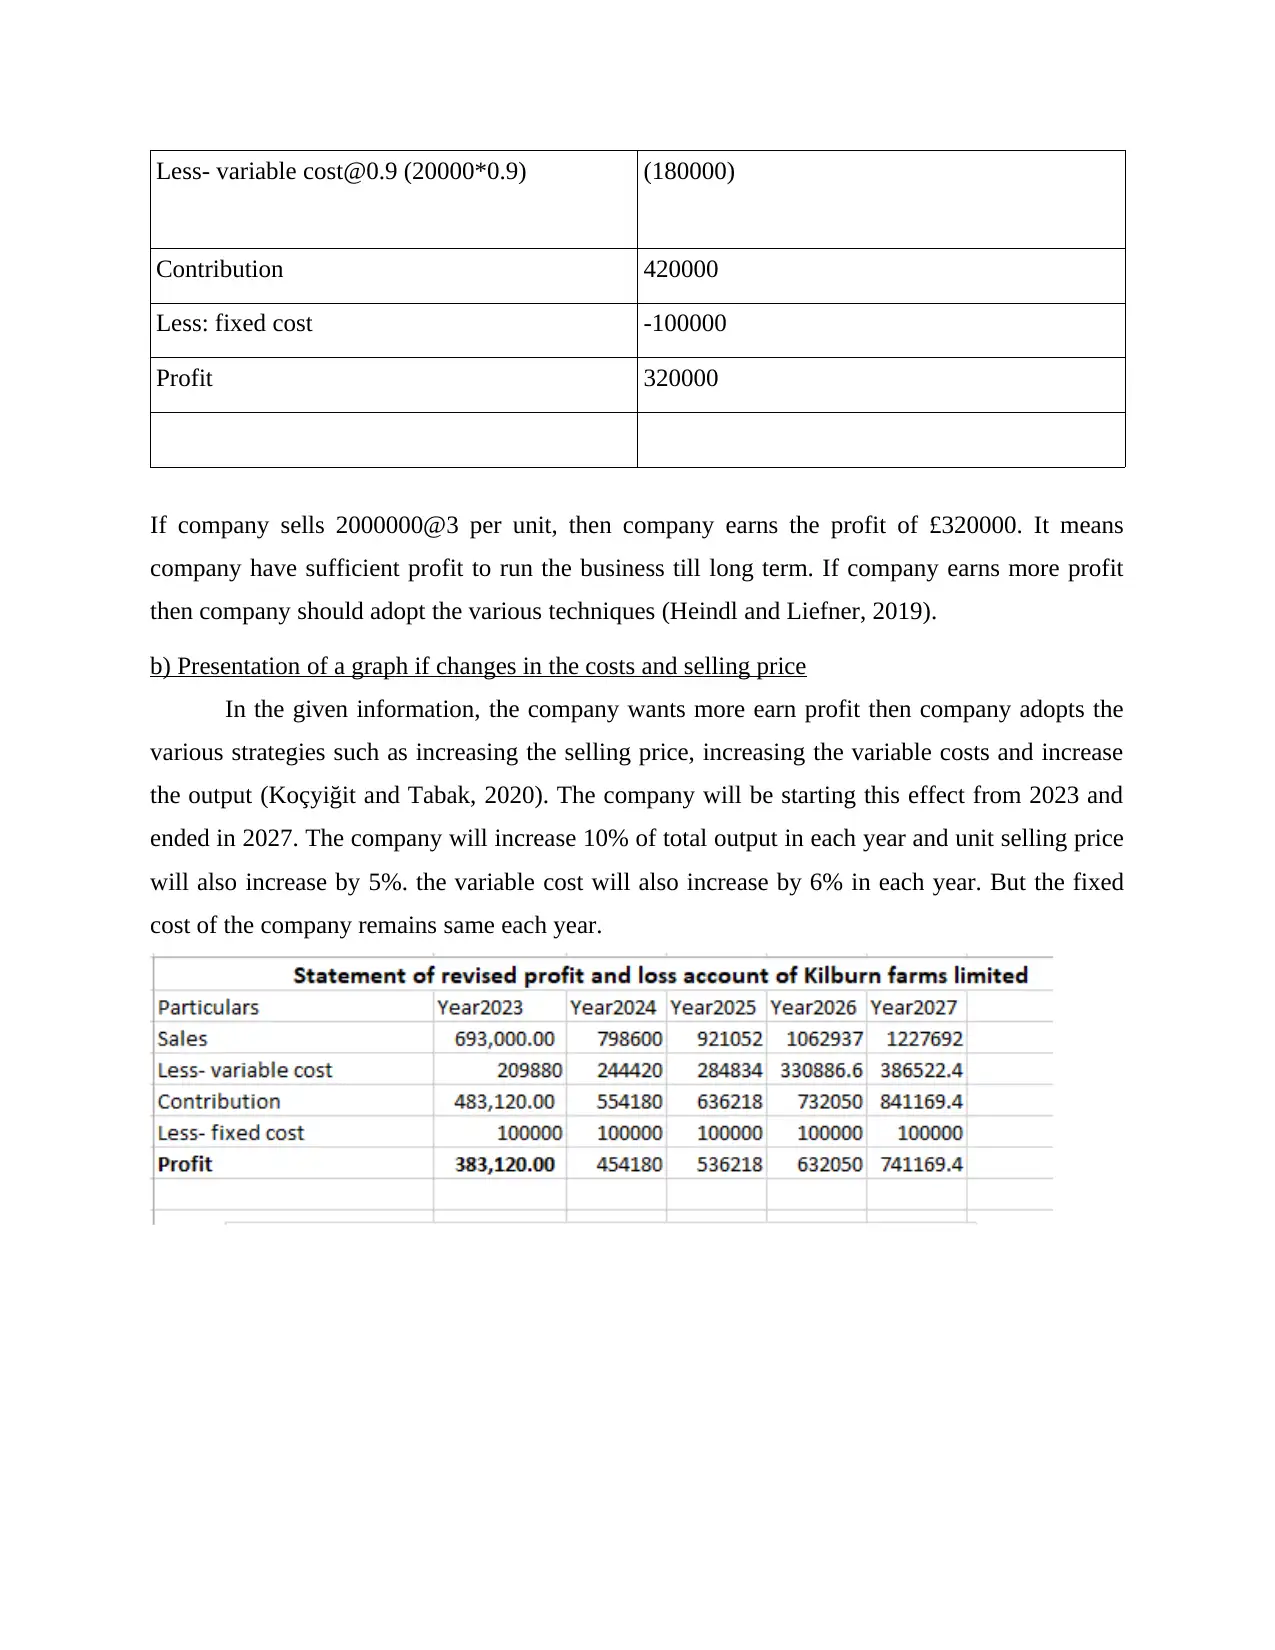
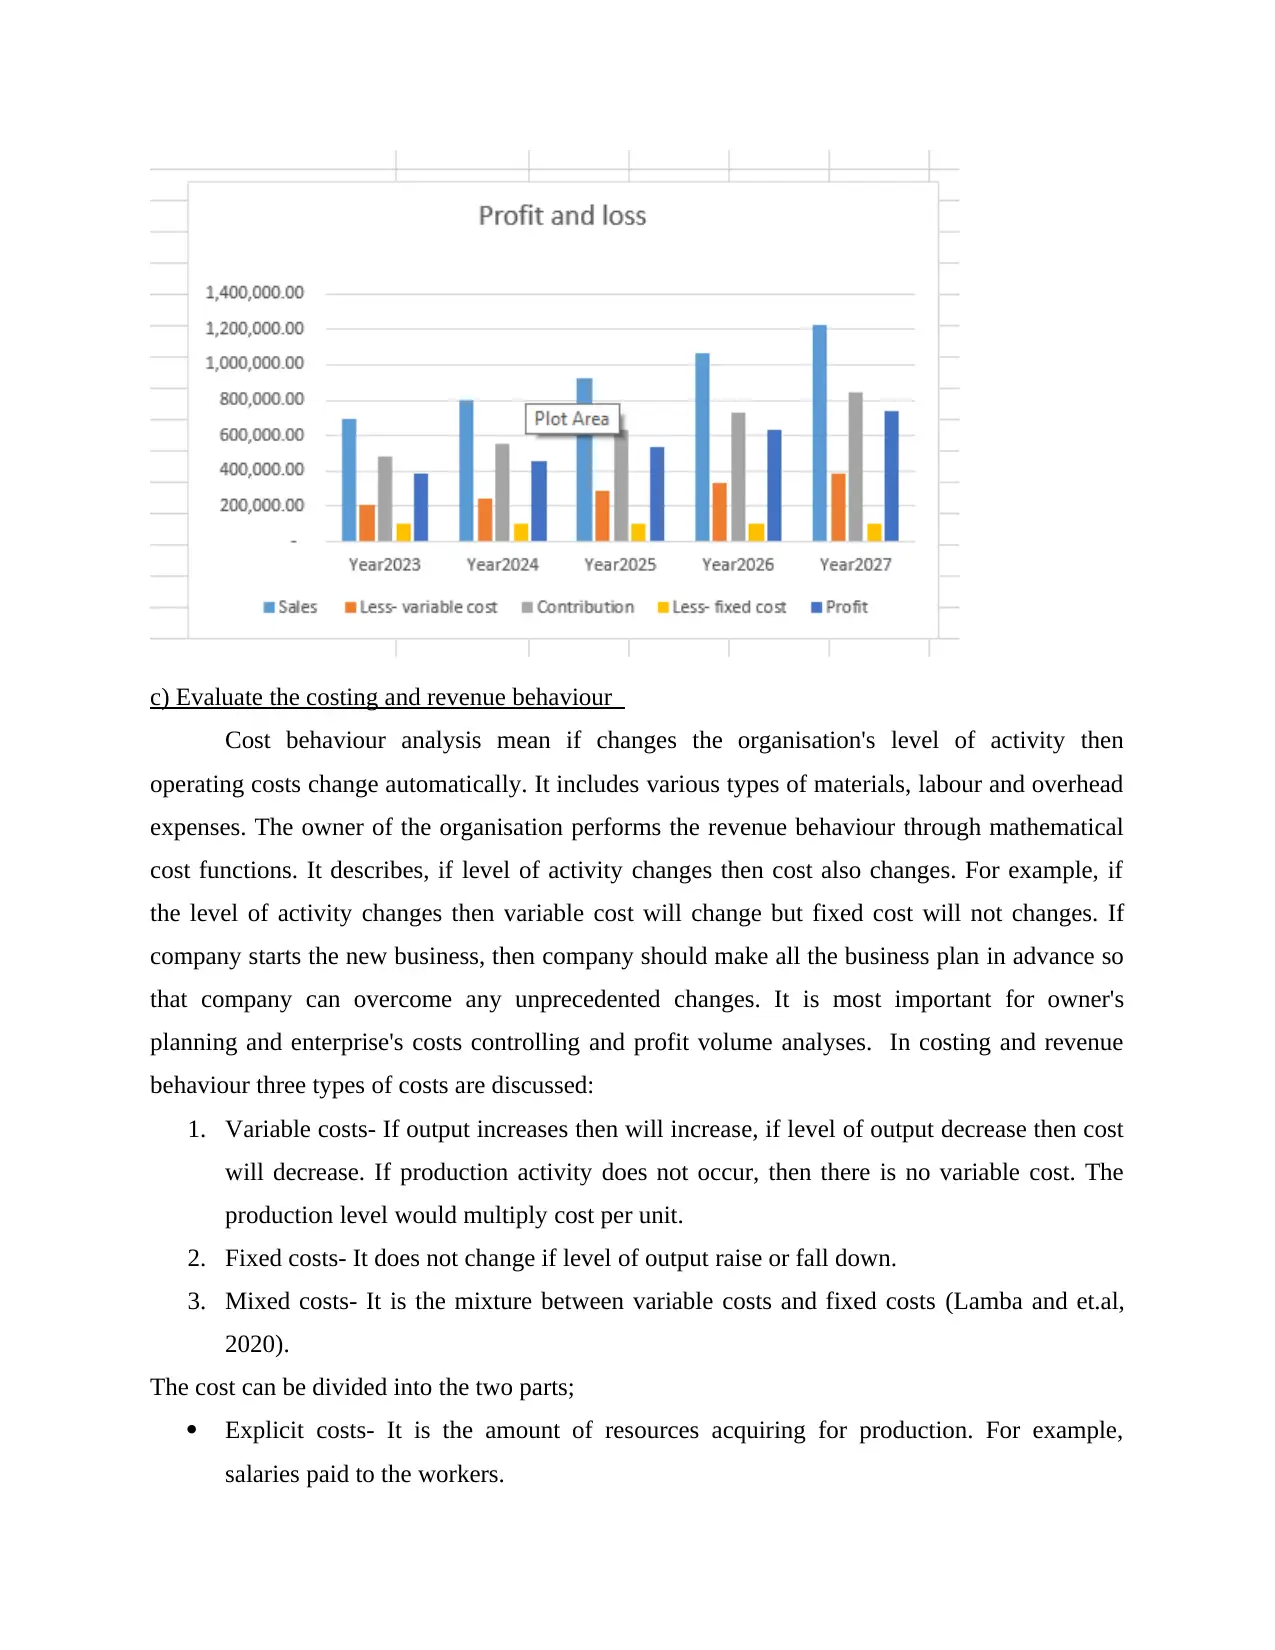
b) Presentation of a graph if changes in the costs and selling price
In the given information, the company wants more earn profit then company adopts the
various strategies such as increasing the selling price, increasing the variable costs and increase
the output (Koçyiğit and Tabak, 2020). The company will be starting this effect from 2023 and
ended in 2027. The company will increase 10% of total output in each year and unit selling price
will also increase by 5%. the variable cost will also increase by 6% in each year. But the fixed
cost of the company remains same each year.
Contribution 420000
Less: fixed cost -100000
Profit 320000
If company sells 2000000@3 per unit, then company earns the profit of £320000. It means
company have sufficient profit to run the business till long term. If company earns more profit
then company should adopt the various techniques (Heindl and Liefner, 2019).
b) Presentation of a graph if changes in the costs and selling price
In the given information, the company wants more earn profit then company adopts the
various strategies such as increasing the selling price, increasing the variable costs and increase
the output (Koçyiğit and Tabak, 2020). The company will be starting this effect from 2023 and
ended in 2027. The company will increase 10% of total output in each year and unit selling price
will also increase by 5%. the variable cost will also increase by 6% in each year. But the fixed
cost of the company remains same each year.
c) Evaluate the costing and revenue behaviour
Cost behaviour analysis mean if changes the organisation's level of activity then
operating costs change automatically. It includes various types of materials, labour and overhead
expenses. The owner of the organisation performs the revenue behaviour through mathematical
cost functions. It describes, if level of activity changes then cost also changes. For example, if
the level of activity changes then variable cost will change but fixed cost will not changes. If
company starts the new business, then company should make all the business plan in advance so
that company can overcome any unprecedented changes. It is most important for owner's
planning and enterprise's costs controlling and profit volume analyses. In costing and revenue
behaviour three types of costs are discussed:
1. Variable costs- If output increases then will increase, if level of output decrease then cost
will decrease. If production activity does not occur, then there is no variable cost. The
production level would multiply cost per unit.
2. Fixed costs- It does not change if level of output raise or fall down.
3. Mixed costs- It is the mixture between variable costs and fixed costs (Lamba and et.al,
2020).
The cost can be divided into the two parts;
Explicit costs- It is the amount of resources acquiring for production. For example,
salaries paid to the workers.
⊘ This is a preview!⊘
Do you want full access?
Subscribe today to unlock all pages.
Trusted by 1+ million students worldwide
Implicit costs- it is the amount of input services which are utilised in the production but it
is not acquiring in the market.
On the basis of accounting cost can be classified into the accounting cost and economic cost.
Accounting cost means the real expenses add depreciation costs to capital assets and economic
cost refers the firm cost includes the economic resources used in production, including the
opportunities cost. Sunk cost means the expenses has been incurred in the production it they
cannot be recovered. It does not affect the company decisions. Social cost means the direct and
indirect costs incurred by society to the production of a product. Cost of production can be short
term and long term. Average total cost is equal to the total costs divided by the actual output.
In the given question the profit of the company is changed, if level of output changed.
But company incurs only the variable cost and fixed cost in the production (Mahmoud, S., 2020).
There is no any sunk cost incurred in the production.
Question 3
a) Calculate breakeven point and margin of safety for Basu Plc
Breakeven point- The fixed costs are divided by the contribution per unit in according to
corporate accounting. Contribution per unit means the variable costs subtracted from the selling
price. Fixed costs means the cost which are not changed but it is the production level at which
total earning is equal to the total costs. It is applied for a broad type of contexts.
The following calculation shows the breakeven point of Basu Plc:
Particulars Amount in (£ )
Sales price 600
- Variable costs-
Materials 40
Labour 200
Selling 10 250
Contribution per unit 350
Fixed costs ( administration and selling and
distribution)60000+80000
140000
Paraphrase This Document
Need a fresh take? Get an instant paraphrase of this document with our AI Paraphraser
Breakeven point = Fixed cost / contribution per unit
=140000/350
= 400 unit
The company should sell 400 units, because company will not bear any profit and loss.
Margin of safety- it means breakeven point is subtracted from the actual sales (Nobanee and Al-
Suwaidi, 2021).
Breakeven point sales – 400 unit
Actual sales -640 units
MOS = Actual sales – Break even sales
= 640-400
= 240 units
The margin of safety is 240 units
MOS (%) = Margin of safety in units* 100 / actual sales unit
= 240*100 / 640
=37.50%
b) calculate of estimated sales volume if the targeted profit is given
The targeted profit of the £56000 and the actual profit of the company £84000. It means
company earns more profit in actual as compare to target profit and they should not change the
selling price and selling unit. Because company earns 28000 more profit (Papić, Zovak and
Mršić, 2021).
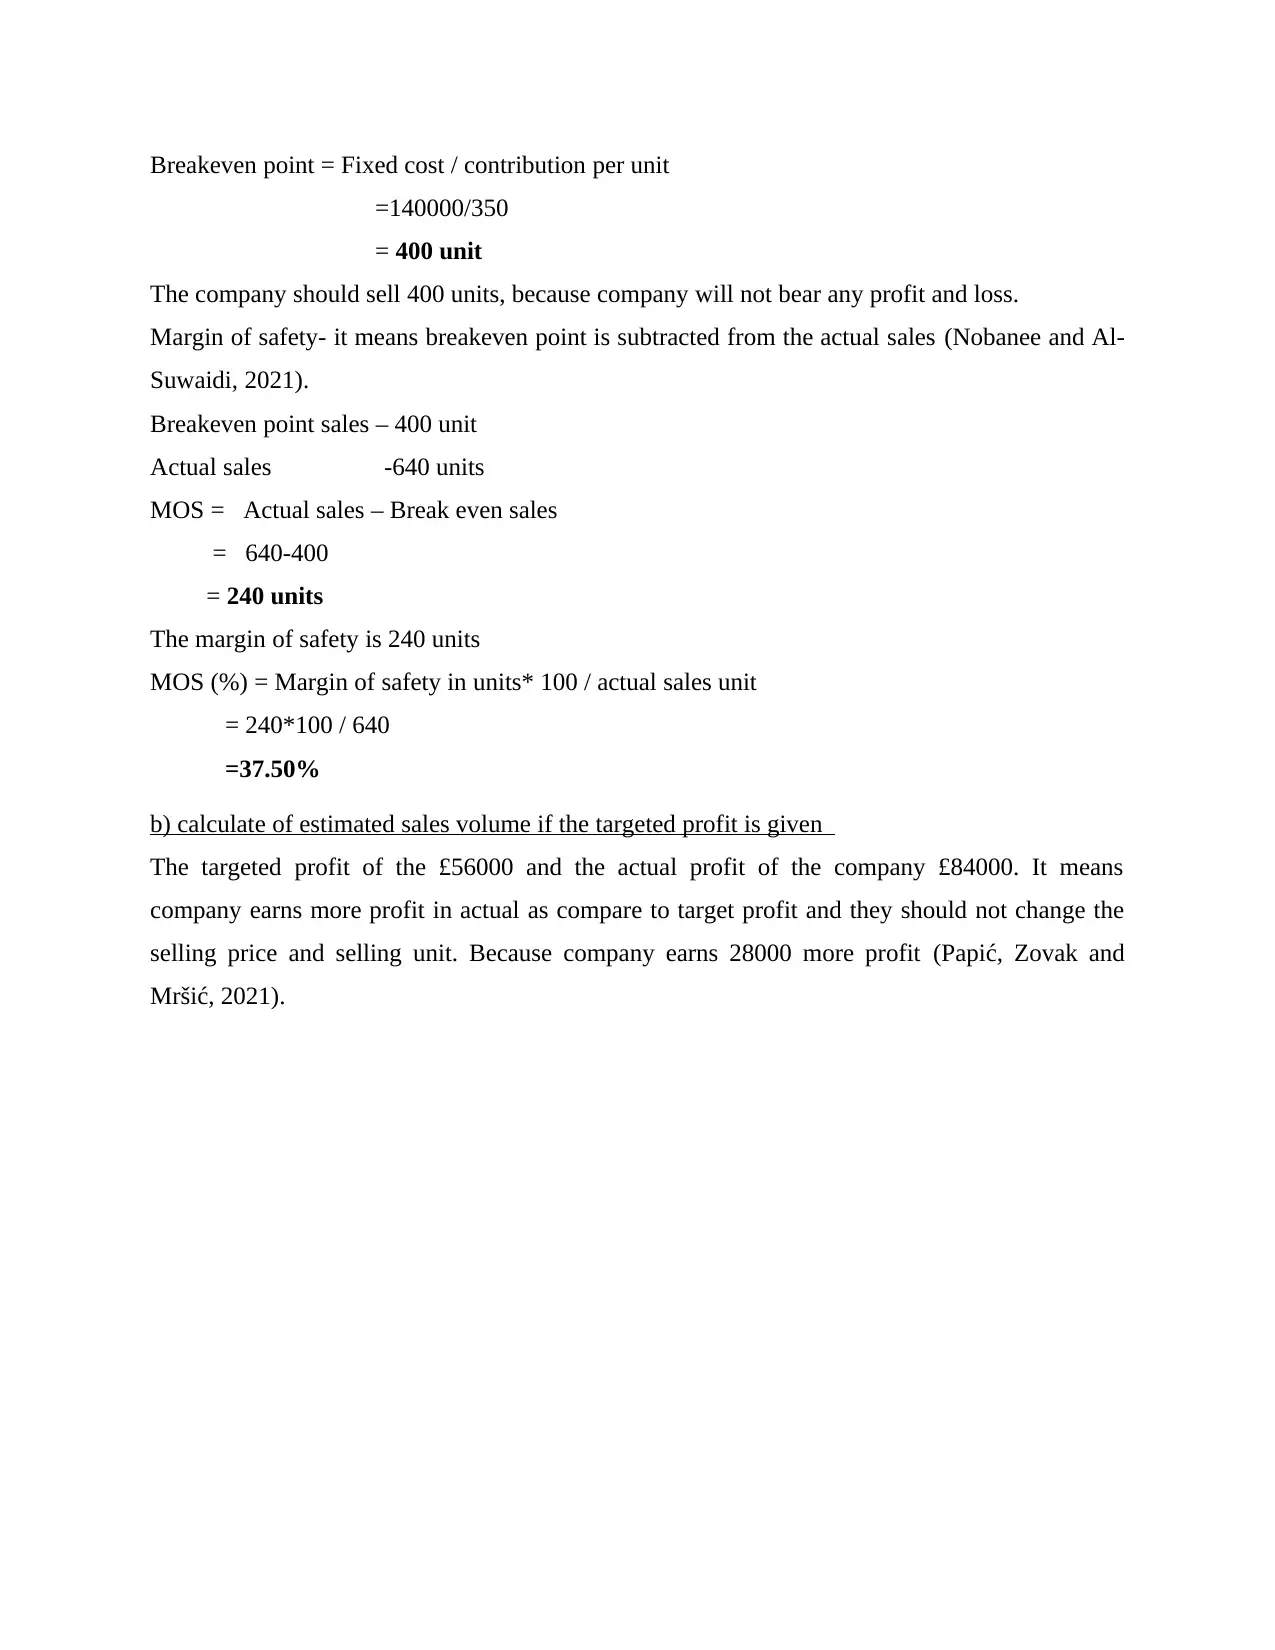
c) Break even chart for Basu PLC
As the above chart shows the break even units is 400 units and company sales 640 units it means
240 units show the margin of safety.
d) Benefits and limitation of the breakeven model
There are many benefits of breakeven model but some of the common benefits are as
follow:
1. Pricing- It evaluates how many units should be sell for earn profit. It determines how
much money the organisation will make at every point of output.
2. Gaining funds- it is very important part of a company's strategy if they come to collecting
the financing break even analysis (Pasayat and et.al, 2020).
3. Reduce risk- It may help to decrease risk by proving information of investments which
are unlikely to be successful.
Limitations-
It is assumed that all the costs can be divided into the fixed and variable costs. But in
reality it is very difficult to identify the difference between the variable costs and fixed
costs.
⊘ This is a preview!⊘
Do you want full access?
Subscribe today to unlock all pages.
Trusted by 1+ million students worldwide
The breakeven model is assumed, if selling unit price does not change then revenue line
represents straight, that can or cannot be accurate. The unit price is depended on the
various factors such as competition and market supply and demand.
Question 4
Analysis and Interpretation of the National Statistical Archives for GDP and Employment
The Gross Domestic Product is referred to as the standardized measure of the value or the
size of an economy, which is compiled for a country to comprehend its position in the
economy. The Gross Domestic Product could be assessed for a country, several countries
combined or a region. Furthermore, the monetary measure of the country’s final goods and
services which are produced in a specific time period are referred to as the GDP and this
metric often undergoes various changes and revisions so as to be in line with the current
market conditions and the masses. The employment of the nation is also an important
factor for the country to assess and is generally defined as the formal agreement which is
made in between an individual and another entity, from which the individual is referred to
as the employee of the entity and the entity is referred to as the employer. The following
aspects, namely the employment and the GDP of United Kingdom will be discussed
through various metrics which will help the nation understand how it may impact the
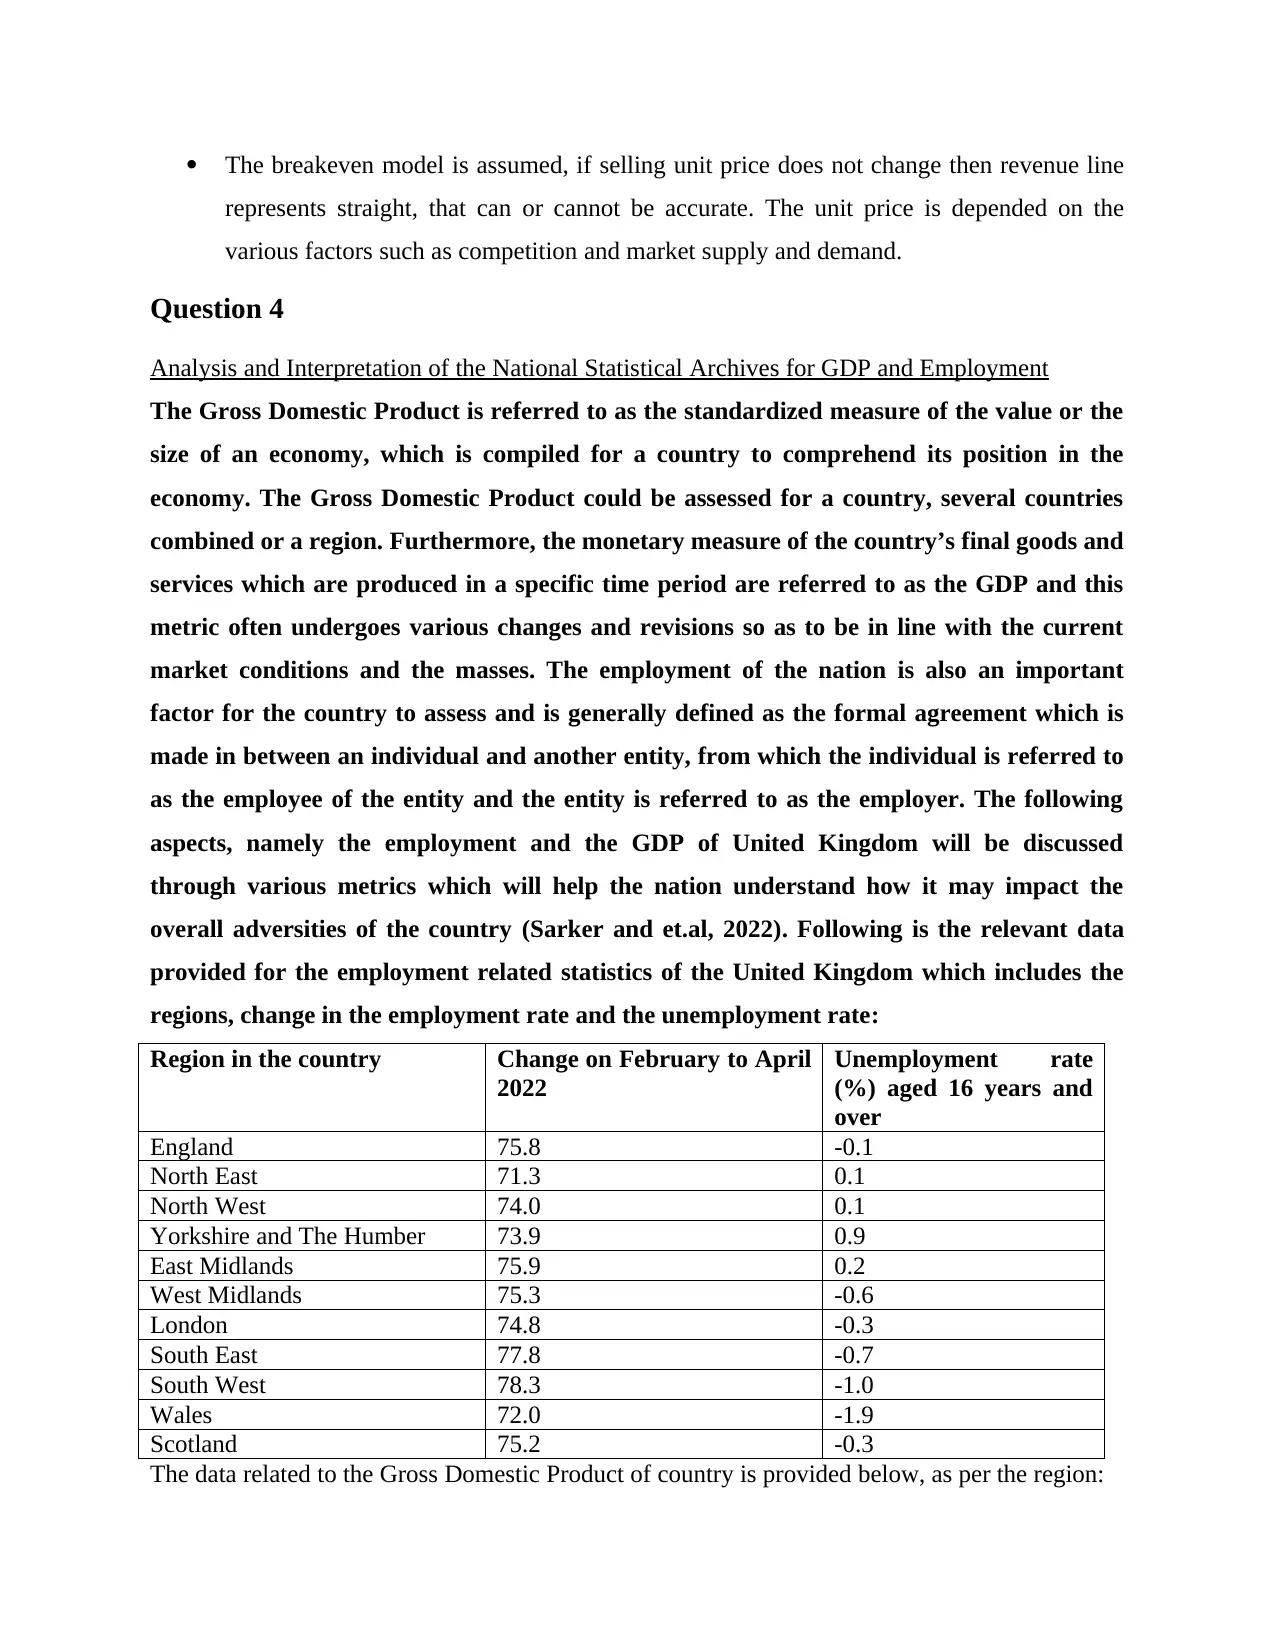
overall adversities of the country (Sarker and et.al, 2022). Following is the relevant data
provided for the employment related statistics of the United Kingdom which includes the
regions, change in the employment rate and the unemployment rate:
Region in the country Change on February to April
2022
Unemployment rate
(%) aged 16 years and
over
England 75.8 -0.1
North East 71.3 0.1
North West 74.0 0.1
Yorkshire and The Humber 73.9 0.9
East Midlands 75.9 0.2
West Midlands 75.3 -0.6
London 74.8 -0.3
South East 77.8 -0.7
South West 78.3 -1.0
Wales 72.0 -1.9
Scotland 75.2 -0.3
The data related to the Gross Domestic Product of country is provided below, as per the region:
represents straight, that can or cannot be accurate. The unit price is depended on the
various factors such as competition and market supply and demand.
Question 4
Analysis and Interpretation of the National Statistical Archives for GDP and Employment
The Gross Domestic Product is referred to as the standardized measure of the value or the
size of an economy, which is compiled for a country to comprehend its position in the
economy. The Gross Domestic Product could be assessed for a country, several countries
combined or a region. Furthermore, the monetary measure of the country’s final goods and
services which are produced in a specific time period are referred to as the GDP and this
metric often undergoes various changes and revisions so as to be in line with the current
market conditions and the masses. The employment of the nation is also an important
factor for the country to assess and is generally defined as the formal agreement which is
made in between an individual and another entity, from which the individual is referred to
as the employee of the entity and the entity is referred to as the employer. The following
aspects, namely the employment and the GDP of United Kingdom will be discussed
through various metrics which will help the nation understand how it may impact the
overall adversities of the country (Sarker and et.al, 2022). Following is the relevant data
provided for the employment related statistics of the United Kingdom which includes the
regions, change in the employment rate and the unemployment rate:
Region in the country Change on February to April
2022
Unemployment rate
(%) aged 16 years and
over
England 75.8 -0.1
North East 71.3 0.1
North West 74.0 0.1
Yorkshire and The Humber 73.9 0.9
East Midlands 75.9 0.2
West Midlands 75.3 -0.6
London 74.8 -0.3
South East 77.8 -0.7
South West 78.3 -1.0
Wales 72.0 -1.9
Scotland 75.2 -0.3
The data related to the Gross Domestic Product of country is provided below, as per the region:
Paraphrase This Document
Need a fresh take? Get an instant paraphrase of this document with our AI Paraphraser
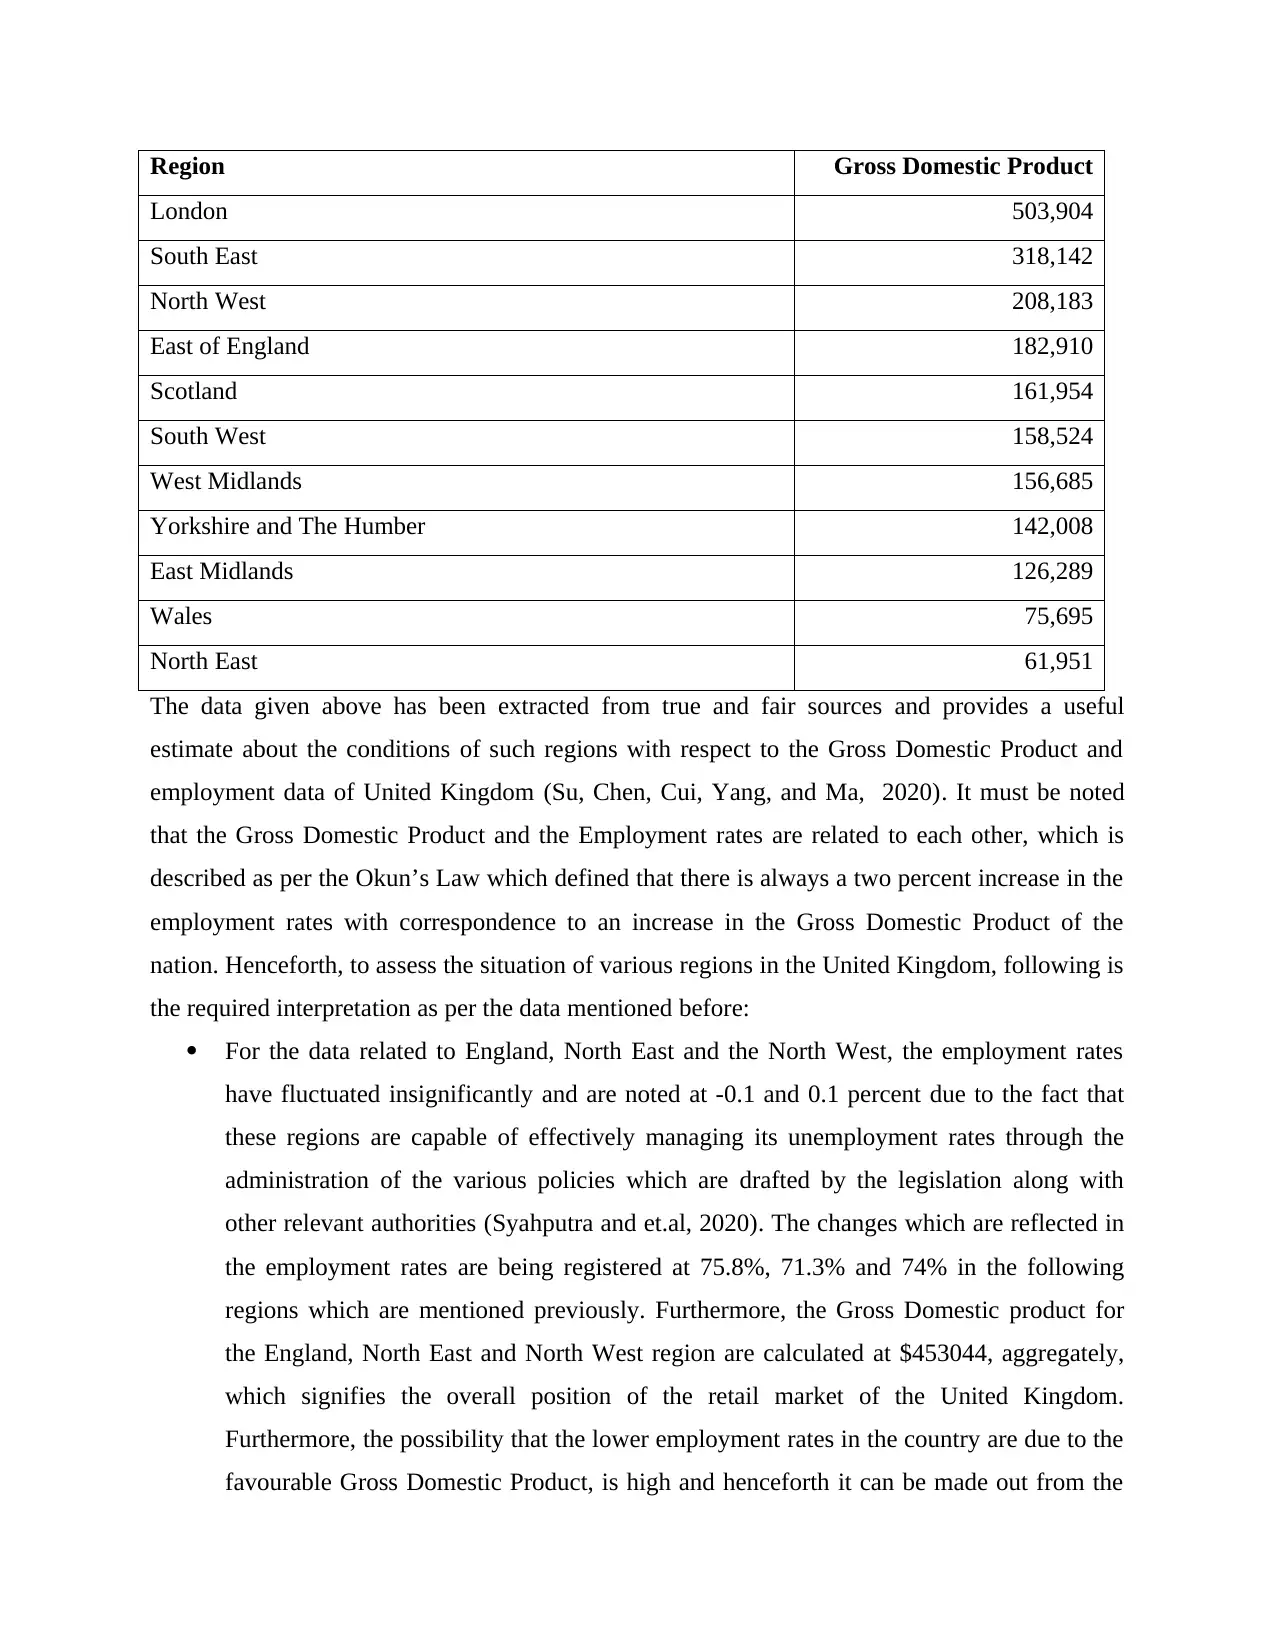
Region Gross Domestic Product
London 503,904
South East 318,142
North West 208,183
East of England 182,910
Scotland 161,954
South West 158,524
West Midlands 156,685
Yorkshire and The Humber 142,008
East Midlands 126,289
Wales 75,695
North East 61,951
The data given above has been extracted from true and fair sources and provides a useful
estimate about the conditions of such regions with respect to the Gross Domestic Product and
employment data of United Kingdom (Su, Chen, Cui, Yang, and Ma, 2020). It must be noted
that the Gross Domestic Product and the Employment rates are related to each other, which is
described as per the Okun’s Law which defined that there is always a two percent increase in the
employment rates with correspondence to an increase in the Gross Domestic Product of the
nation. Henceforth, to assess the situation of various regions in the United Kingdom, following is
the required interpretation as per the data mentioned before:
For the data related to England, North East and the North West, the employment rates
have fluctuated insignificantly and are noted at -0.1 and 0.1 percent due to the fact that
these regions are capable of effectively managing its unemployment rates through the
administration of the various policies which are drafted by the legislation along with
other relevant authorities (Syahputra and et.al, 2020). The changes which are reflected in
the employment rates are being registered at 75.8%, 71.3% and 74% in the following
regions which are mentioned previously. Furthermore, the Gross Domestic product for
the England, North East and North West region are calculated at $453044, aggregately,
which signifies the overall position of the retail market of the United Kingdom.
Furthermore, the possibility that the lower employment rates in the country are due to the
favourable Gross Domestic Product, is high and henceforth it can be made out from the
following data that these three regions are capable of adequately utilizing the available
resources in the market, along with the provision of proper educational requirements to
the citizens, so that they will be able to create technical and professional efficiency.
However, it must be noted that the negative employment rate also signifies that only a
few percentage of the population is looking for job opportunities and is not interested in
the job prospects which are available in the country. This also states that the country must
draft and implement various policies which will help such unenthusiastic individuals to
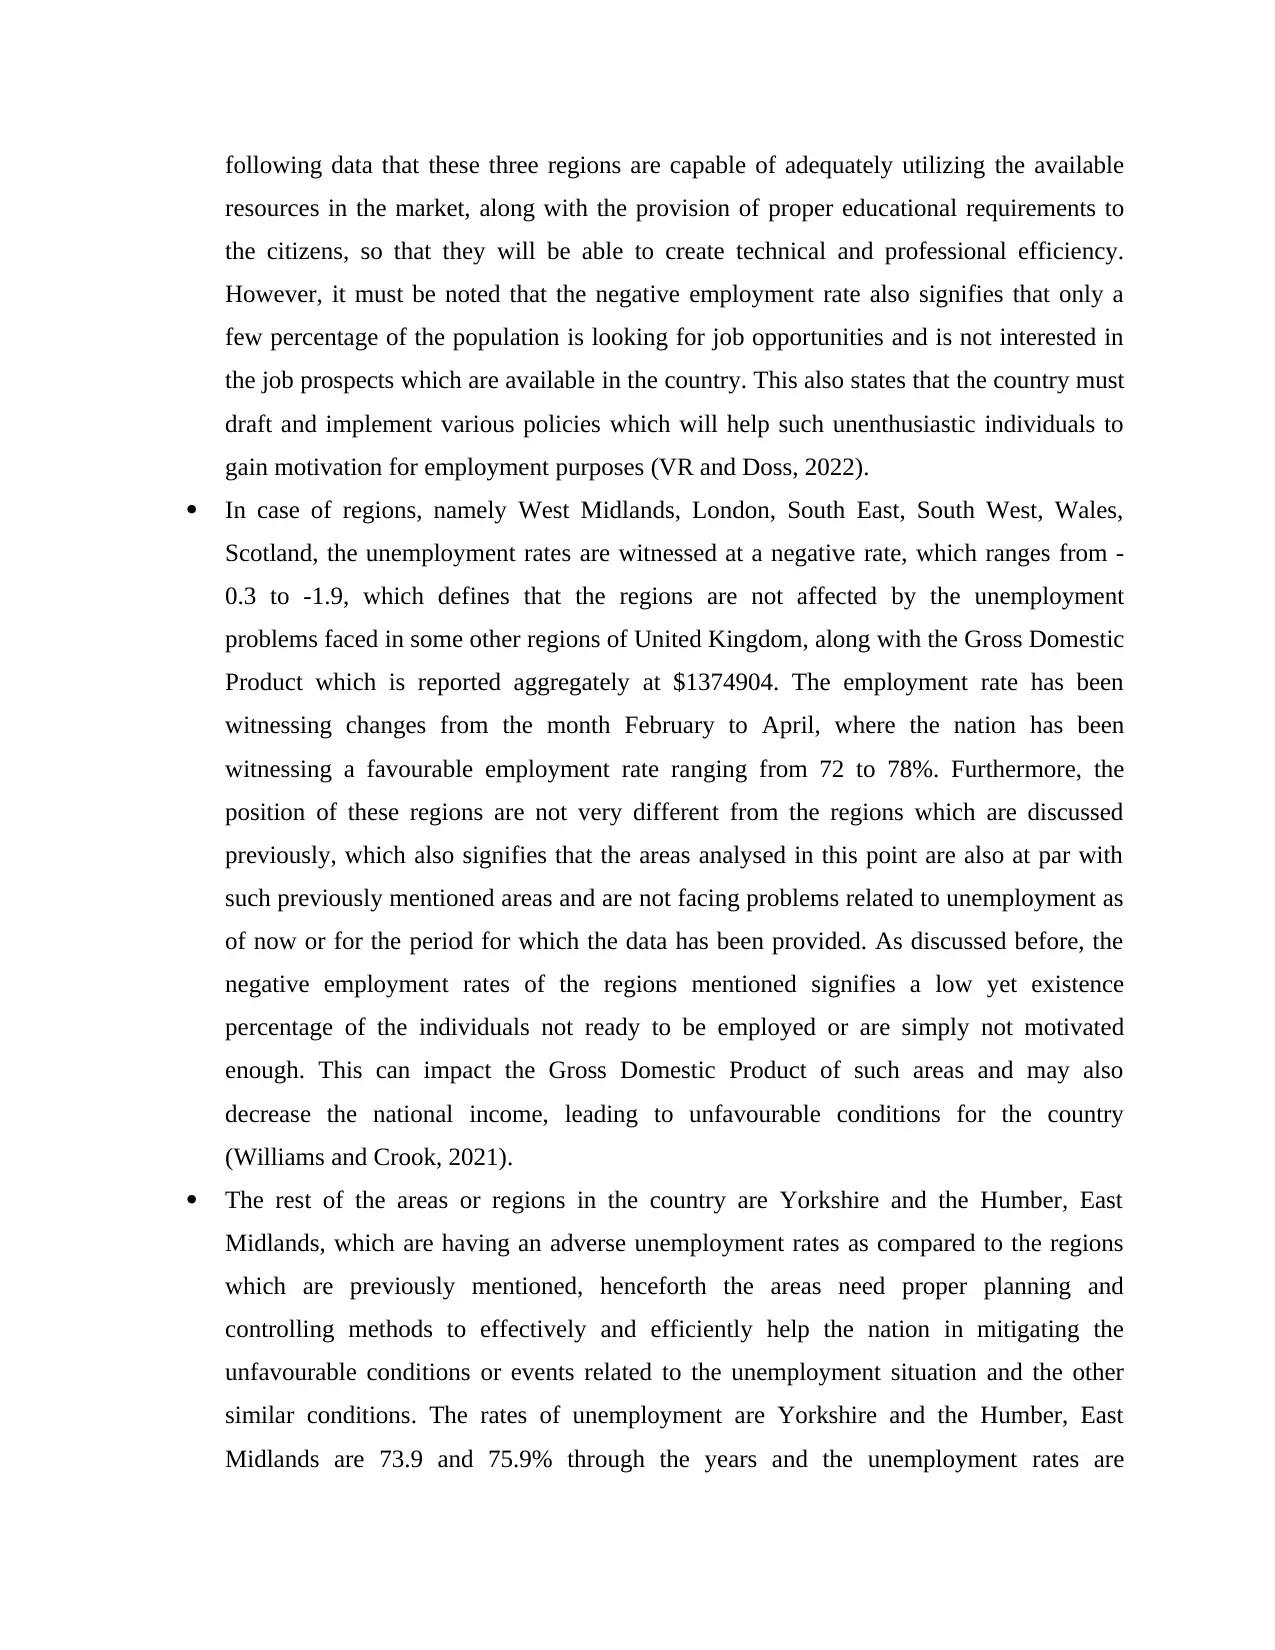
gain motivation for employment purposes (VR and Doss, 2022).
In case of regions, namely West Midlands, London, South East, South West, Wales,
Scotland, the unemployment rates are witnessed at a negative rate, which ranges from -
0.3 to -1.9, which defines that the regions are not affected by the unemployment
problems faced in some other regions of United Kingdom, along with the Gross Domestic
Product which is reported aggregately at $1374904. The employment rate has been
witnessing changes from the month February to April, where the nation has been
witnessing a favourable employment rate ranging from 72 to 78%. Furthermore, the
position of these regions are not very different from the regions which are discussed
previously, which also signifies that the areas analysed in this point are also at par with
such previously mentioned areas and are not facing problems related to unemployment as
of now or for the period for which the data has been provided. As discussed before, the
negative employment rates of the regions mentioned signifies a low yet existence
percentage of the individuals not ready to be employed or are simply not motivated
enough. This can impact the Gross Domestic Product of such areas and may also
decrease the national income, leading to unfavourable conditions for the country
(Williams and Crook, 2021).
The rest of the areas or regions in the country are Yorkshire and the Humber, East
Midlands, which are having an adverse unemployment rates as compared to the regions
which are previously mentioned, henceforth the areas need proper planning and
controlling methods to effectively and efficiently help the nation in mitigating the
unfavourable conditions or events related to the unemployment situation and the other
similar conditions. The rates of unemployment are Yorkshire and the Humber, East
Midlands are 73.9 and 75.9% through the years and the unemployment rates are
resources in the market, along with the provision of proper educational requirements to
the citizens, so that they will be able to create technical and professional efficiency.
However, it must be noted that the negative employment rate also signifies that only a
few percentage of the population is looking for job opportunities and is not interested in
the job prospects which are available in the country. This also states that the country must
draft and implement various policies which will help such unenthusiastic individuals to
gain motivation for employment purposes (VR and Doss, 2022).
In case of regions, namely West Midlands, London, South East, South West, Wales,
Scotland, the unemployment rates are witnessed at a negative rate, which ranges from -
0.3 to -1.9, which defines that the regions are not affected by the unemployment
problems faced in some other regions of United Kingdom, along with the Gross Domestic
Product which is reported aggregately at $1374904. The employment rate has been
witnessing changes from the month February to April, where the nation has been
witnessing a favourable employment rate ranging from 72 to 78%. Furthermore, the
position of these regions are not very different from the regions which are discussed
previously, which also signifies that the areas analysed in this point are also at par with
such previously mentioned areas and are not facing problems related to unemployment as
of now or for the period for which the data has been provided. As discussed before, the
negative employment rates of the regions mentioned signifies a low yet existence
percentage of the individuals not ready to be employed or are simply not motivated
enough. This can impact the Gross Domestic Product of such areas and may also
decrease the national income, leading to unfavourable conditions for the country
(Williams and Crook, 2021).
The rest of the areas or regions in the country are Yorkshire and the Humber, East
Midlands, which are having an adverse unemployment rates as compared to the regions
which are previously mentioned, henceforth the areas need proper planning and
controlling methods to effectively and efficiently help the nation in mitigating the
unfavourable conditions or events related to the unemployment situation and the other
similar conditions. The rates of unemployment are Yorkshire and the Humber, East
Midlands are 73.9 and 75.9% through the years and the unemployment rates are
⊘ This is a preview!⊘
Do you want full access?
Subscribe today to unlock all pages.
Trusted by 1+ million students worldwide
1 out of 17
Related Documents


Your All-in-One AI-Powered Toolkit for Academic Success.
+13062052269
info@desklib.com
Available 24*7 on WhatsApp / Email
![[object Object]](/_next/static/media/star-bottom.7253800d.svg)
Unlock your academic potential
Copyright © 2020–2026 A2Z Services. All Rights Reserved. Developed and managed by ZUCOL.