Business Decision Making: Data Analysis, Planning, and Decision-Making
VerifiedAdded on 2020/10/22
|35
|4666
|120
Homework Assignment
AI Summary
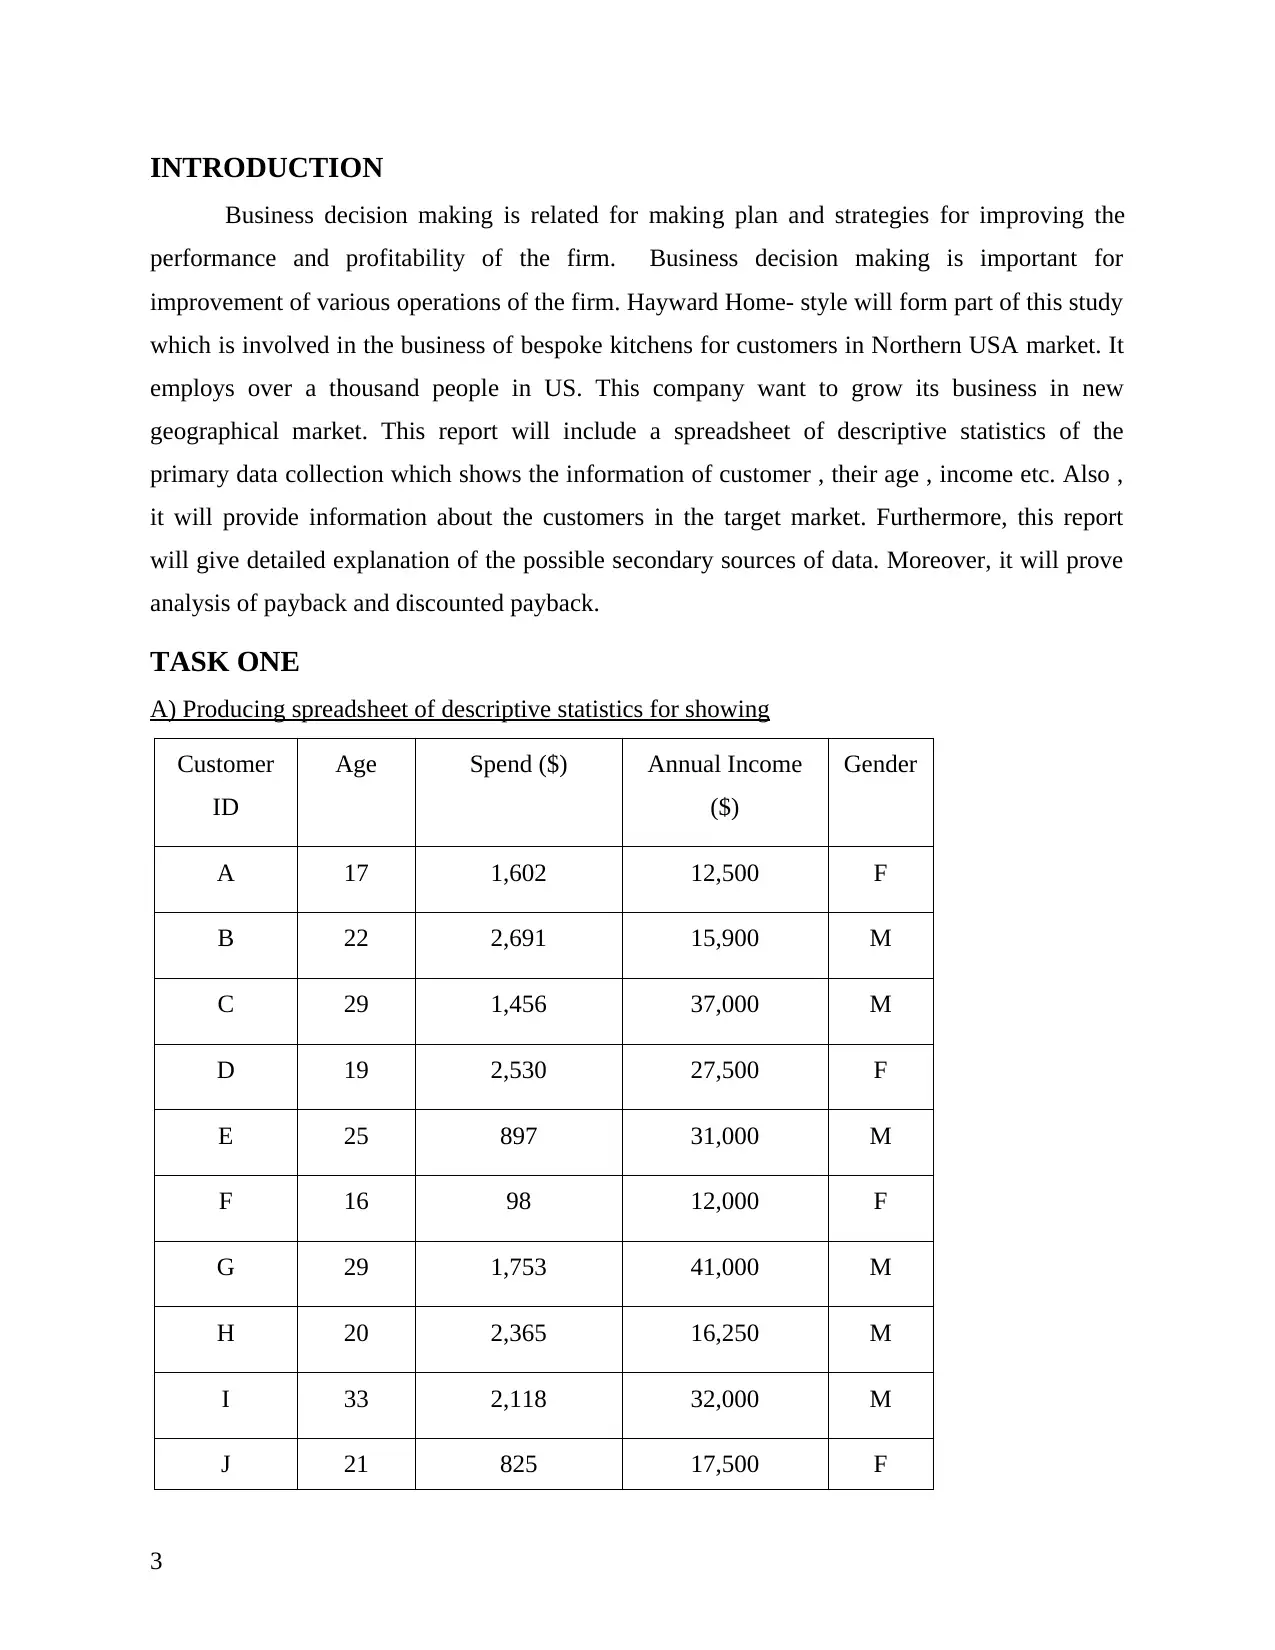
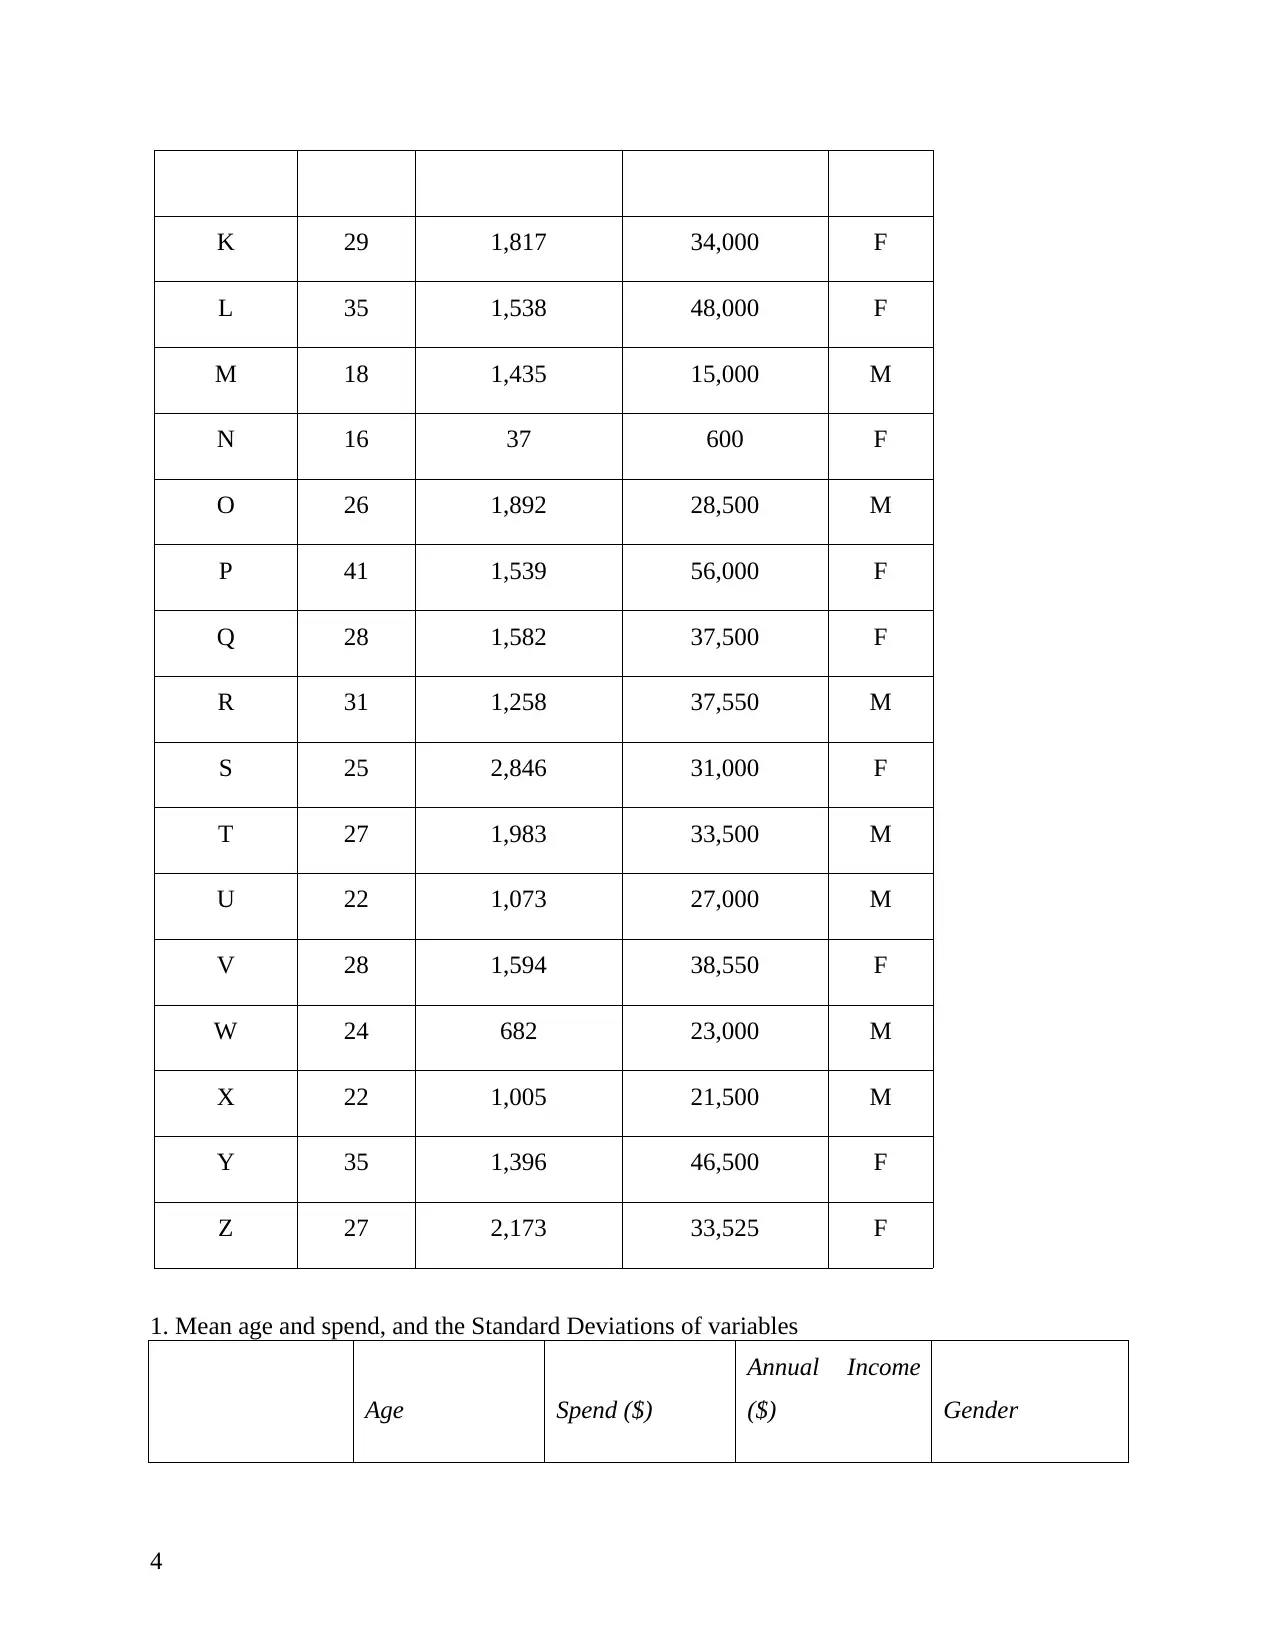
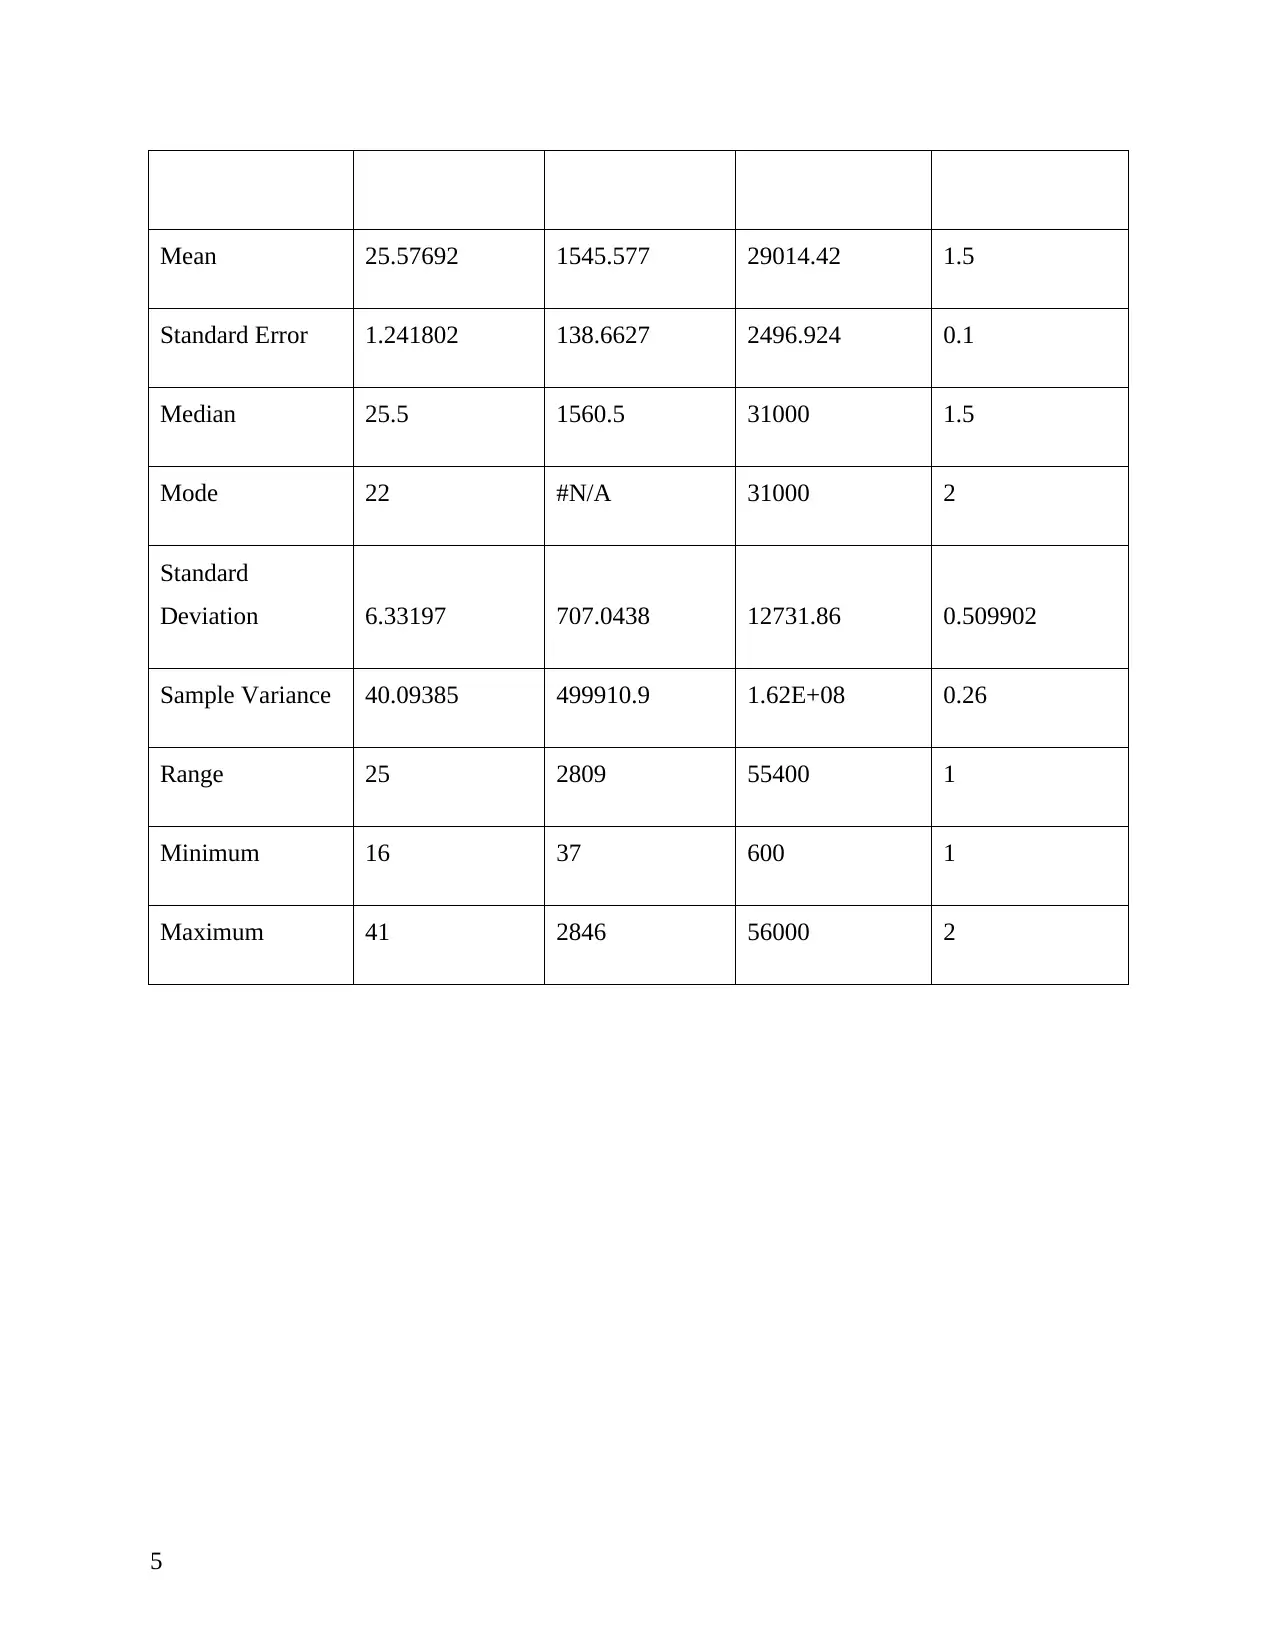
This assignment focuses on business decision-making within the context of a bespoke kitchen business, Hayward Home-style, aiming to expand into a new geographical market. The assignment begins with an analysis of primary data, including descriptive statistics like mean, median, mode, and standard deviation, along with histograms and correlation coefficients. Task One involves creating a spreadsheet of descriptive statistics and graphical representations of customer data. Task Two focuses on creating a formal plan for conducting customer surveys, listing secondary data sources, justifying survey methodology, and drafting a questionnaire. Task Three involves financial analysis, including payback and discounted payback analysis, Net Present Value (NPV) calculations, and the preparation of a Gantt chart for project management. The report aims to provide a comprehensive analysis to support strategic business decisions.


1 out of 35
Related Documents


Your All-in-One AI-Powered Toolkit for Academic Success.
+13062052269
info@desklib.com
Available 24*7 on WhatsApp / Email
![[object Object]](/_next/static/media/star-bottom.7253800d.svg)
Copyright © 2020–2026 A2Z Services. All Rights Reserved. Developed and managed by ZUCOL.