Business Performance Evaluation and Planning Report, Semester 1

Verified

Added on  2022/12/30

|15
|2359
|1
Report
AI Summary
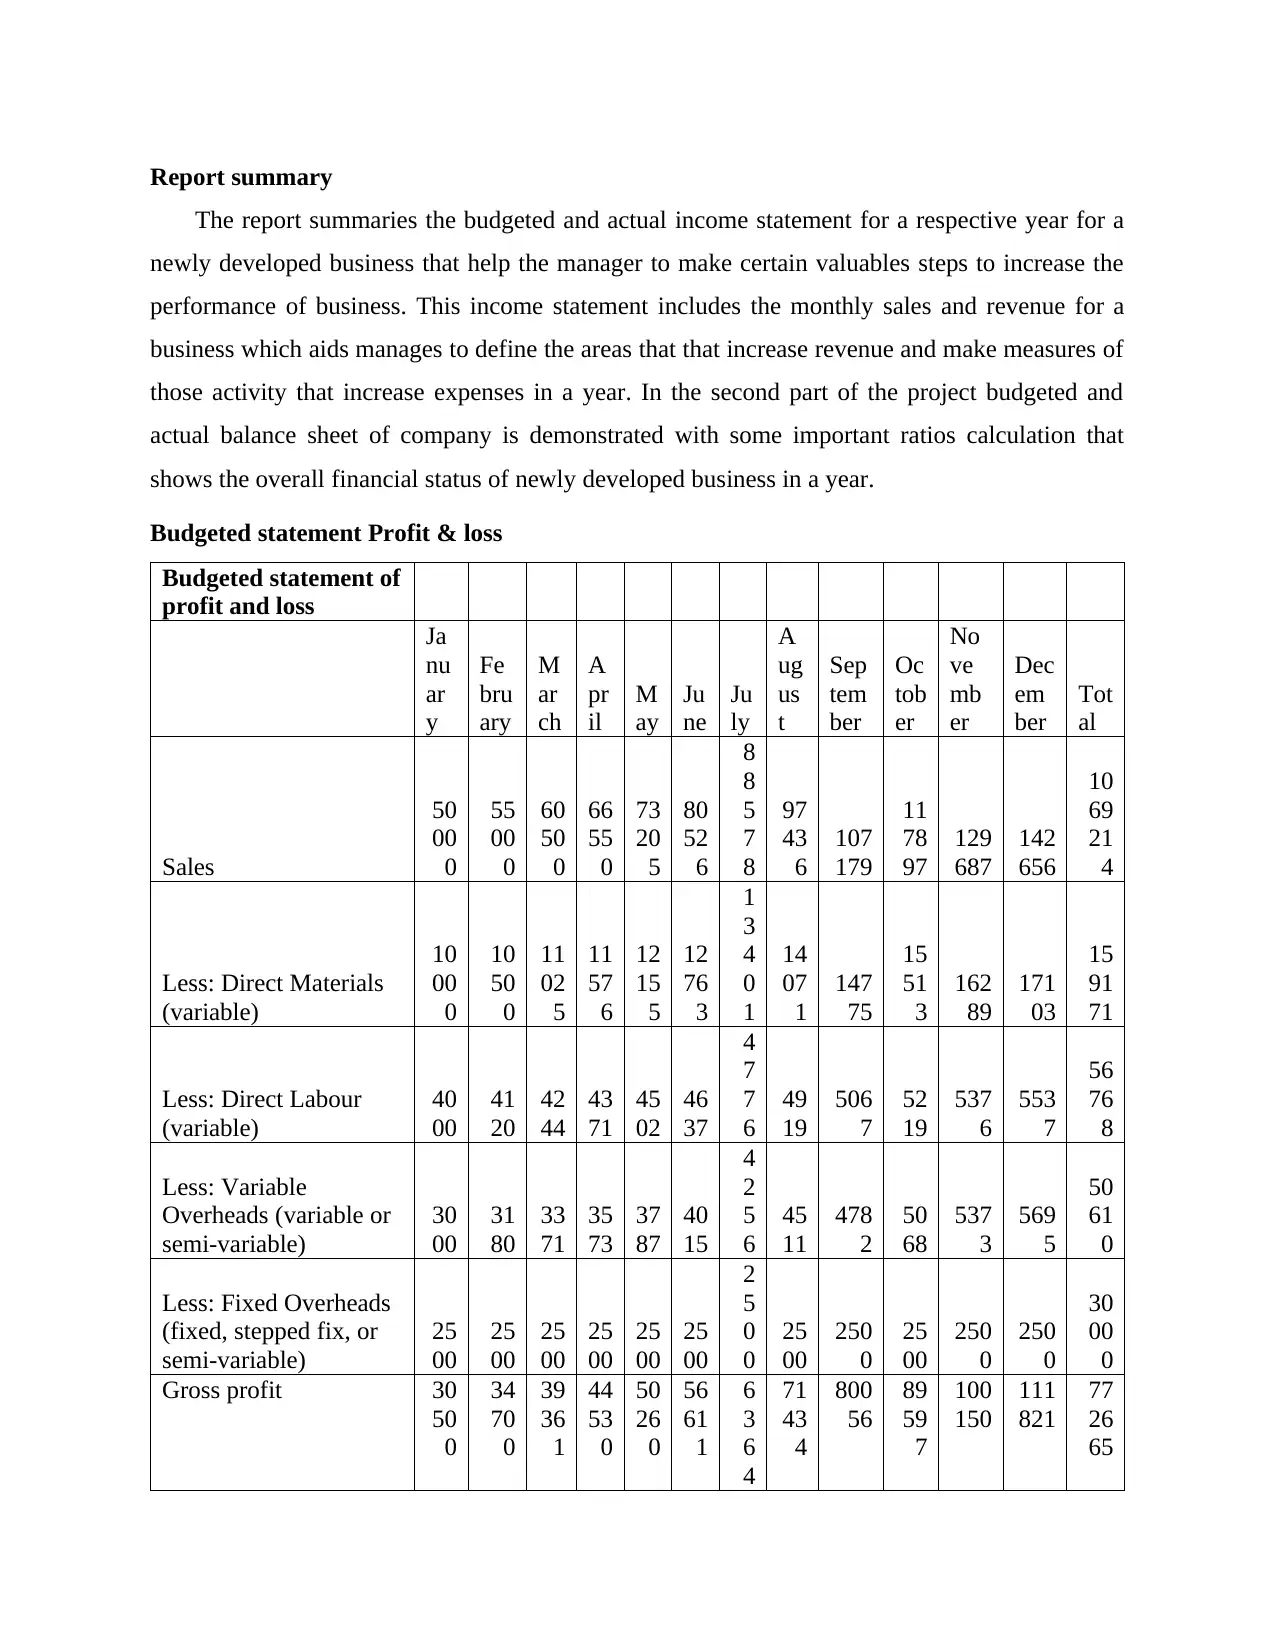
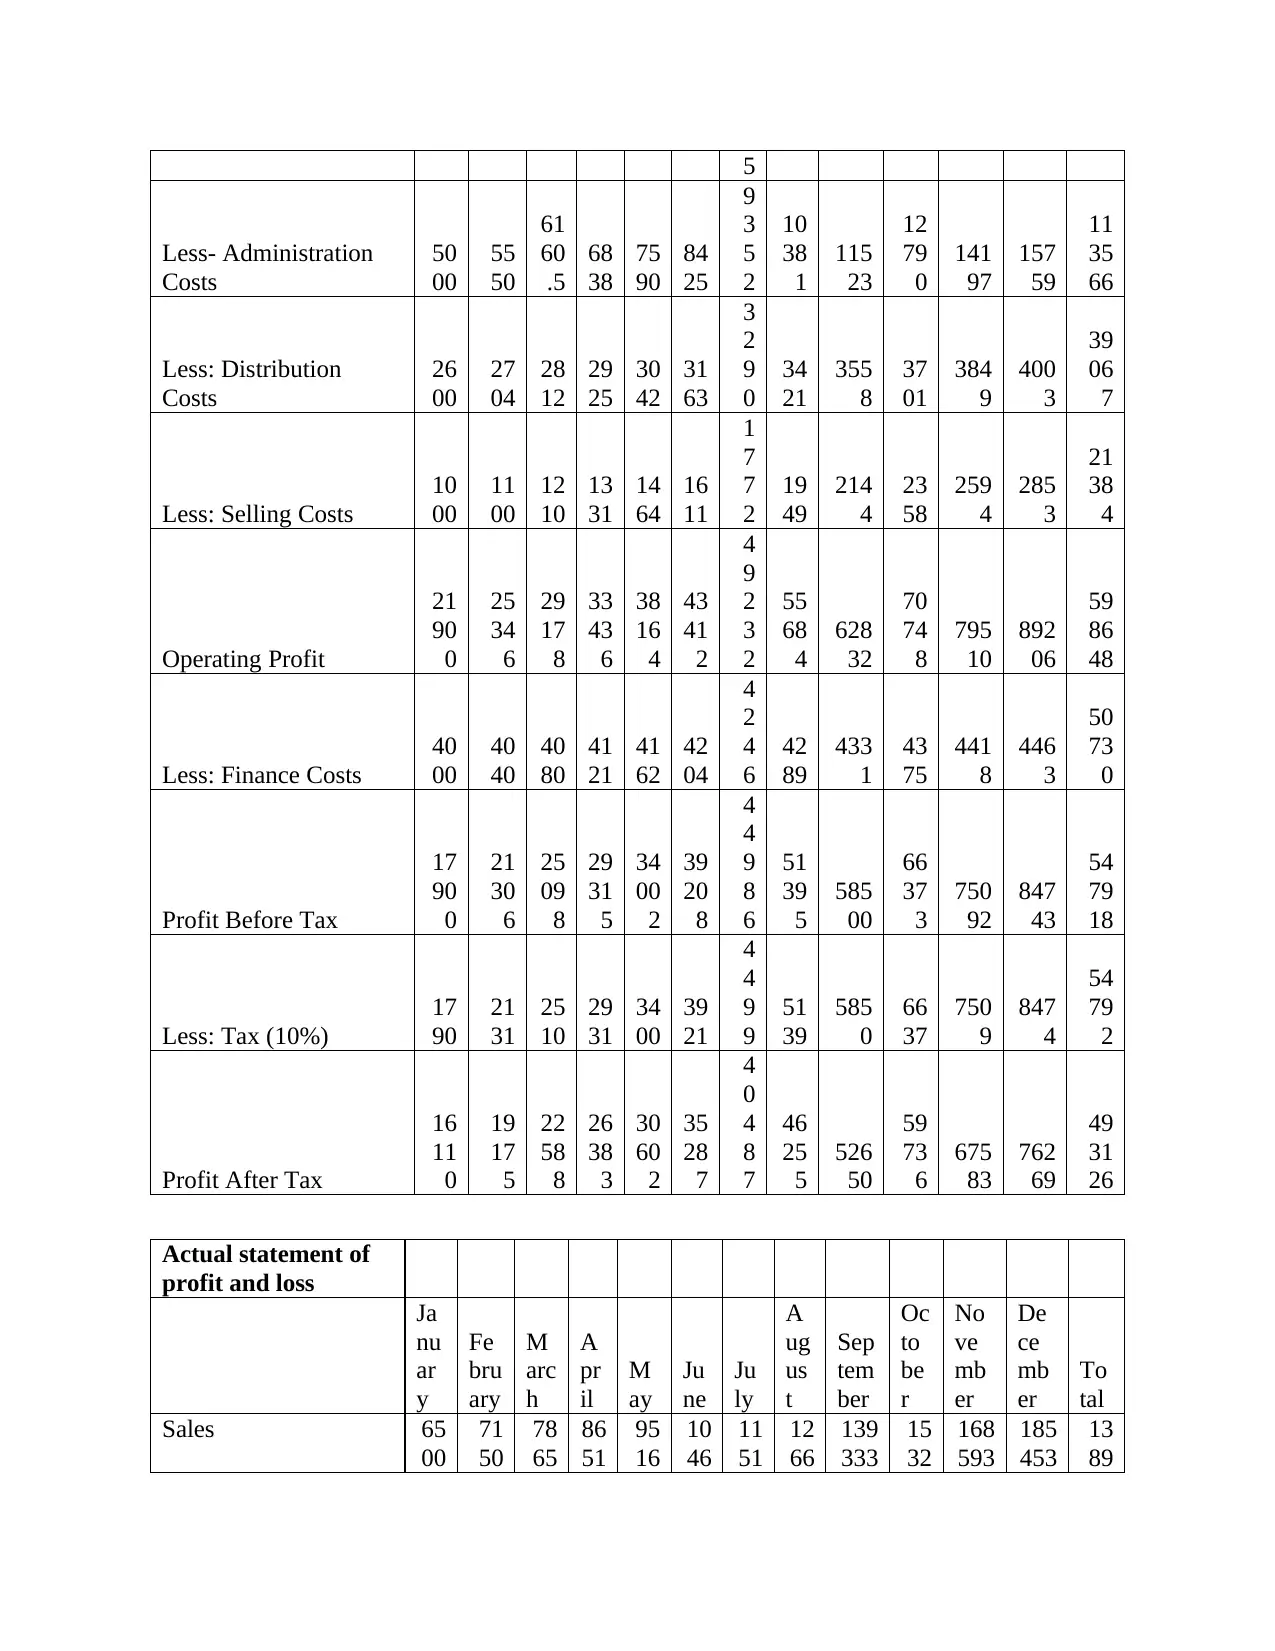
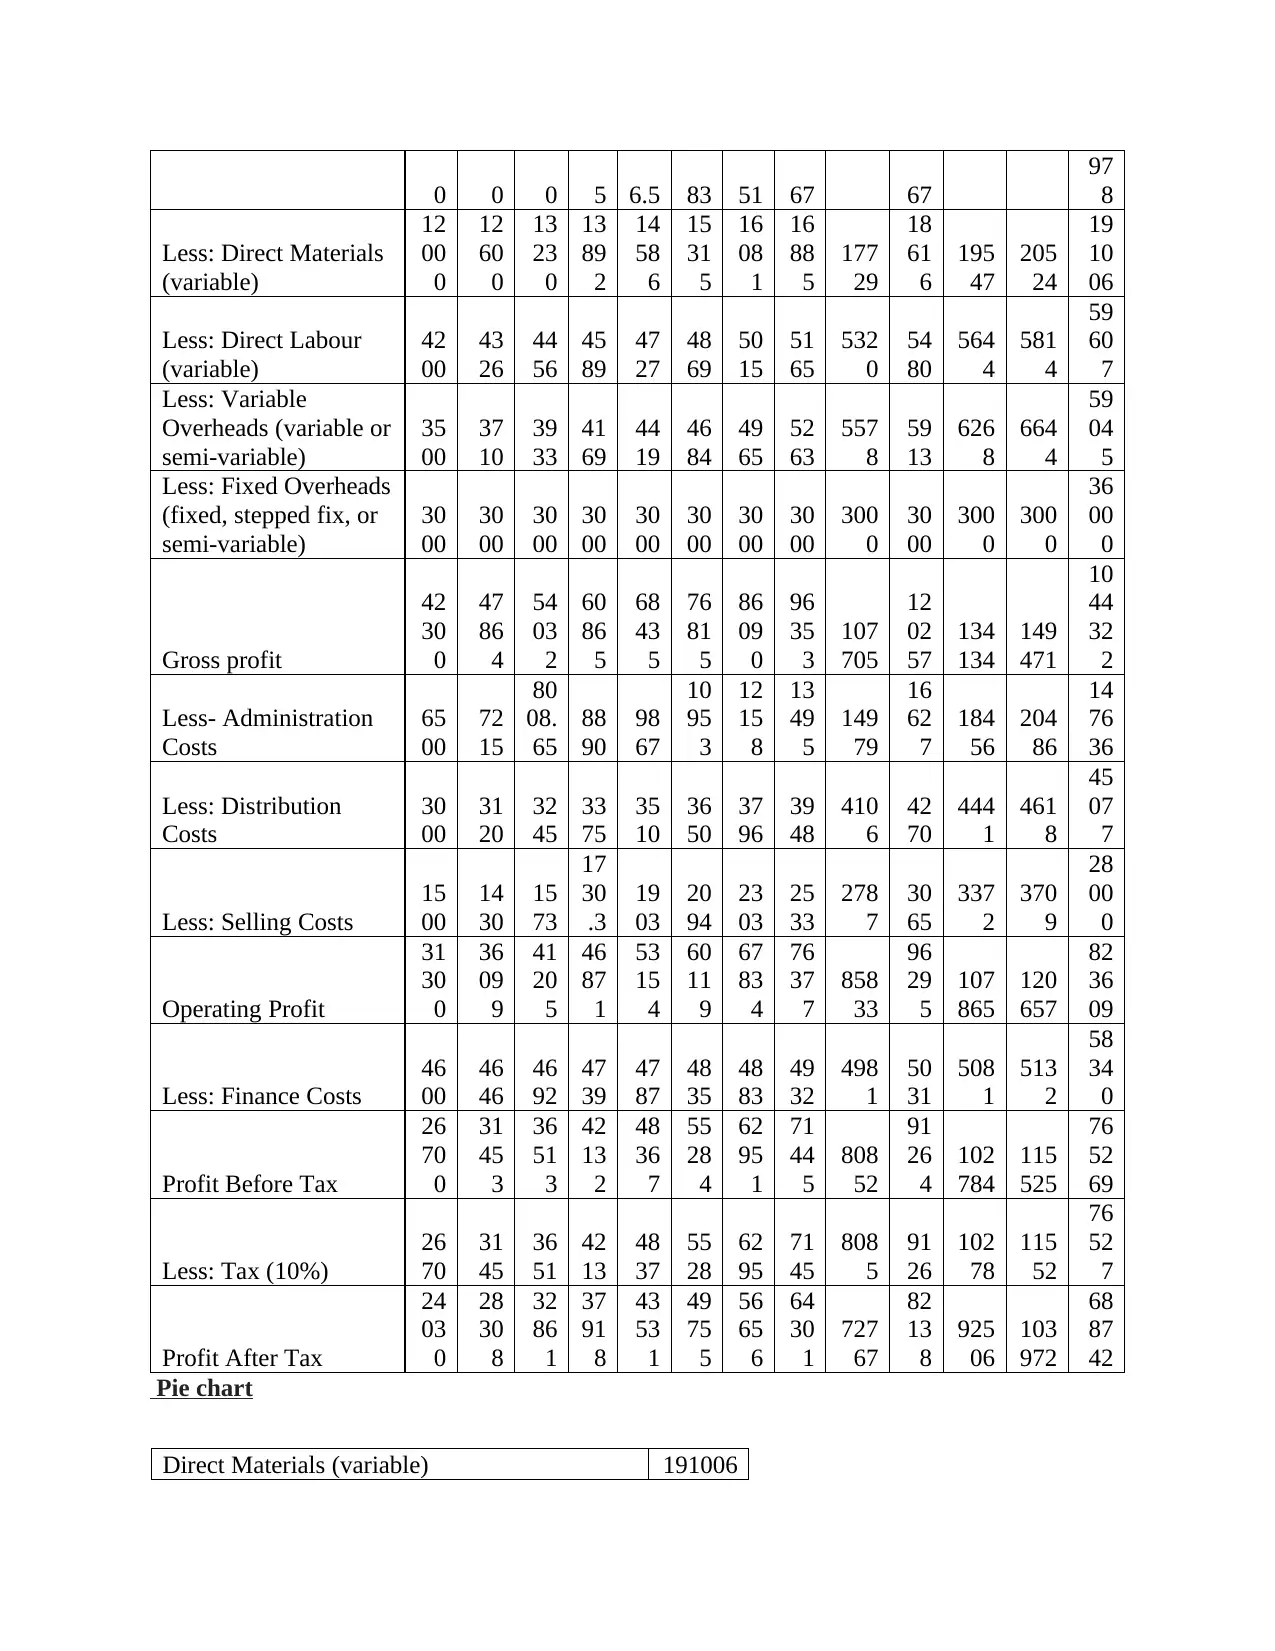
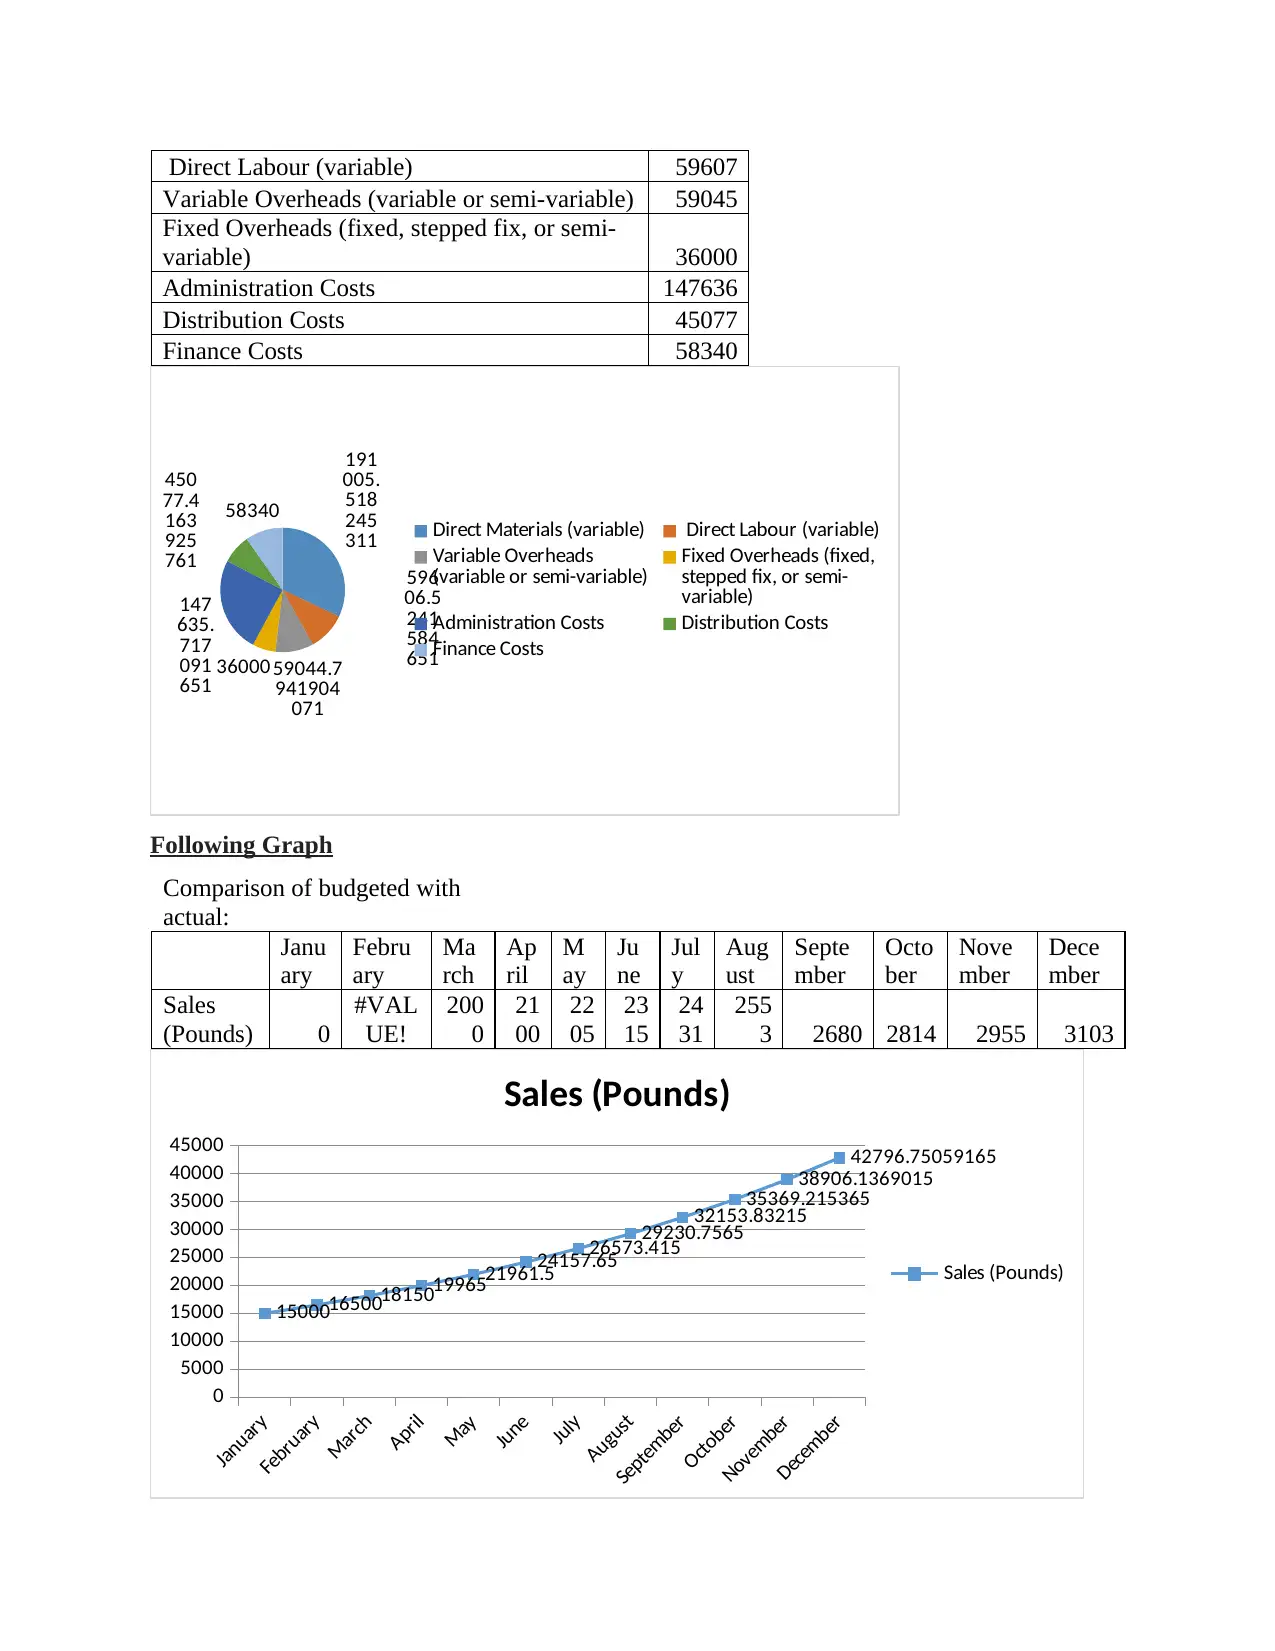
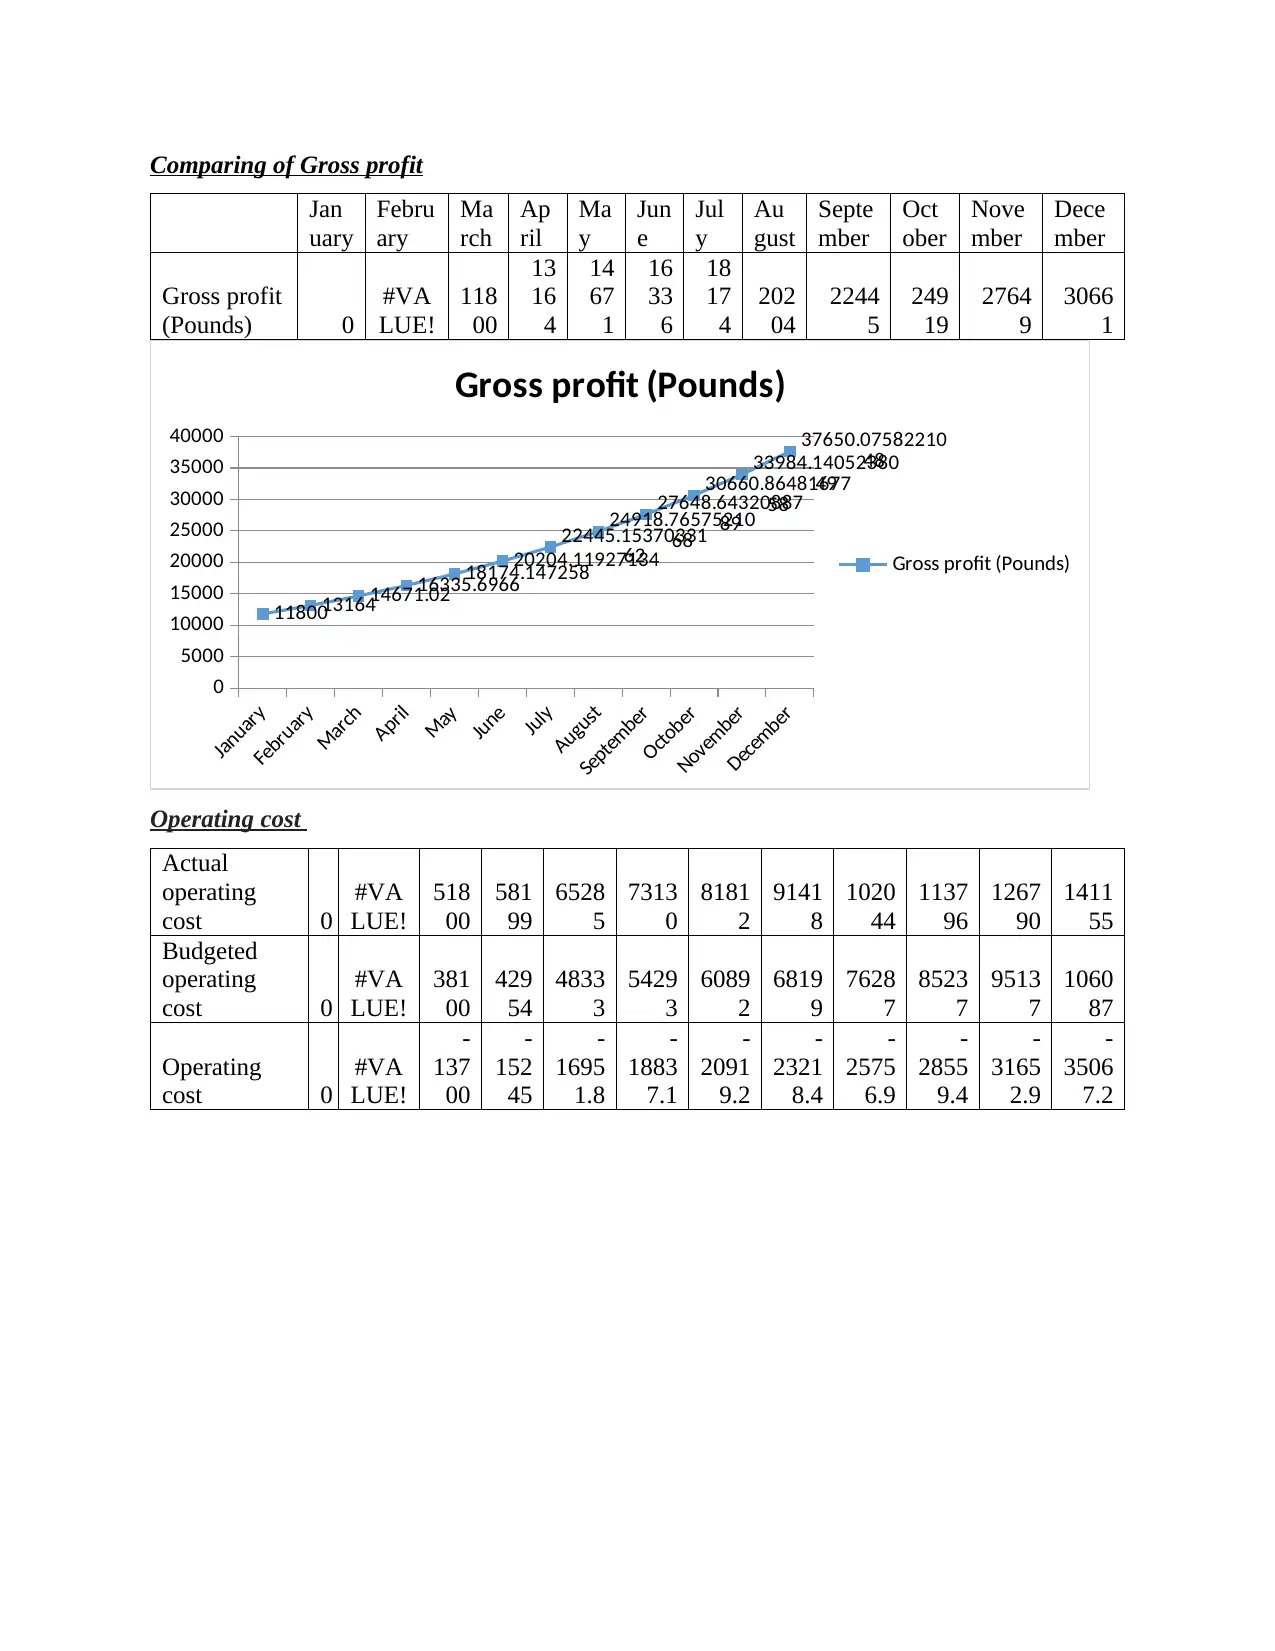
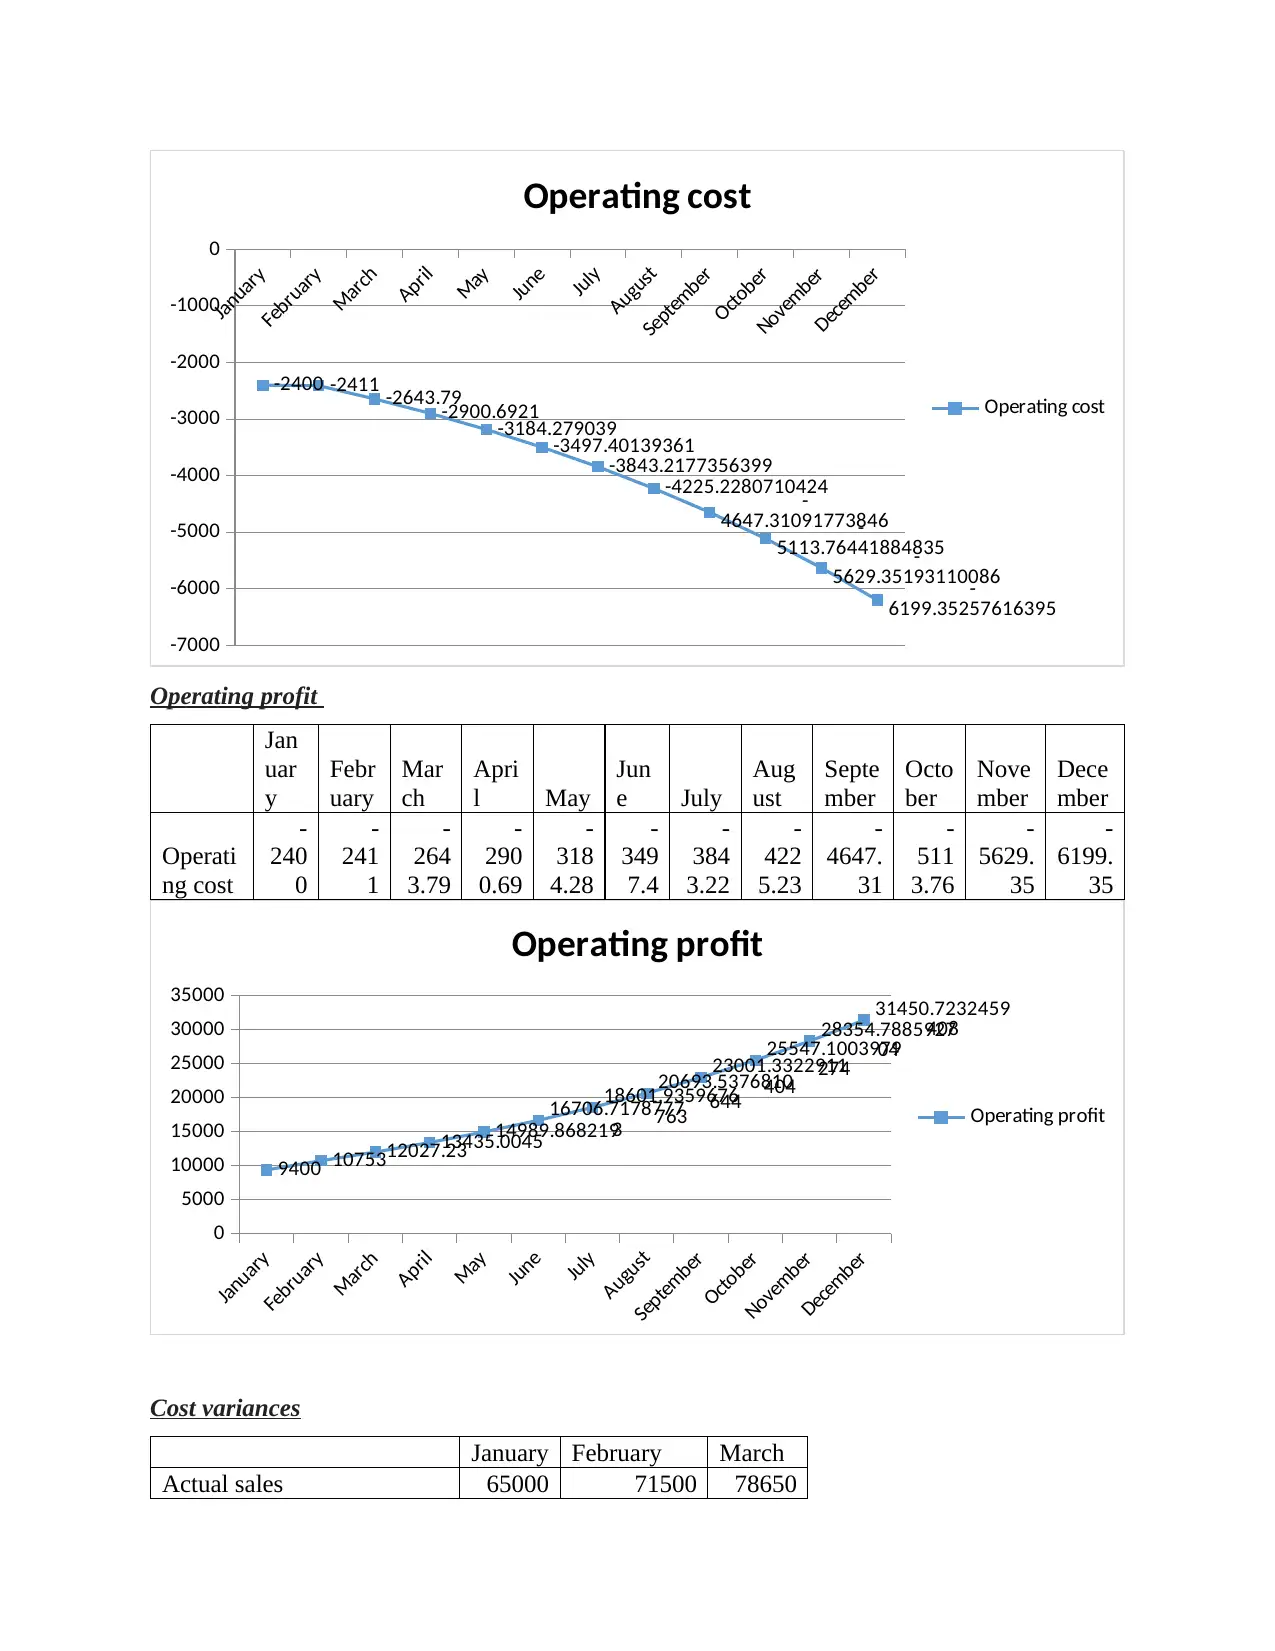
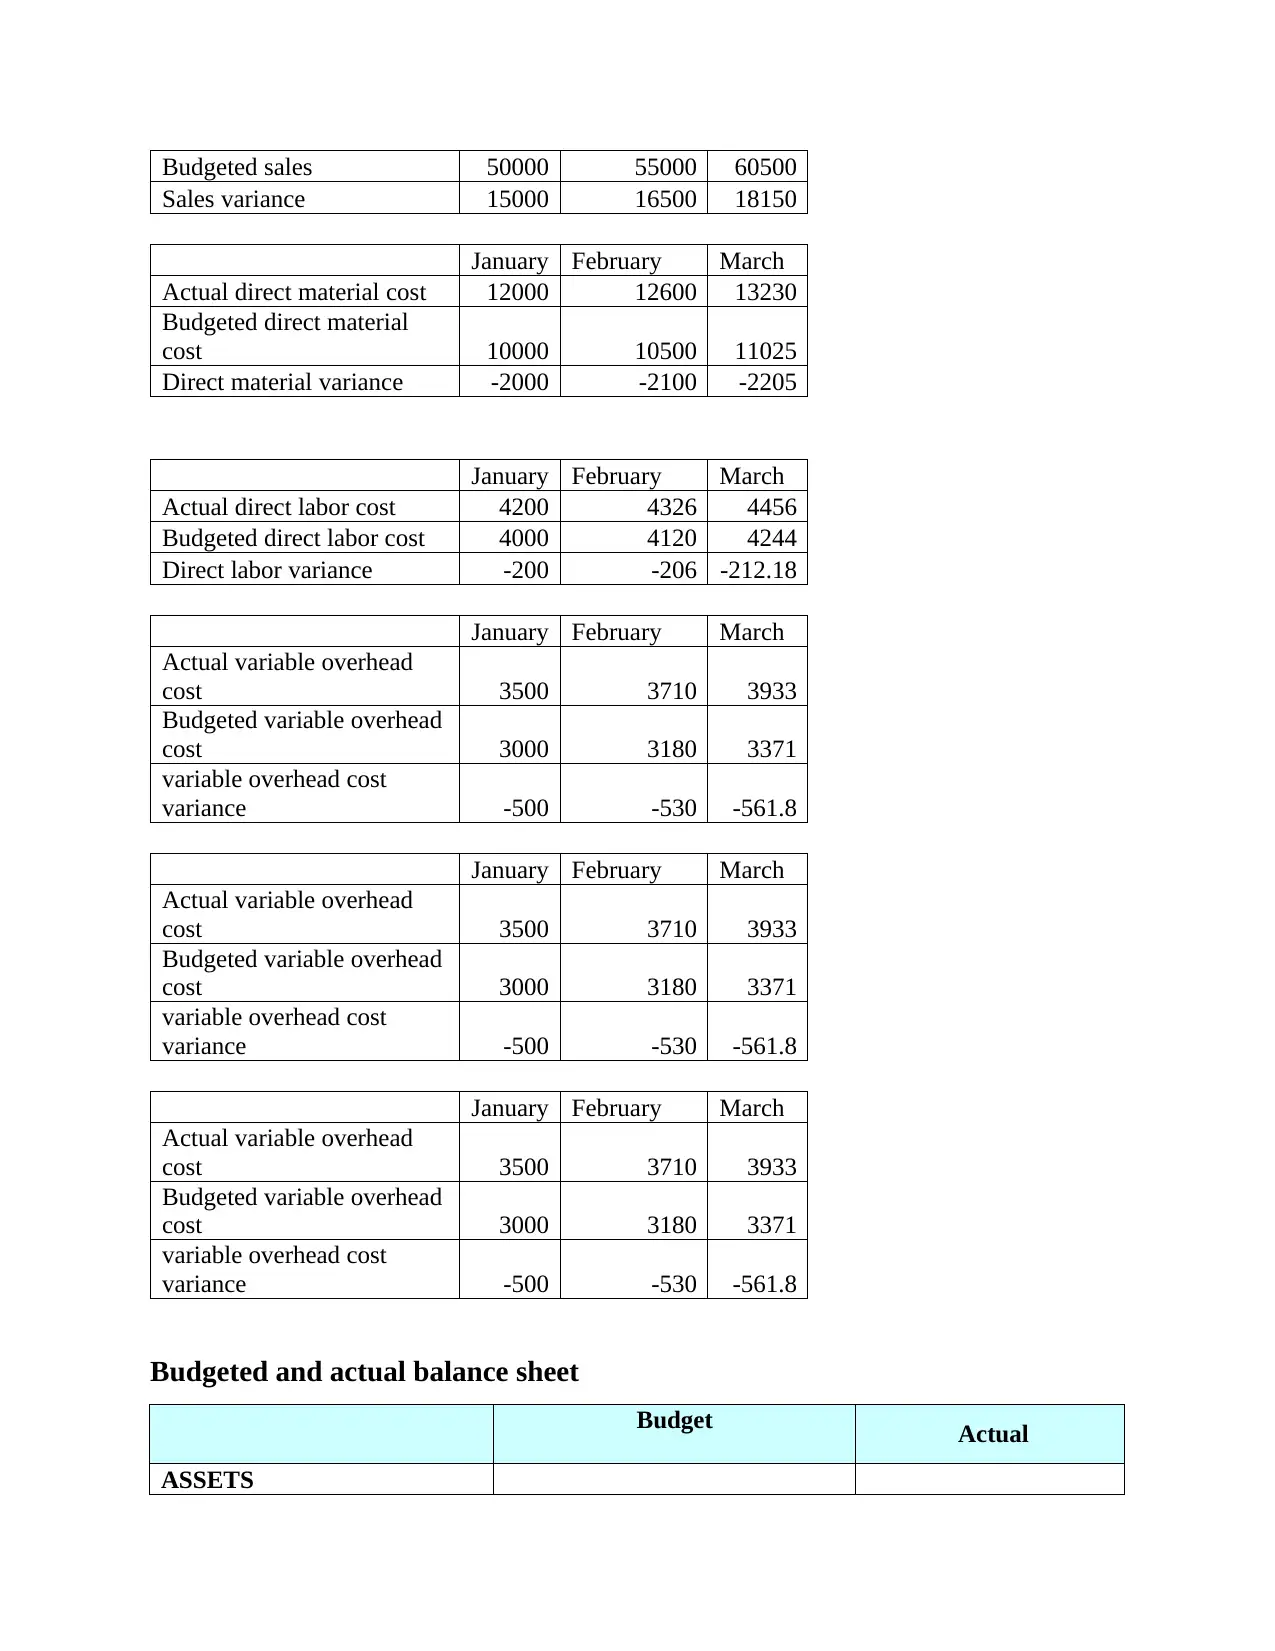
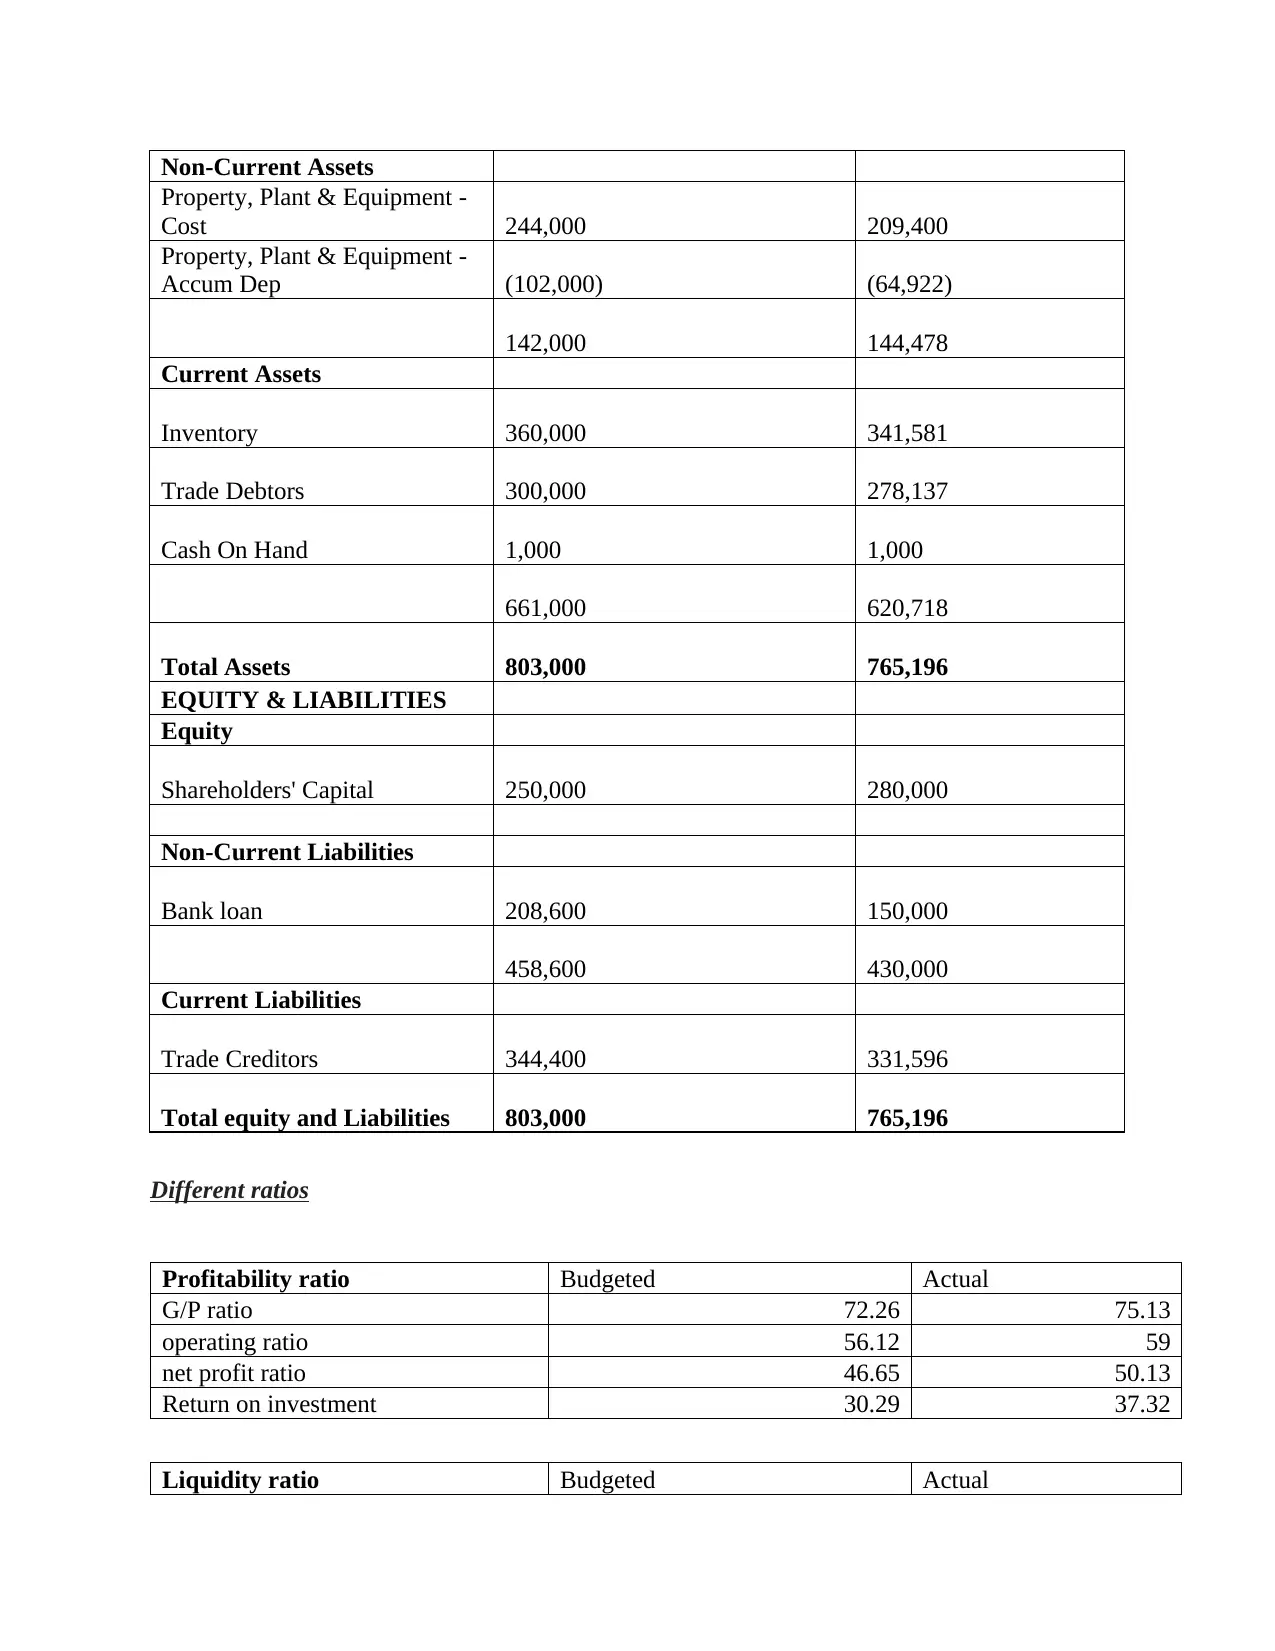
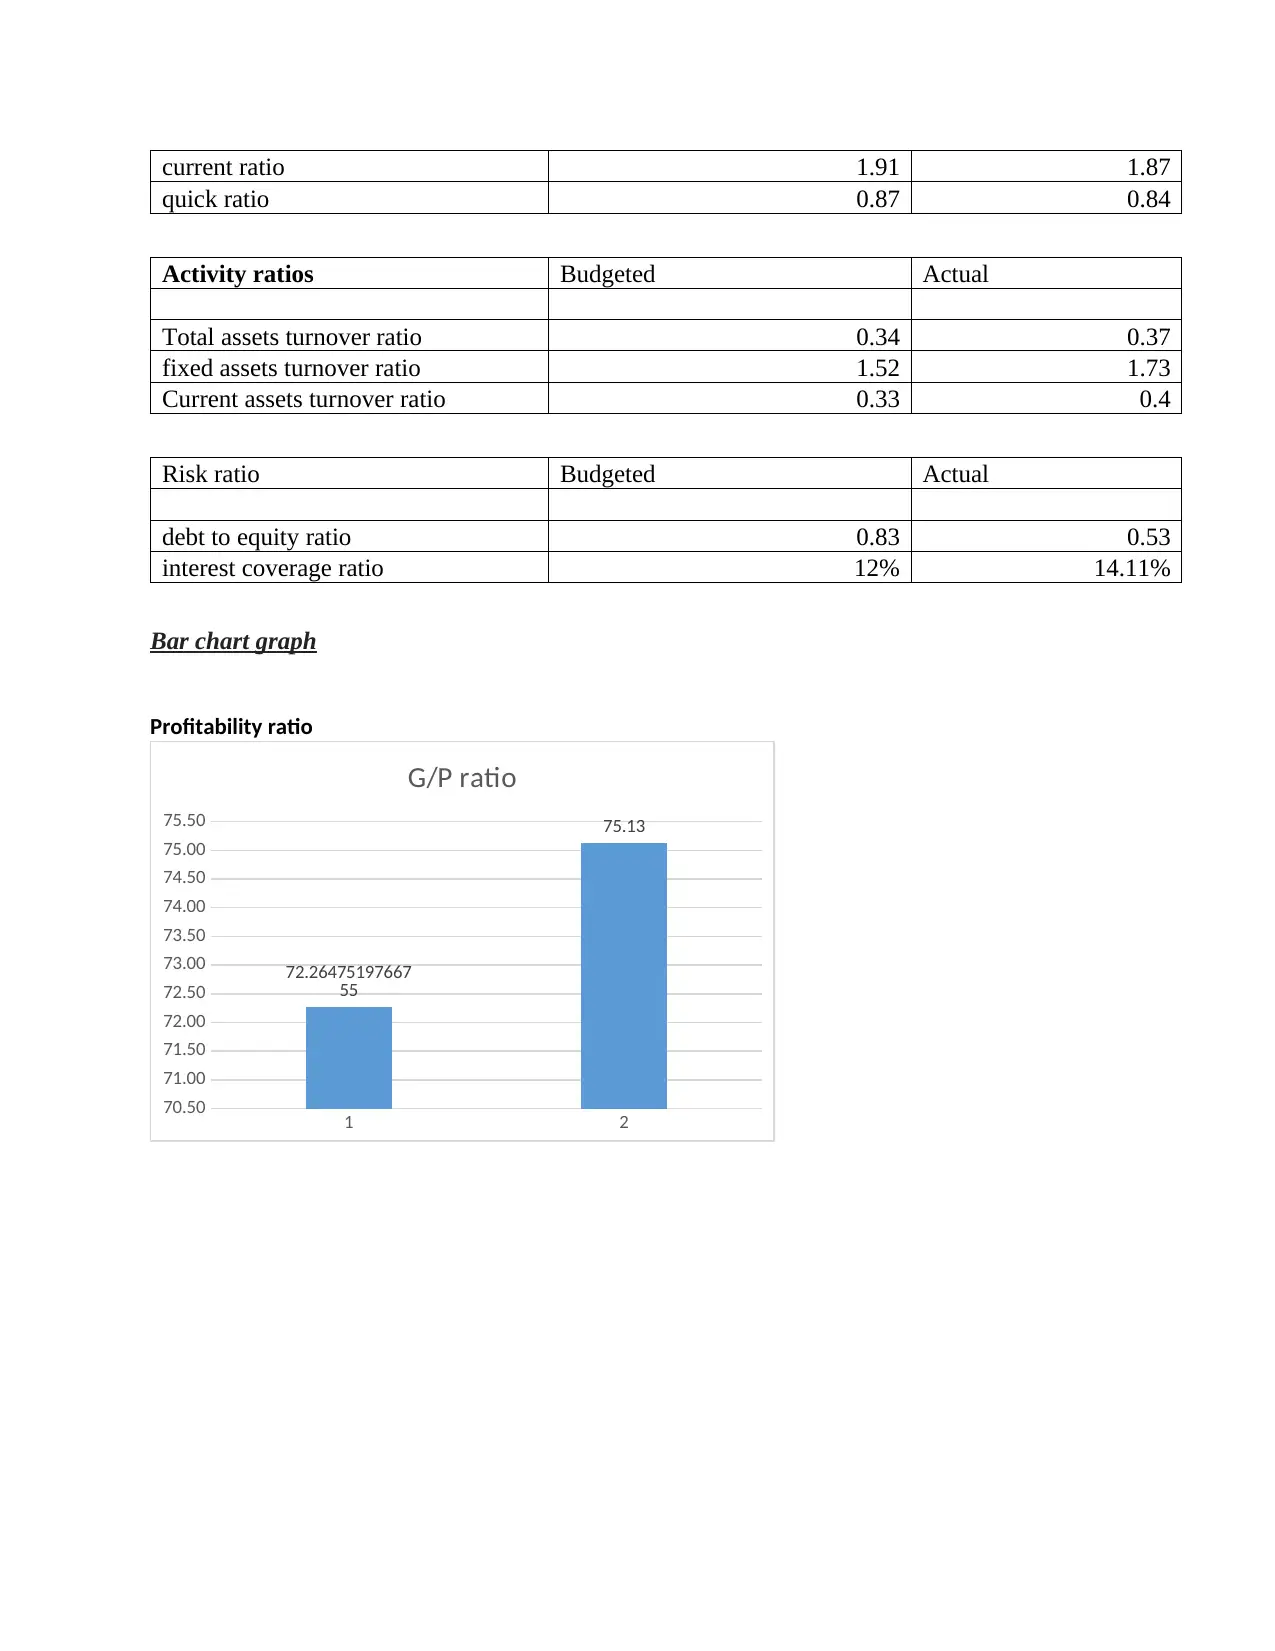
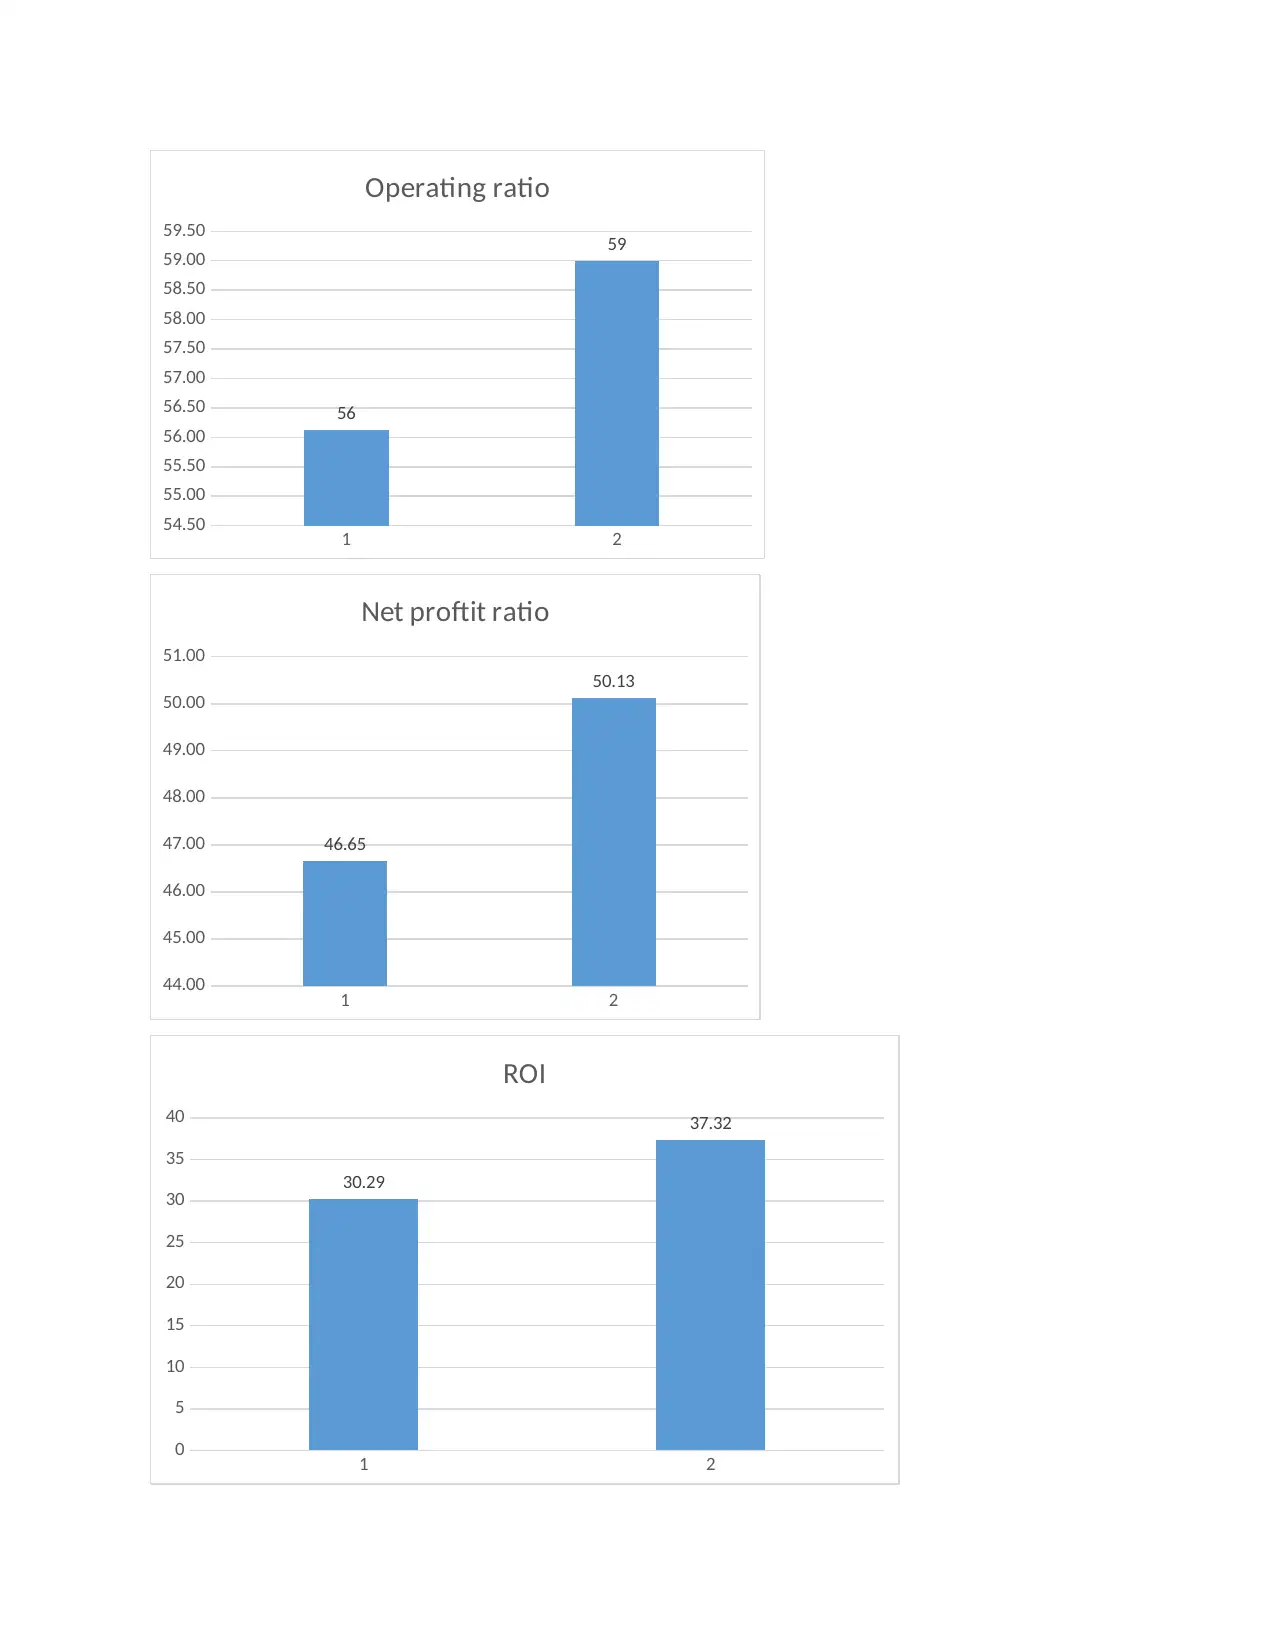
This report presents a comprehensive business plan, analyzing financial performance through budgeted and actual statements. It includes a detailed profit and loss statement, comparing monthly sales, revenue, and expenses to identify areas for improvement. Furthermore, the report provides a budgeted and actual balance sheet with key ratio calculations, offering insights into the financial health of the business. Variance analysis, comparing budgeted and actual figures for sales, direct materials, direct labor, and overheads, is also a key component, allowing for performance evaluation and strategic decision-making. The report concludes with a comparison of key financial indicators through graphs and charts.
Document Page
Business planning
tabler-icon-diamond-filled.svg

Paraphrase This Document

Need a fresh take? Get an instant paraphrase of this document with our AI Paraphraser
Document Page
Table of Contents
Report summary...............................................................................................................................3
Budgeted statement Profit & loss....................................................................................................3
Budgeted and actual balance sheet..................................................................................................9
Document Page
Report summary
The report summaries the budgeted and actual income statement for a respective year for a
newly developed business that help the manager to make certain valuables steps to increase the
performance of business. This income statement includes the monthly sales and revenue for a
business which aids manages to define the areas that that increase revenue and make measures of
those activity that increase expenses in a year. In the second part of the project budgeted and
actual balance sheet of company is demonstrated with some important ratios calculation that
shows the overall financial status of newly developed business in a year.
Budgeted statement Profit & loss
Budgeted statement of
profit and loss
Ja
nu
ar
y
Fe
bru
ary
M
ar
ch
A
pr
il
M
ay
Ju
ne
Ju
ly
A
ug
us
t
Sep
tem
ber
Oc
tob
er
No
ve
mb
er
Dec
em
ber
Tot
al
Sales
50
00
0
55
00
0
60
50
0
66
55
0
73
20
5
80
52
6
8
8
5
7
8
97
43
6
107
179
11
78
97
129
687
142
656
10
69
21
4
Less: Direct Materials
(variable)
10
00
0
10
50
0
11
02
5
11
57
6
12
15
5
12
76
3
1
3
4
0
1
14
07
1
147
75
15
51
3
162
89
171
03
15
91
71
Less: Direct Labour
(variable)
40
00
41
20
42
44
43
71
45
02
46
37
4
7
7
6
49
19
506
7
52
19
537
6
553
7
56
76
8
Less: Variable
Overheads (variable or
semi-variable)
30
00
31
80
33
71
35
73
37
87
40
15
4
2
5
6
45
11
478
2
50
68
537
3
569
5
50
61
0
Less: Fixed Overheads
(fixed, stepped fix, or
semi-variable)
25
00
25
00
25
00
25
00
25
00
25
00
2
5
0
0
25
00
250
0
25
00
250
0
250
0
30
00
0
Gross profit 30
50
0
34
70
0
39
36
1
44
53
0
50
26
0
56
61
1
6
3
6
4
71
43
4
800
56
89
59
7
100
150
111
821
77
26
65
Document Page
5
Less- Administration
Costs
50
00
55
50
61
60
.5
68
38
75
90
84
25
9
3
5
2
10
38
1
115
23
12
79
0
141
97
157
59
11
35
66
Less: Distribution
Costs
26
00
27
04
28
12
29
25
30
42
31
63
3
2
9
0
34
21
355
8
37
01
384
9
400
3
39
06
7
Less: Selling Costs
10
00
11
00
12
10
13
31
14
64
16
11
1
7
7
2
19
49
214
4
23
58
259
4
285
3
21
38
4
Operating Profit
21
90
0
25
34
6
29
17
8
33
43
6
38
16
4
43
41
2
4
9
2
3
2
55
68
4
628
32
70
74
8
795
10
892
06
59
86
48
Less: Finance Costs
40
00
40
40
40
80
41
21
41
62
42
04
4
2
4
6
42
89
433
1
43
75
441
8
446
3
50
73
0
Profit Before Tax
17
90
0
21
30
6
25
09
8
29
31
5
34
00
2
39
20
8
4
4
9
8
6
51
39
5
585
00
66
37
3
750
92
847
43
54
79
18
Less: Tax (10%)
17
90
21
31
25
10
29
31
34
00
39
21
4
4
9
9
51
39
585
0
66
37
750
9
847
4
54
79
2
Profit After Tax
16
11
0
19
17
5
22
58
8
26
38
3
30
60
2
35
28
7
4
0
4
8
7
46
25
5
526
50
59
73
6
675
83
762
69
49
31
26
Actual statement of
profit and loss
Ja
nu
ar
y
Fe
bru
ary
M
arc
h
A
pr
il
M
ay
Ju
ne
Ju
ly
A
ug
us
t
Sep
tem
ber
Oc
to
be
r
No
ve
mb
er
De
ce
mb
er
To
tal
Sales 65
00
71
50
78
65
86
51
95
16
10
46
11
51
12
66
139
333
15
32
168
593
185
453
13
89
tabler-icon-diamond-filled.svg

Paraphrase This Document

Need a fresh take? Get an instant paraphrase of this document with our AI Paraphraser
Document Page
0 0 0 5 6.5 83 51 67 67
97
8
Less: Direct Materials
(variable)
12
00
0
12
60
0
13
23
0
13
89
2
14
58
6
15
31
5
16
08
1
16
88
5
177
29
18
61
6
195
47
205
24
19
10
06
Less: Direct Labour
(variable)
42
00
43
26
44
56
45
89
47
27
48
69
50
15
51
65
532
0
54
80
564
4
581
4
59
60
7
Less: Variable
Overheads (variable or
semi-variable)
35
00
37
10
39
33
41
69
44
19
46
84
49
65
52
63
557
8
59
13
626
8
664
4
59
04
5
Less: Fixed Overheads
(fixed, stepped fix, or
semi-variable)
30
00
30
00
30
00
30
00
30
00
30
00
30
00
30
00
300
0
30
00
300
0
300
0
36
00
0
Gross profit
42
30
0
47
86
4
54
03
2
60
86
5
68
43
5
76
81
5
86
09
0
96
35
3
107
705
12
02
57
134
134
149
471
10
44
32
2
Less- Administration
Costs
65
00
72
15
80
08.
65
88
90
98
67
10
95
3
12
15
8
13
49
5
149
79
16
62
7
184
56
204
86
14
76
36
Less: Distribution
Costs
30
00
31
20
32
45
33
75
35
10
36
50
37
96
39
48
410
6
42
70
444
1
461
8
45
07
7
Less: Selling Costs
15
00
14
30
15
73
17
30
.3
19
03
20
94
23
03
25
33
278
7
30
65
337
2
370
9
28
00
0
Operating Profit
31
30
0
36
09
9
41
20
5
46
87
1
53
15
4
60
11
9
67
83
4
76
37
7
858
33
96
29
5
107
865
120
657
82
36
09
Less: Finance Costs
46
00
46
46
46
92
47
39
47
87
48
35
48
83
49
32
498
1
50
31
508
1
513
2
58
34
0
Profit Before Tax
26
70
0
31
45
3
36
51
3
42
13
2
48
36
7
55
28
4
62
95
1
71
44
5
808
52
91
26
4
102
784
115
525
76
52
69
Less: Tax (10%)
26
70
31
45
36
51
42
13
48
37
55
28
62
95
71
45
808
5
91
26
102
78
115
52
76
52
7
Profit After Tax
24
03
0
28
30
8
32
86
1
37
91
8
43
53
1
49
75
5
56
65
6
64
30
1
727
67
82
13
8
925
06
103
972
68
87
42
Pie chart
Direct Materials (variable) 191006
Document Page
Direct Labour (variable) 59607
Variable Overheads (variable or semi-variable) 59045
Fixed Overheads (fixed, stepped fix, or semi-
variable) 36000
Administration Costs 147636
Distribution Costs 45077
Finance Costs 58340
191
005.
518
245
311
596
06.5
241
584
65159044.7
941904
071
36000
147
635.
717
091
651
450
77.4
163
925
761
58340 Direct Materials (variable) Direct Labour (variable)
Variable Overheads
(variable or semi-variable) Fixed Overheads (fixed,
stepped fix, or semi-
variable)
Administration Costs Distribution Costs
Finance Costs
Following Graph
Comparison of budgeted with
actual:
Janu
ary
Febru
ary
Ma
rch
Ap
ril
M
ay
Ju
ne
Jul
y
Aug
ust
Septe
mber
Octo
ber
Nove
mber
Dece
mber
Sales
(Pounds) 0
#VAL
UE!
200
0
21
00
22
05
23
15
24
31
255
3 2680 2814 2955 3103
January
February
March
April
May
June
July
August
September
October
November
December
0
5000
10000
15000
20000
25000
30000
35000
40000
45000
1500016500181501996521961.5
24157.65
26573.415
29230.7565
32153.83215
35369.215365
38906.1369015
42796.75059165
Sales (Pounds)
Sales (Pounds)
Document Page
Comparing of Gross profit
Jan
uary
Febru
ary
Ma
rch
Ap
ril
Ma
y
Jun
e
Jul
y
Au
gust
Septe
mber
Oct
ober
Nove
mber
Dece
mber
Gross profit
(Pounds) 0
#VA
LUE!
118
00
13
16
4
14
67
1
16
33
6
18
17
4
202
04
2244
5
249
19
2764
9
3066
1
January
February
March
April
May
June
July
August
September
October
November
December
0
5000
10000
15000
20000
25000
30000
35000
40000
118001316414671.0216335.6966
18174.147258
20204.11927134
22445.15370331
62
24918.76575210
68
27648.64320887
89
30660.86481677
58
33984.14052380
49
37650.07582210
48
Gross profit (Pounds)
Operating cost
Actual
operating
cost 0
#VA
LUE!
518
00
581
99
6528
5
7313
0
8181
2
9141
8
1020
44
1137
96
1267
90
1411
55
Budgeted
operating
cost 0
#VA
LUE!
381
00
429
54
4833
3
5429
3
6089
2
6819
9
7628
7
8523
7
9513
7
1060
87
Operating
cost 0
#VA
LUE!
-
137
00
-
152
45
-
1695
1.8
-
1883
7.1
-
2091
9.2
-
2321
8.4
-
2575
6.9
-
2855
9.4
-
3165
2.9
-
3506
7.2
tabler-icon-diamond-filled.svg

Paraphrase This Document

Need a fresh take? Get an instant paraphrase of this document with our AI Paraphraser
Document Page
January
February
March
April
May
June
July
August
September
October
November
December
-7000
-6000
-5000
-4000
-3000
-2000
-1000
0
-2400 -2411 -2643.79
-2900.6921
-3184.279039
-3497.40139361
-3843.2177356399
-4225.2280710424
-
4647.31091773846-
5113.76441884835-
5629.35193110086
-
6199.35257616395
Operating cost
Operating cost
Operating profit
Jan
uar
y
Febr
uary
Mar
ch
Apri
l May
Jun
e July
Aug
ust
Septe
mber
Octo
ber
Nove
mber
Dece
mber
Operati
ng cost
-
240
0
-
241
1
-
264
3.79
-
290
0.69
-
318
4.28
-
349
7.4
-
384
3.22
-
422
5.23
-
4647.
31
-
511
3.76
-
5629.
35
-
6199.
35
January
February
March
April
May
June
July
August
September
October
November
December
0
5000
10000
15000
20000
25000
30000
35000
9400 1075312027.2313435.0045
14989.868219
16706.7178777
3
18601.9359676
763
20693.5376810
644
23001.3322911
404
25547.1003979
274
28354.7885927
04
31450.7232459
408
Operating profit
Operating profit
Cost variances
January February March
Actual sales 65000 71500 78650
Document Page
Budgeted sales 50000 55000 60500
Sales variance 15000 16500 18150
January February March
Actual direct material cost 12000 12600 13230
Budgeted direct material
cost 10000 10500 11025
Direct material variance -2000 -2100 -2205
January February March
Actual direct labor cost 4200 4326 4456
Budgeted direct labor cost 4000 4120 4244
Direct labor variance -200 -206 -212.18
January February March
Actual variable overhead
cost 3500 3710 3933
Budgeted variable overhead
cost 3000 3180 3371
variable overhead cost
variance -500 -530 -561.8
January February March
Actual variable overhead
cost 3500 3710 3933
Budgeted variable overhead
cost 3000 3180 3371
variable overhead cost
variance -500 -530 -561.8
January February March
Actual variable overhead
cost 3500 3710 3933
Budgeted variable overhead
cost 3000 3180 3371
variable overhead cost
variance -500 -530 -561.8
Budgeted and actual balance sheet
Budget Actual
ASSETS
Document Page
Non-Current Assets
Property, Plant & Equipment -
Cost 244,000 209,400
Property, Plant & Equipment -
Accum Dep (102,000) (64,922)
142,000 144,478
Current Assets
Inventory 360,000 341,581
Trade Debtors 300,000 278,137
Cash On Hand 1,000 1,000
661,000 620,718
Total Assets 803,000 765,196
EQUITY & LIABILITIES
Equity
Shareholders' Capital 250,000 280,000
Non-Current Liabilities
Bank loan 208,600 150,000
458,600 430,000
Current Liabilities
Trade Creditors 344,400 331,596
Total equity and Liabilities 803,000 765,196
Different ratios
Profitability ratio Budgeted Actual
G/P ratio 72.26 75.13
operating ratio 56.12 59
net profit ratio 46.65 50.13
Return on investment 30.29 37.32
Liquidity ratio Budgeted Actual
tabler-icon-diamond-filled.svg

Paraphrase This Document

Need a fresh take? Get an instant paraphrase of this document with our AI Paraphraser
Document Page
current ratio 1.91 1.87
quick ratio 0.87 0.84
Activity ratios Budgeted Actual
Total assets turnover ratio 0.34 0.37
fixed assets turnover ratio 1.52 1.73
Current assets turnover ratio 0.33 0.4
Risk ratio Budgeted Actual
debt to equity ratio 0.83 0.53
interest coverage ratio 12% 14.11%
Bar chart graph
Profitability ratio
1 2
70.50
71.00
71.50
72.00
72.50
73.00
73.50
74.00
74.50
75.00
75.50
72.26475197667
55
75.13
G/P ratio
Document Page
1 2
54.50
55.00
55.50
56.00
56.50
57.00
57.50
58.00
58.50
59.00
59.50
56
59
Operating ratio
1 2
44.00
45.00
46.00
47.00
48.00
49.00
50.00
51.00
46.65
50.13
Net proftit ratio
1 2
0
5
10
15
20
25
30
35
40
30.29
37.32
ROI
chevron_up_icon
1 out of 15
circle_padding
hide_on_mobile
zoom_out_icon
[object Object]