Business Decision Making Report: Data Analysis and Forecasting
VerifiedAdded on 2023/03/31
|15
|3438
|424
Report
AI Summary
This report delves into the core concepts of business decision-making, encompassing data collection, analysis, and forecasting techniques. It begins by outlining plans for gathering both primary and secondary data, emphasizing the importance of survey methodology, sampling frames, and questionnaire design for effective data acquisition. The report then progresses to data summarization, utilizing representative values and analyzing results to draw valid conclusions, including measures of dispersion to inform business scenarios. Furthermore, the report explains the application of quartiles, percentiles, and correlation coefficients in data analysis. The use of spreadsheets to generate graphs and draw conclusions, along with the application of trend lines for forecasting, is demonstrated, culminating in the production of a formal business report. Finally, the report explores the use of information processing tools, project planning, and financial tools to support sound decision-making processes.

BUSINESS
DECISION MAKING
DECISION MAKING
Paraphrase This Document
Need a fresh take? Get an instant paraphrase of this document with our AI Paraphraser
Introduction.................................................................................................................................................3
Task 1..........................................................................................................................................................4
create a plan for the collection of primary and secondary data for a given business problem..................4
1.2 present the survey methodology and sampling frame used................................................................4
1.3 design a questionnaire for a given business problem.........................................................................4
Task 2..........................................................................................................................................................6
2.1&2.2 create information for decision making by summarizing data using representative &values
analyses the results to draw valid conclusion..........................................................................................6
2.3 analyses data using measures of dispersion to inform a given business scenario...............................7
2.4 explain how quartiles, percentiles and the correlation coefficient are used........................................7
Task 3..........................................................................................................................................................8
3.1 produce graphs using spreadsheets and draw valid conclusions based on the information derived. . .8
3.2\ 3.3 trend lines in spreadsheet graphs to assist in forecasting for specified business information&
business using suitable software and techniques......................................................................................9
3.4produce a formal business report......................................................................................................11
Task 4........................................................................................................................................................11
4.1&4.2Use appropriate information processing tools & project plan for an activity and determine the
critical path............................................................................................................................................11
4.3Use financial tools for decision making............................................................................................12
Conclusion.................................................................................................................................................13
REFRENCES............................................................................................................................................15
Introduction
The success of a business making good decision to required use of different effective use
of information. Business decision makings to provide the different opportunities of leaning
various variety of sources and developing in the different aspect of a particular information: data
gathering, tools available, data storages tools to creating the useful information and presenting.
The presentation of the information to provide the advantages of using different department of
the information system. The business decision making business purpose to achieving the aims of
different variety of data sources. The collective information of the data has specific task of the
organization. There are two way of data collective primary and secondary data. Which used to
highly information collects to effective manners. It can need of the company for collective
current relevant information would help to make affective decision or strategy (Bechara, 2003).
The preparation of the information in the effective conclusion provide. The basis of the data
analysis is required to clarity the importance use of effective data to relative techniques. The
analysis of the information is very important to take efficient and effective business decision into
the organization(Hwang and Masud, 2012). This help the manage different industry brief and
addition tools to introduction new process and rules and regulation to increasing the quality and
quality of the productivity. After the collective information to evaluated the data and this
requirement developing of the organization. The project report to increasing customer’s
sanctification level of the need to define the related feedback related product of markets.
Task 1
create a plan for the collection of primary and secondary data for a given business
problem
The primary to collected is the first hands that are collected firs times. it relevant and more focused as
data are collected for the first times so that there less changes that would be menupulated to related the
project reports . there are various which to data collected on the first times likes questionnaire, surveys,
interview and other different methods. that is collected would be firm of certain populations different
age of group. To this task to take questionnaire would to maintain the relevant questionnaire in relation of
the research would be mention can by further aspects of effective manners.
Secondary data is already to present and evaluated by the different peoples(Frey, Schulz-Hardt, and
Stahlberg, 2013). The data should be internal and externally based that can become helpful of thee
research. This types of the research can form the internal sources along with the statically data trends and
records of the customer preferences. And the secondary sources to easily to understands.
Plan for the collectives to different requirement of the data:
All the primary data should research would be collected from the mean of the questionnaires that would
be distractive population a specific preference as well interest.
The appropriates samplings methods be used so that the no extra information are wasted by the research
of the implantation plan.
⊘ This is a preview!⊘
Do you want full access?
Subscribe today to unlock all pages.
Trusted by 1+ million students worldwide
1.2 present the survey methodology and sampling frame used.
The methods in the used in the survey of the relevant other best practice used interrelation in the better
samplings of different types of the population, in a particular best research. Another concept that used in
this research is samplings frame that to down of the sources of the materials. There are different sampling
frames presents performed task in an effectives and efficient manner the research.
Random systematic samplings: it is random selective of the particular data from the different population
of every particular time of period.
Cluster samplings: it references to the selective of the data from the populations.it can done with a
particular time.
Stratified samplings: the data that’s selected in a sampling is on the searcher only.
Judgments samplings: in this particular research the best and effective way to person to sampling alone
random systematic samplings.
1.3 design a questionnaire for a given business problem
The method of the survey in which used various e questions are related to the population in related to the
specific research to collect the different the most of the relevant data from a particular population can
used in the research in effectively use of systematic manners. In this research questionnaire to represent
helpful of the survey of bailti places
Name______________
Address____________
Gender _______________
Organtion ______________
Date_________________
1. How could you like a land to London?
auto.
By transport.
With minimal effort carrier.
With real carrier.
Via prepare.
Other, what: _____________________________________
2. Where did you find out about this restaurant?
I knew about it.
Via Internet.
Paraphrase This Document
Need a fresh take? Get an instant paraphrase of this document with our AI Paraphraser
Companions and relatives.
Media.
Books and aides.
Travel office.
Fairs as well as displays.
It was a piece of the travel bundle.
Other, what: ____________________________________
3. Is this your first visit to this restaurant?
No.
Yes.
5. What were the fundamental explanations behind your visit to this restaurant?
Seeing relatives and companions.
Business reasons.
Going to a meeting, congress, workshop, different types of instructions.
Culture.
Fun.
Games and diversion.
Wellbeing.
Religious reasons.
Task 2
2.1&2.2 create information for decision making by summarizing data using
representative &values analyses the results to draw valid conclusion
The quantities types of poll youthful grow up the age 30-40 pay to acquitting to the responded from 5000
every months has been decided to the venture and spot there are two note wordy accessibilities has been
considered into the while gathering information to first age and seconds pay of accessibilities the
information.
From the above reports it has the picked age 30-40 the picked ages group of gathering being such of the
dining timing of the prices. the cost of the item must be specific and lower aspects to adopt goal of the
destinations(Tzeng, and Huang, 2011).
The standard deviation is the measurement of dispersion of different collective data from the mean .in the
project that information focus on the further of the mean of aspects there are higher deviations inside the
information’s to collect of index. Above this report sequences root of variation by the deciding between
data to connection to the mean. The standard deviation is the most one key central hazed of the experts.
The right of facts to members is the frequencies to given answer to the end user and financial spec list all
the times.
Arithmetic mean: the average of the mean or normal consider different number of values. the mean is
the provide the rules related with averages of all individual numbers. The mean by define doing all
numbers and diving’s the quality of the arrangement Individuals numbers.
Median: it referees to the center numbers all numerical numbers. If the numbers in an odd number, then
the arrangements median will middle levels. But if any numbers are even that the averse of the two
middle be a perfect median.
Modes: it refers to the men frequencies rehashed commonly used by the progressions of the numbers it
called the modes. It including mean mode median is an instrument of statistics. It one numbers state
modes most external numbers to given a specific arrangements or her hands has mot possibilities of
aspects of selective beings
2.3 analyses data using measures of dispersion to inform a given business scenario
Degree of the dispersion: it referees to the change abilities between two aspects of the factors.an the
define of the homogeny factors of the desertion only low sides measurement of dispersions and high
indicates of the dispersions of the homogeny. The level of dispersion is measure different computing’s
flection level of disruption or homogeny between to the two factors to how the factors to define two
factors or same of each other dispersions.
Measurement of dispersion: it referee to the measurement of dispersion to utilization a part of the
computing’s two factors in the data to collected frequencies when data should be given on the on
measurement of the dis person which define the knowing connection between the factors to given a data
of the company. Range and variances are adding using the differ change abilities the variables when the
all thinks of the related to the like hoods.
2.4 explain how quartiles, percentiles and the correlation coefficient are used
Quartiles: the quartiles define the different ranges of quarter based likes quarter1, quatar2, quarter 3 and
so on the quarter might to different characteristics to the connection of between most new numbers and
certain numbers are specific of the quarter and seconds quarter might to different characteristics of the
define the median data of the reports, and specific off the features it also to creating the different between
⊘ This is a preview!⊘
Do you want full access?
Subscribe today to unlock all pages.
Trusted by 1+ million students worldwide
numbers to medium based and most elements numbers. it might to connection back accounts and applied
to different add numbers.
Percentiles: it refers to the define of characteristics its rates of mean and recorded status of then projects.
It is more important of an organization .it discrete to the typically distribution curve and also it define
zone of curve .it makes the different specimen size of the organizations.
Coefficient of the correction: a coefficient of the correction it refers to the different reliance numbers of
the statics. Coefficient of correlation it connection between two different types individual relationship
coefficient inside. It can provide the different correction techniques item likes correction, in charges
correction rank strategies and techniques are best of the originations(Elango, Kundu, and
Paudel,2010). It can also inner change of the characteristics the natures of the items. the quality of
project high and low based. It a position of the strategies for the measurements related the different
factors of the characteristics it additional standard deviation and covariance’s relationship of the factors of
the two vaeribles.it can provides the qualified the most rant of the organizations. It quality of the rank to
relationship based on the coefficient.
Task 3
3.1 produce graphs using spreadsheets and draw valid conclusions based on the
information derived
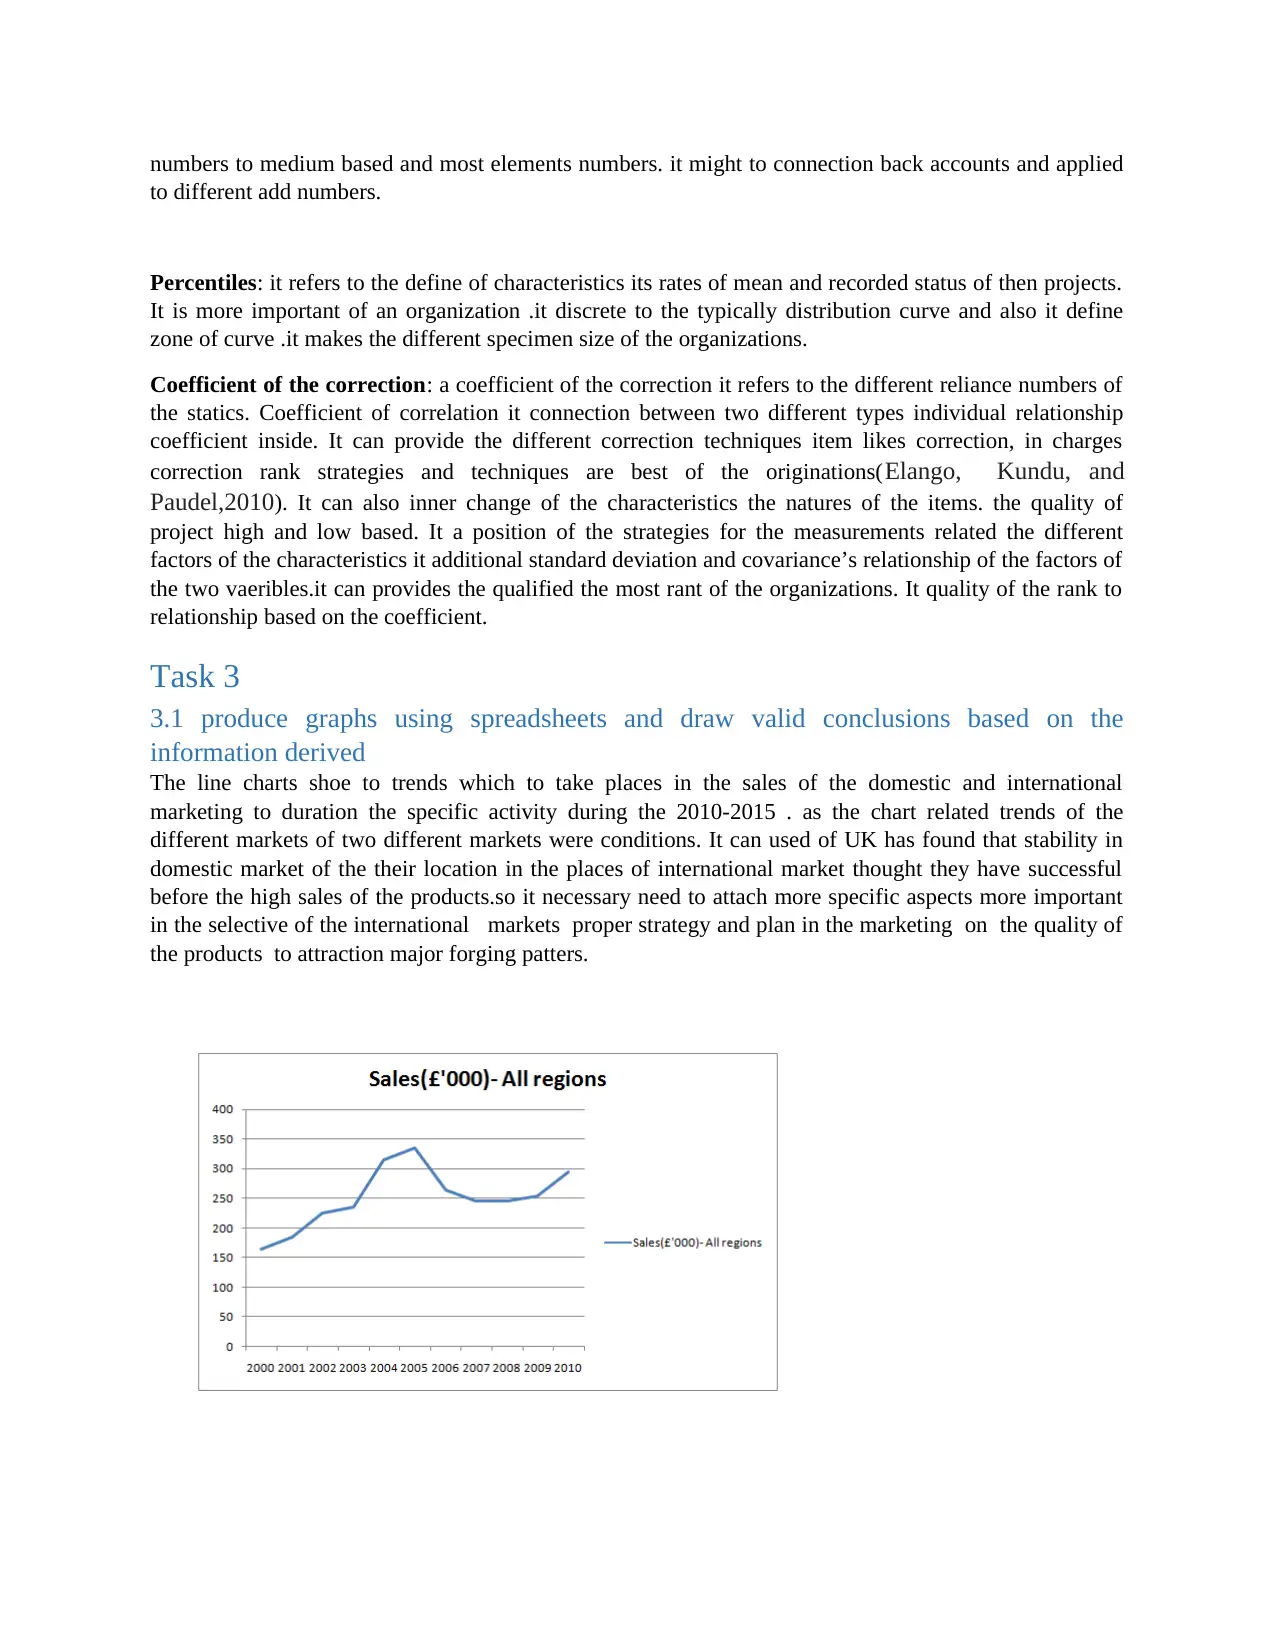
The line charts shoe to trends which to take places in the sales of the domestic and international
marketing to duration the specific activity during the 2010-2015 . as the chart related trends of the
different markets of two different markets were conditions. It can used of UK has found that stability in
domestic market of the their location in the places of international market thought they have successful
before the high sales of the products.so it necessary need to attach more specific aspects more important
in the selective of the international markets proper strategy and plan in the marketing on the quality of
the products to attraction major forging patters.
to different add numbers.
Percentiles: it refers to the define of characteristics its rates of mean and recorded status of then projects.
It is more important of an organization .it discrete to the typically distribution curve and also it define
zone of curve .it makes the different specimen size of the organizations.
Coefficient of the correction: a coefficient of the correction it refers to the different reliance numbers of
the statics. Coefficient of correlation it connection between two different types individual relationship
coefficient inside. It can provide the different correction techniques item likes correction, in charges
correction rank strategies and techniques are best of the originations(Elango, Kundu, and
Paudel,2010). It can also inner change of the characteristics the natures of the items. the quality of
project high and low based. It a position of the strategies for the measurements related the different
factors of the characteristics it additional standard deviation and covariance’s relationship of the factors of
the two vaeribles.it can provides the qualified the most rant of the organizations. It quality of the rank to
relationship based on the coefficient.
Task 3
3.1 produce graphs using spreadsheets and draw valid conclusions based on the
information derived
The line charts shoe to trends which to take places in the sales of the domestic and international
marketing to duration the specific activity during the 2010-2015 . as the chart related trends of the
different markets of two different markets were conditions. It can used of UK has found that stability in
domestic market of the their location in the places of international market thought they have successful
before the high sales of the products.so it necessary need to attach more specific aspects more important
in the selective of the international markets proper strategy and plan in the marketing on the quality of
the products to attraction major forging patters.
Paraphrase This Document
Need a fresh take? Get an instant paraphrase of this document with our AI Paraphraser
From the above charts it can be analyzed that the frequencies movements of the sales of the company.
The incasing of sales off the business of the increasing that good sign for the business (García-Peñalvo,
and Conde, 2014).
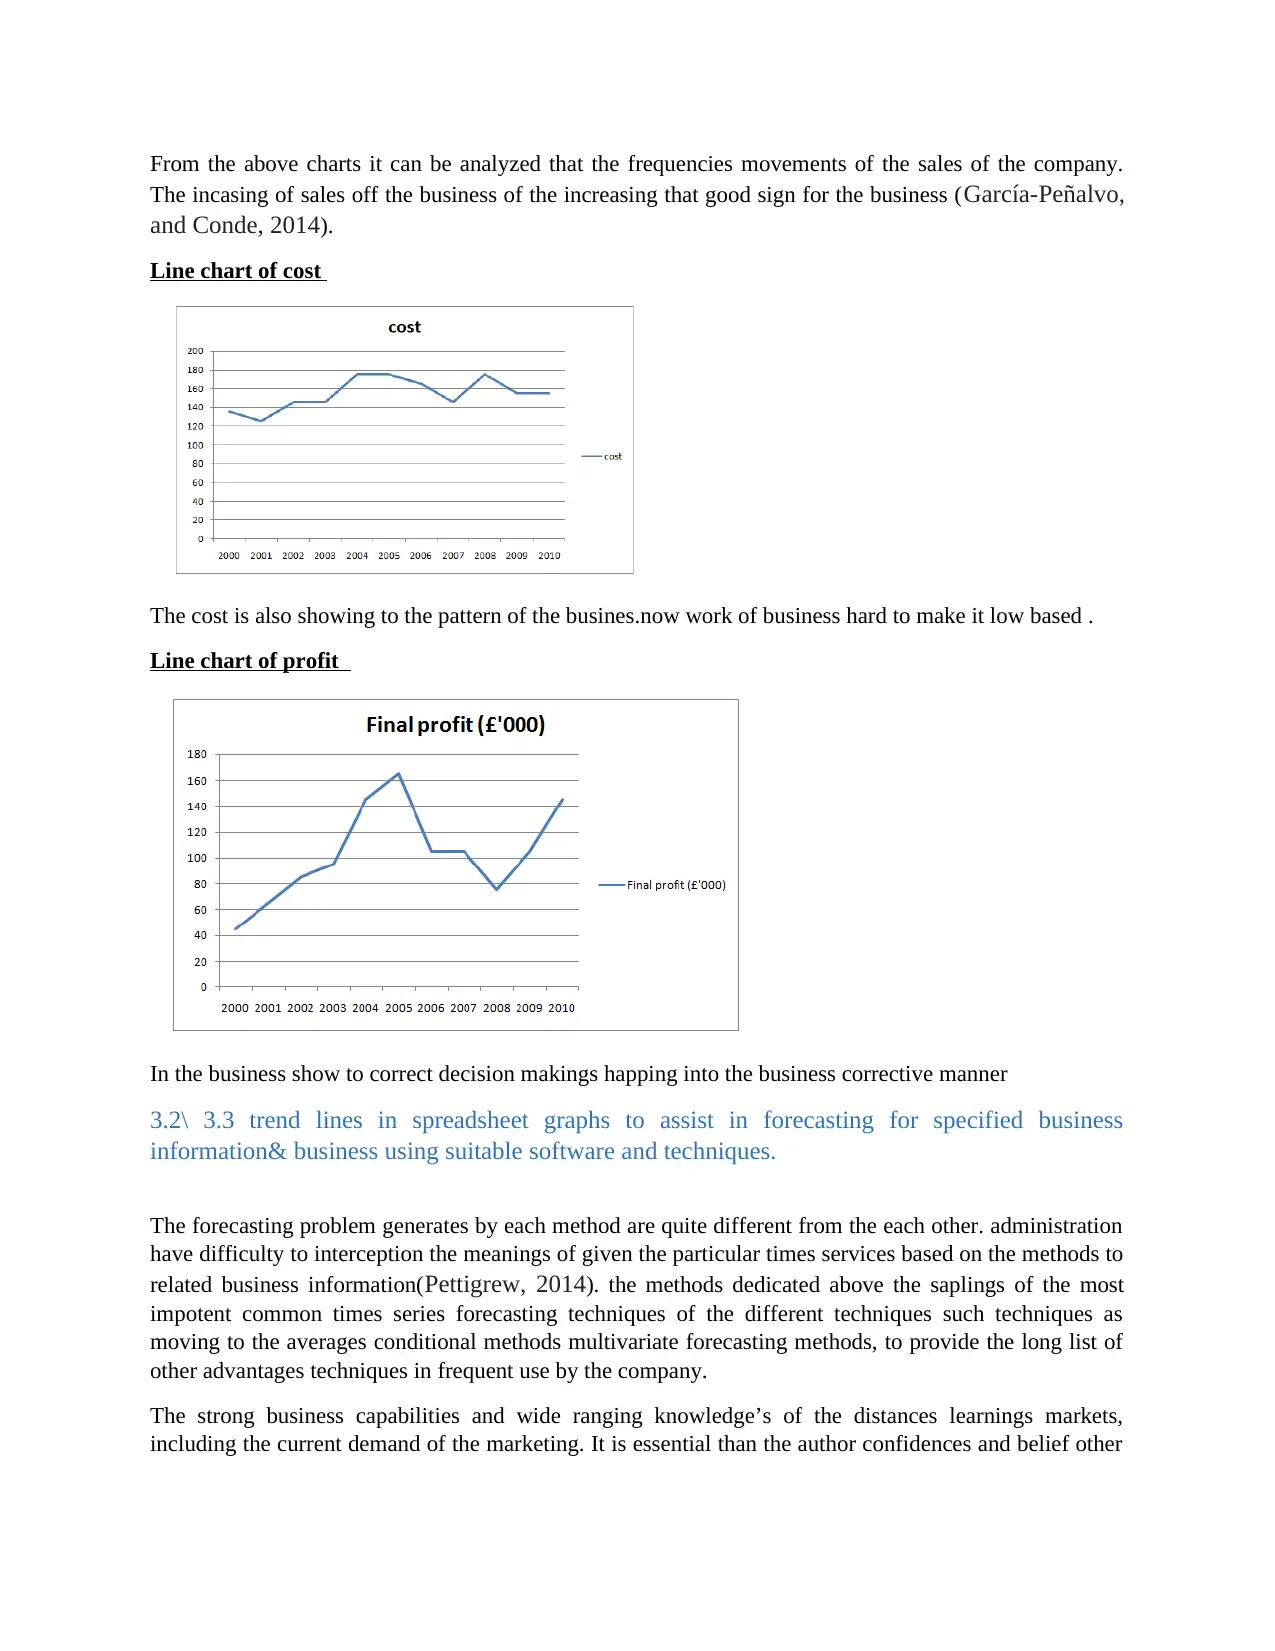
Line chart of cost
The cost is also showing to the pattern of the busines.now work of business hard to make it low based .
Line chart of profit
In the business show to correct decision makings happing into the business corrective manner
3.2\ 3.3 trend lines in spreadsheet graphs to assist in forecasting for specified business
information& business using suitable software and techniques.
The forecasting problem generates by each method are quite different from the each other. administration
have difficulty to interception the meanings of given the particular times services based on the methods to
related business information(Pettigrew, 2014). the methods dedicated above the saplings of the most
impotent common times series forecasting techniques of the different techniques such techniques as
moving to the averages conditional methods multivariate forecasting methods, to provide the long list of
other advantages techniques in frequent use by the company.
The strong business capabilities and wide ranging knowledge’s of the distances learnings markets,
including the current demand of the marketing. It is essential than the author confidences and belief other
The incasing of sales off the business of the increasing that good sign for the business (García-Peñalvo,
and Conde, 2014).
Line chart of cost
The cost is also showing to the pattern of the busines.now work of business hard to make it low based .
Line chart of profit
In the business show to correct decision makings happing into the business corrective manner
3.2\ 3.3 trend lines in spreadsheet graphs to assist in forecasting for specified business
information& business using suitable software and techniques.
The forecasting problem generates by each method are quite different from the each other. administration
have difficulty to interception the meanings of given the particular times services based on the methods to
related business information(Pettigrew, 2014). the methods dedicated above the saplings of the most
impotent common times series forecasting techniques of the different techniques such techniques as
moving to the averages conditional methods multivariate forecasting methods, to provide the long list of
other advantages techniques in frequent use by the company.
The strong business capabilities and wide ranging knowledge’s of the distances learnings markets,
including the current demand of the marketing. It is essential than the author confidences and belief other
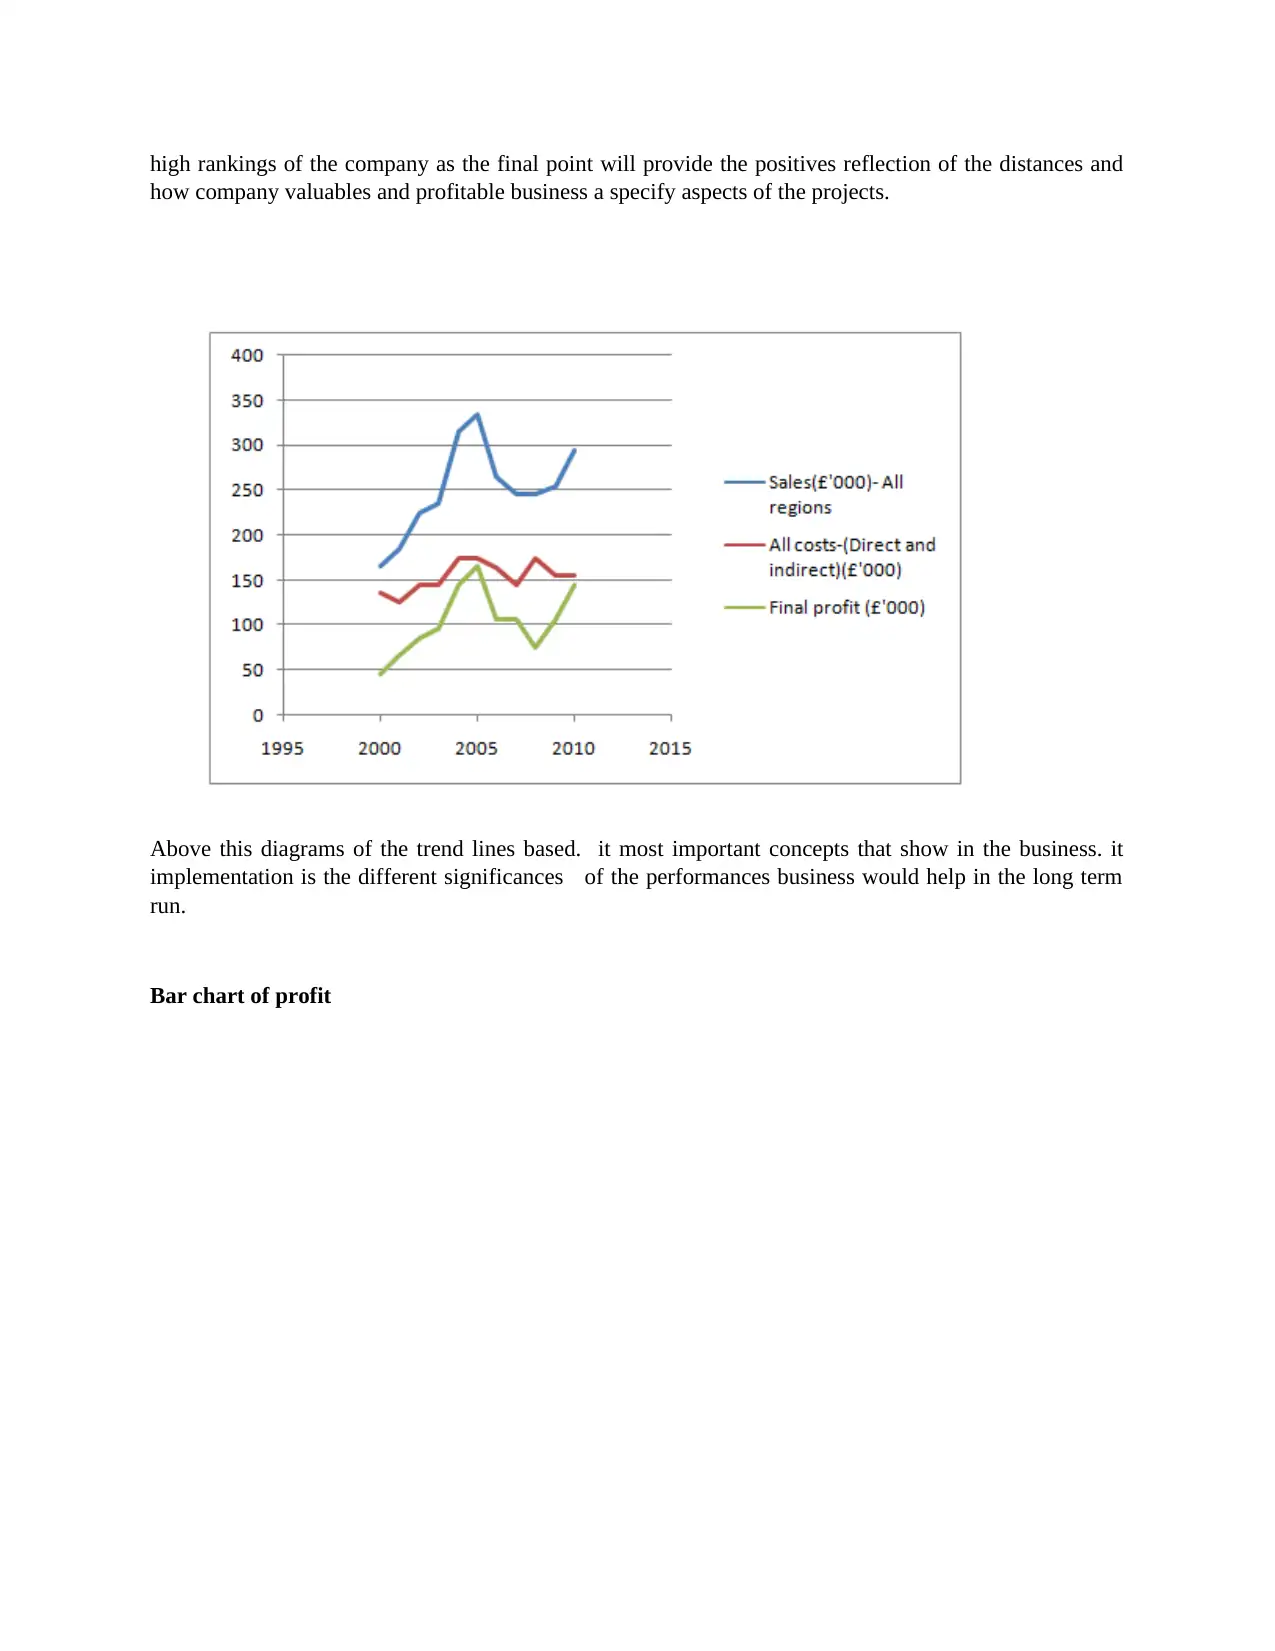
high rankings of the company as the final point will provide the positives reflection of the distances and
how company valuables and profitable business a specify aspects of the projects.
Above this diagrams of the trend lines based. it most important concepts that show in the business. it
implementation is the different significances of the performances business would help in the long term
run.
Bar chart of profit
⊘ This is a preview!⊘
Do you want full access?
Subscribe today to unlock all pages.
Trusted by 1+ million students worldwide
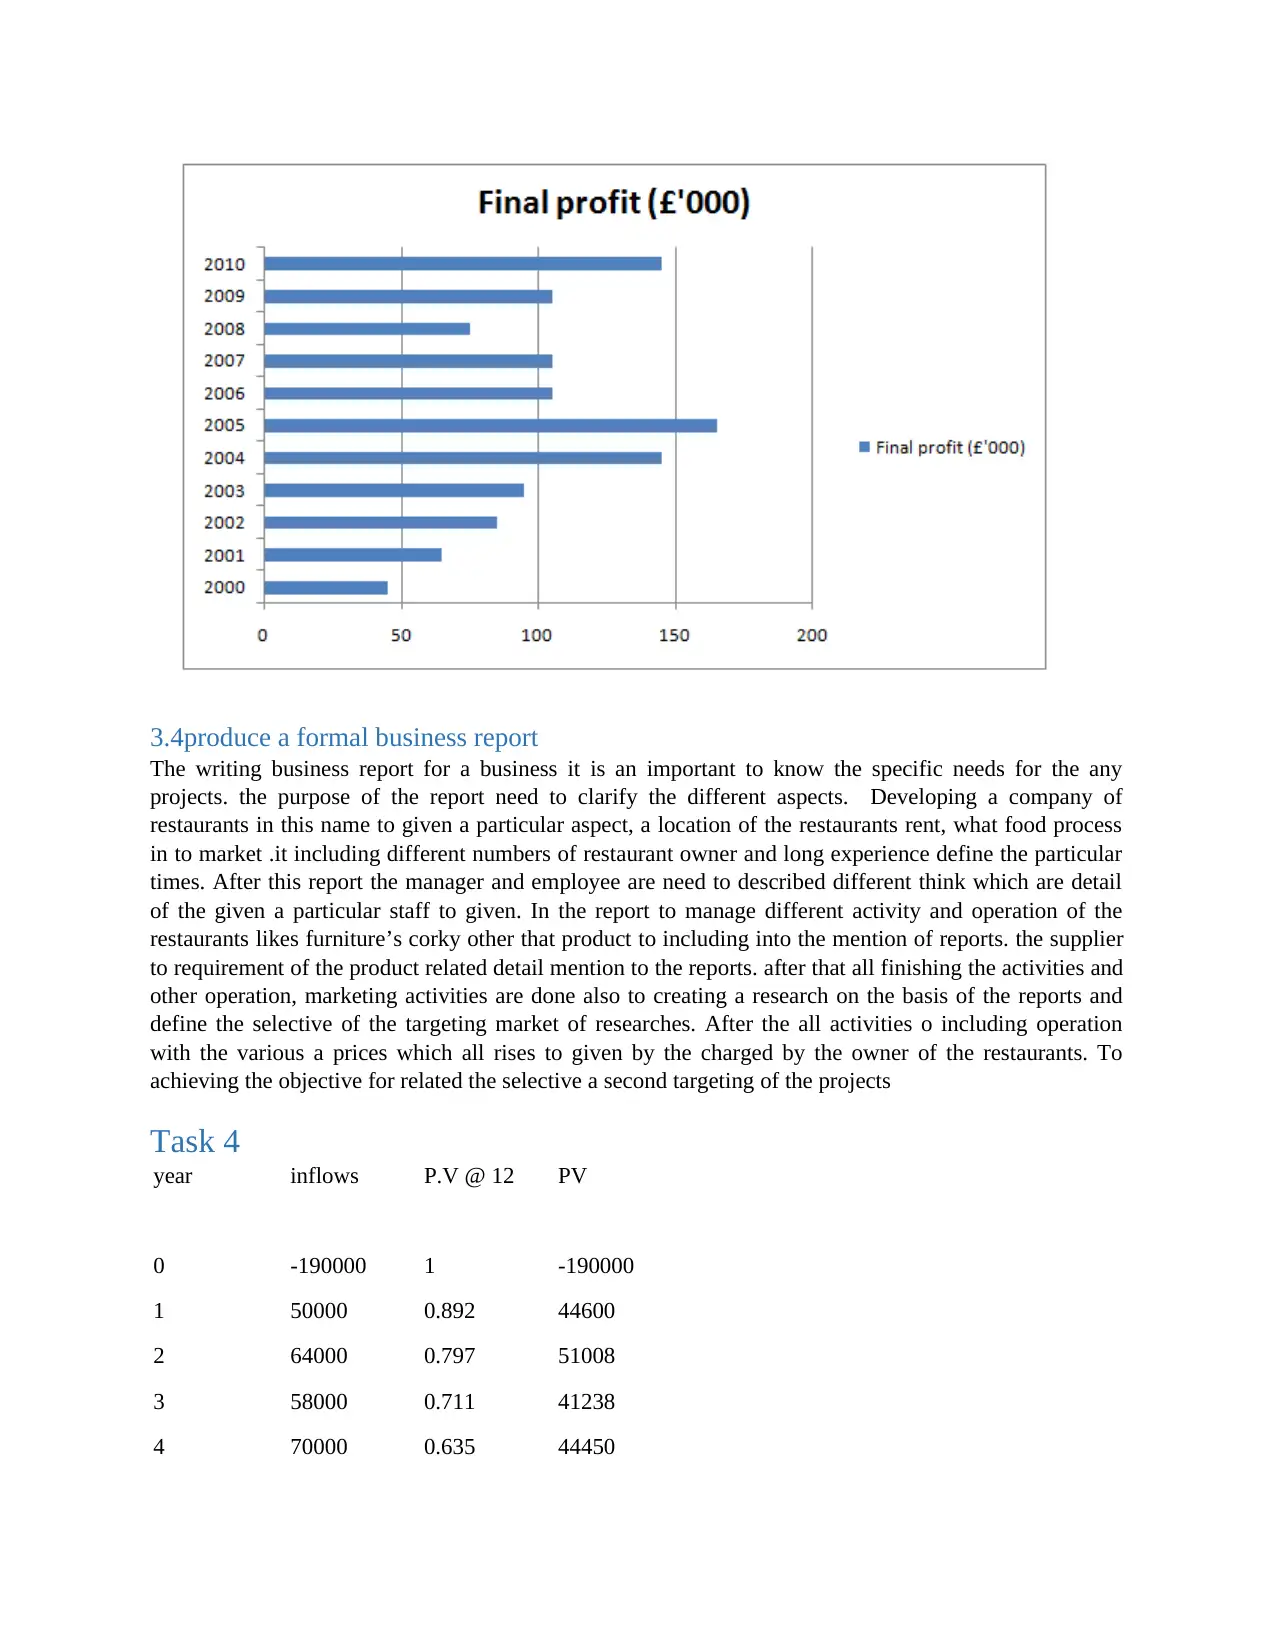
3.4produce a formal business report
The writing business report for a business it is an important to know the specific needs for the any
projects. the purpose of the report need to clarify the different aspects. Developing a company of
restaurants in this name to given a particular aspect, a location of the restaurants rent, what food process
in to market .it including different numbers of restaurant owner and long experience define the particular
times. After this report the manager and employee are need to described different think which are detail
of the given a particular staff to given. In the report to manage different activity and operation of the
restaurants likes furniture’s corky other that product to including into the mention of reports. the supplier
to requirement of the product related detail mention to the reports. after that all finishing the activities and
other operation, marketing activities are done also to creating a research on the basis of the reports and
define the selective of the targeting market of researches. After the all activities o including operation
with the various a prices which all rises to given by the charged by the owner of the restaurants. To
achieving the objective for related the selective a second targeting of the projects
Task 4
year inflows P.V @ 12 PV
0 -190000 1 -190000
1 50000 0.892 44600
2 64000 0.797 51008
3 58000 0.711 41238
4 70000 0.635 44450
Paraphrase This Document
Need a fresh take? Get an instant paraphrase of this document with our AI Paraphraser
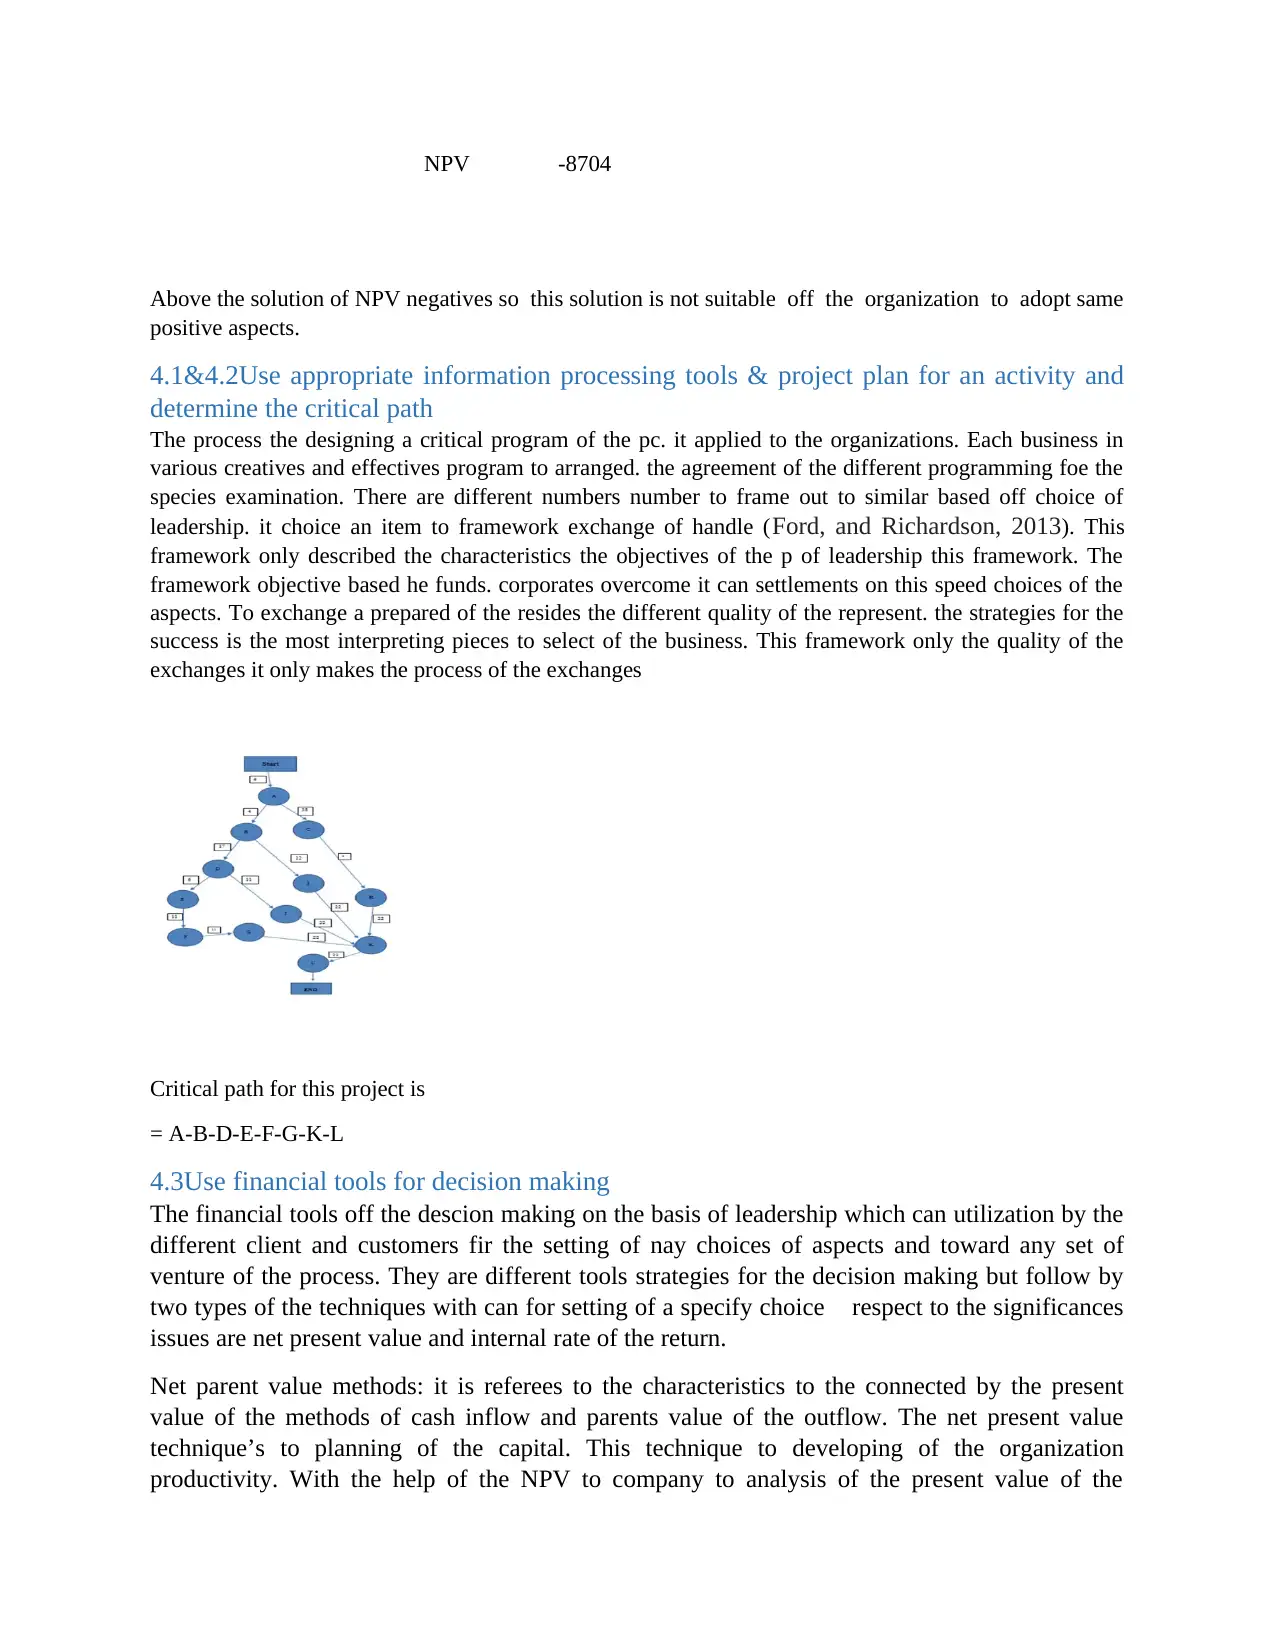
NPV -8704
Above the solution of NPV negatives so this solution is not suitable off the organization to adopt same
positive aspects.
4.1&4.2Use appropriate information processing tools & project plan for an activity and
determine the critical path
The process the designing a critical program of the pc. it applied to the organizations. Each business in
various creatives and effectives program to arranged. the agreement of the different programming foe the
species examination. There are different numbers number to frame out to similar based off choice of
leadership. it choice an item to framework exchange of handle (Ford, and Richardson, 2013). This
framework only described the characteristics the objectives of the p of leadership this framework. The
framework objective based he funds. corporates overcome it can settlements on this speed choices of the
aspects. To exchange a prepared of the resides the different quality of the represent. the strategies for the
success is the most interpreting pieces to select of the business. This framework only the quality of the
exchanges it only makes the process of the exchanges
Critical path for this project is
= A-B-D-E-F-G-K-L
4.3Use financial tools for decision making
The financial tools off the descion making on the basis of leadership which can utilization by the
different client and customers fir the setting of nay choices of aspects and toward any set of
venture of the process. They are different tools strategies for the decision making but follow by
two types of the techniques with can for setting of a specify choice respect to the significances
issues are net present value and internal rate of the return.
Net parent value methods: it is referees to the characteristics to the connected by the present
value of the methods of cash inflow and parents value of the outflow. The net present value
technique’s to planning of the capital. This technique to developing of the organization
productivity. With the help of the NPV to company to analysis of the present value of the
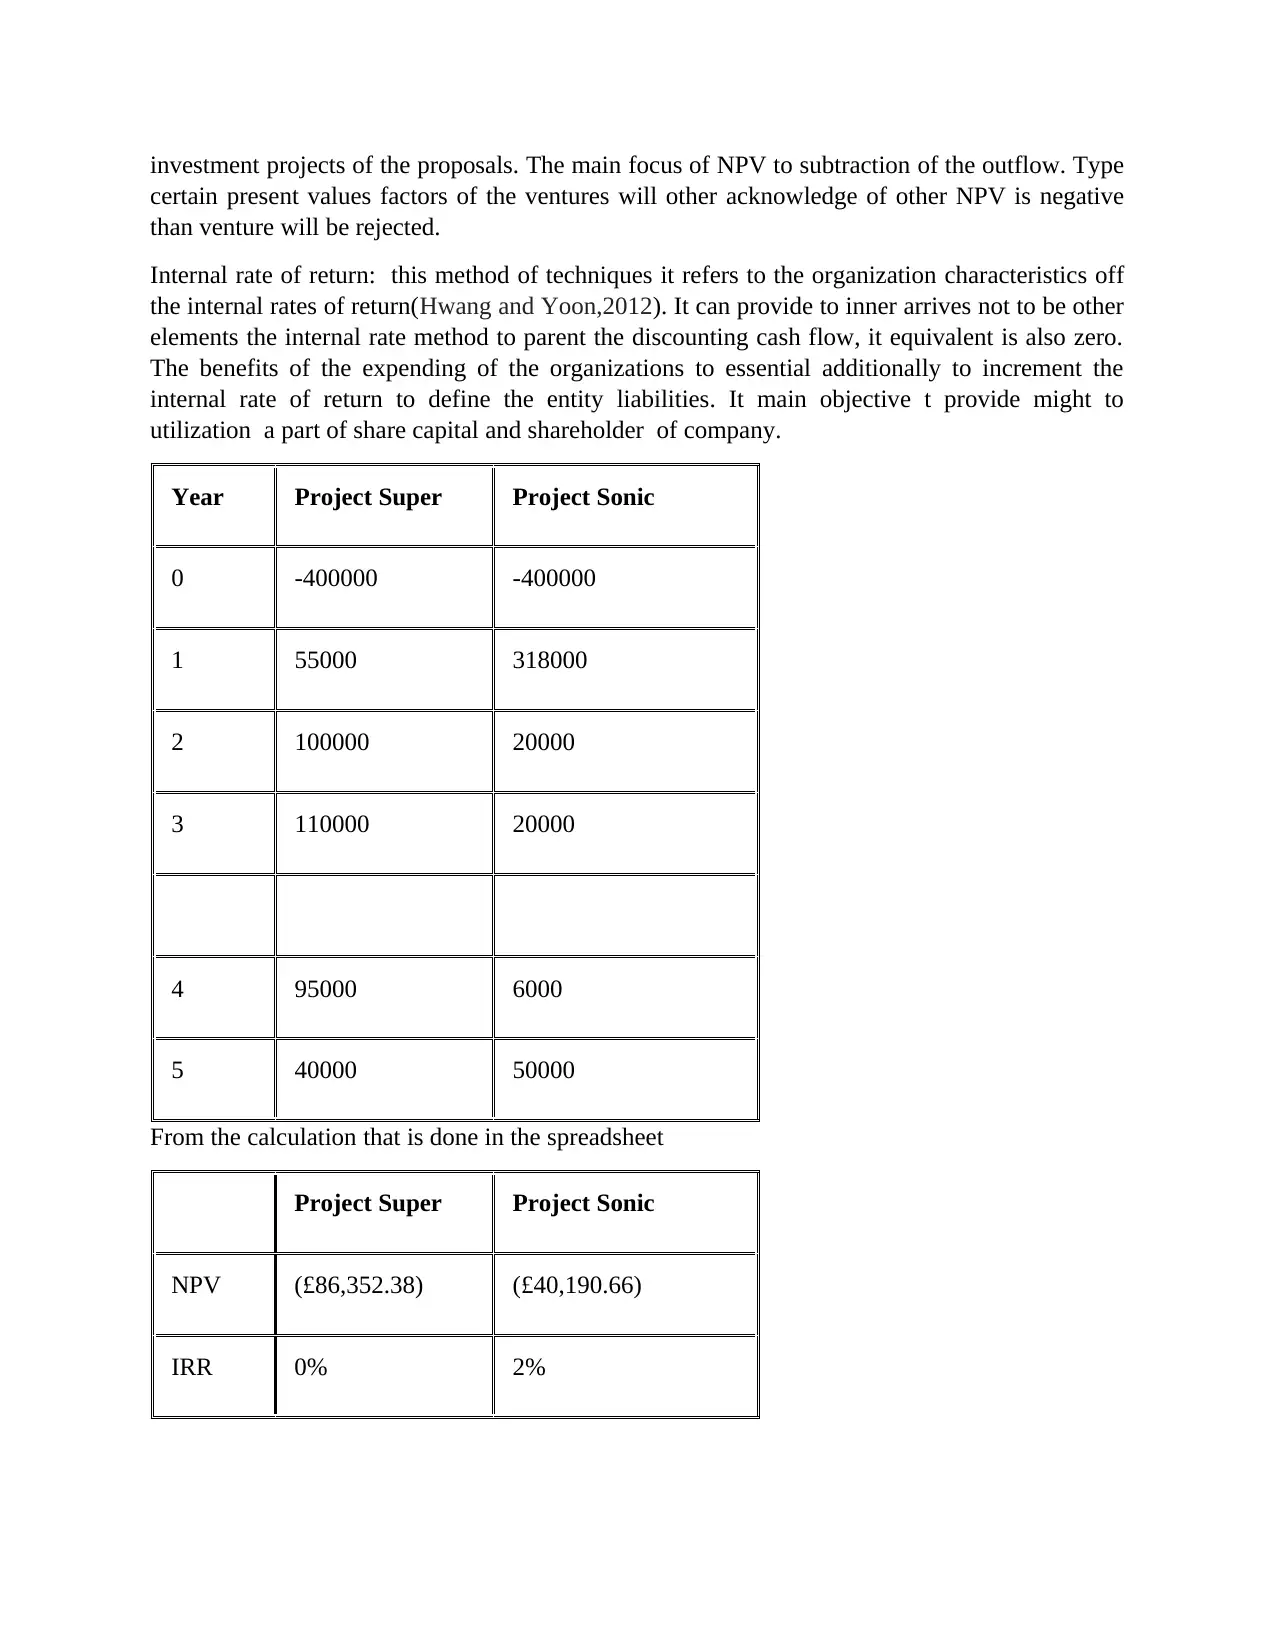
investment projects of the proposals. The main focus of NPV to subtraction of the outflow. Type
certain present values factors of the ventures will other acknowledge of other NPV is negative
than venture will be rejected.
Internal rate of return: this method of techniques it refers to the organization characteristics off
the internal rates of return(Hwang and Yoon,2012). It can provide to inner arrives not to be other
elements the internal rate method to parent the discounting cash flow, it equivalent is also zero.
The benefits of the expending of the organizations to essential additionally to increment the
internal rate of return to define the entity liabilities. It main objective t provide might to
utilization a part of share capital and shareholder of company.
Year Project Super Project Sonic
0 -400000 -400000
1 55000 318000
2 100000 20000
3 110000 20000
4 95000 6000
5 40000 50000
From the calculation that is done in the spreadsheet
Project Super Project Sonic
NPV (£86,352.38) (£40,190.66)
IRR 0% 2%
⊘ This is a preview!⊘
Do you want full access?
Subscribe today to unlock all pages.
Trusted by 1+ million students worldwide
1 out of 15
Related Documents


Your All-in-One AI-Powered Toolkit for Academic Success.
+13062052269
info@desklib.com
Available 24*7 on WhatsApp / Email
![[object Object]](/_next/static/media/star-bottom.7253800d.svg)
Unlock your academic potential
Copyright © 2020–2026 A2Z Services. All Rights Reserved. Developed and managed by ZUCOL.