Business Pitch Report: Idea Selection, Financials, and Feasibility
VerifiedAdded on 2023/01/20
|10
|700
|89
Report
AI Summary
This report presents a detailed business plan for a brick-and-click venture, addressing the problem of customer satisfaction with online purchases by offering both online and physical store experiences. The report includes a comprehensive business model, focusing on financial feasibility with key ratios and break-even analysis, and operational feasibility, scalability, and investor attraction. It analyzes cash flow projections under best, average, and worst-case scenarios, providing a strong foundation for a compelling business pitch. The report also includes references to relevant academic research and industry publications to support the proposed business model and analysis, demonstrating a thorough understanding of the business environment and the potential for success.
IDEA SELECTION AND
BUSINESS PITCH
BUSINESS PITCH
Paraphrase This Document
Need a fresh take? Get an instant paraphrase of this document with our AI Paraphraser
Proposed Venture Idea and
Underlying business model
• The proposed venture idea is offering sales using both
online and stores to customers so as to promote maximum
satisfaction.
• The proposed business model for the company is brick-
and-click.
Underlying business model
• The proposed venture idea is offering sales using both
online and stores to customers so as to promote maximum
satisfaction.
• The proposed business model for the company is brick-
and-click.
Problem solved
• customers have always found it difficult to have a physical
view of the commodities they are buying through using
online platforms so as to obtain maximum satisfaction.
• customers have always found it difficult to have a physical
view of the commodities they are buying through using
online platforms so as to obtain maximum satisfaction.
⊘ This is a preview!⊘
Do you want full access?
Subscribe today to unlock all pages.
Trusted by 1+ million students worldwide
Monetization of the idea
• The implementation of the idea would be more expensive
than the former.
• The idea would generate more revenue than the former
business idea implemented.
• Customers would be satisfied with the offered services.
• The idea would be monetized through thorough
computations of all the costs and profits involved using it.
Paraphrase This Document
Need a fresh take? Get an instant paraphrase of this document with our AI Paraphraser
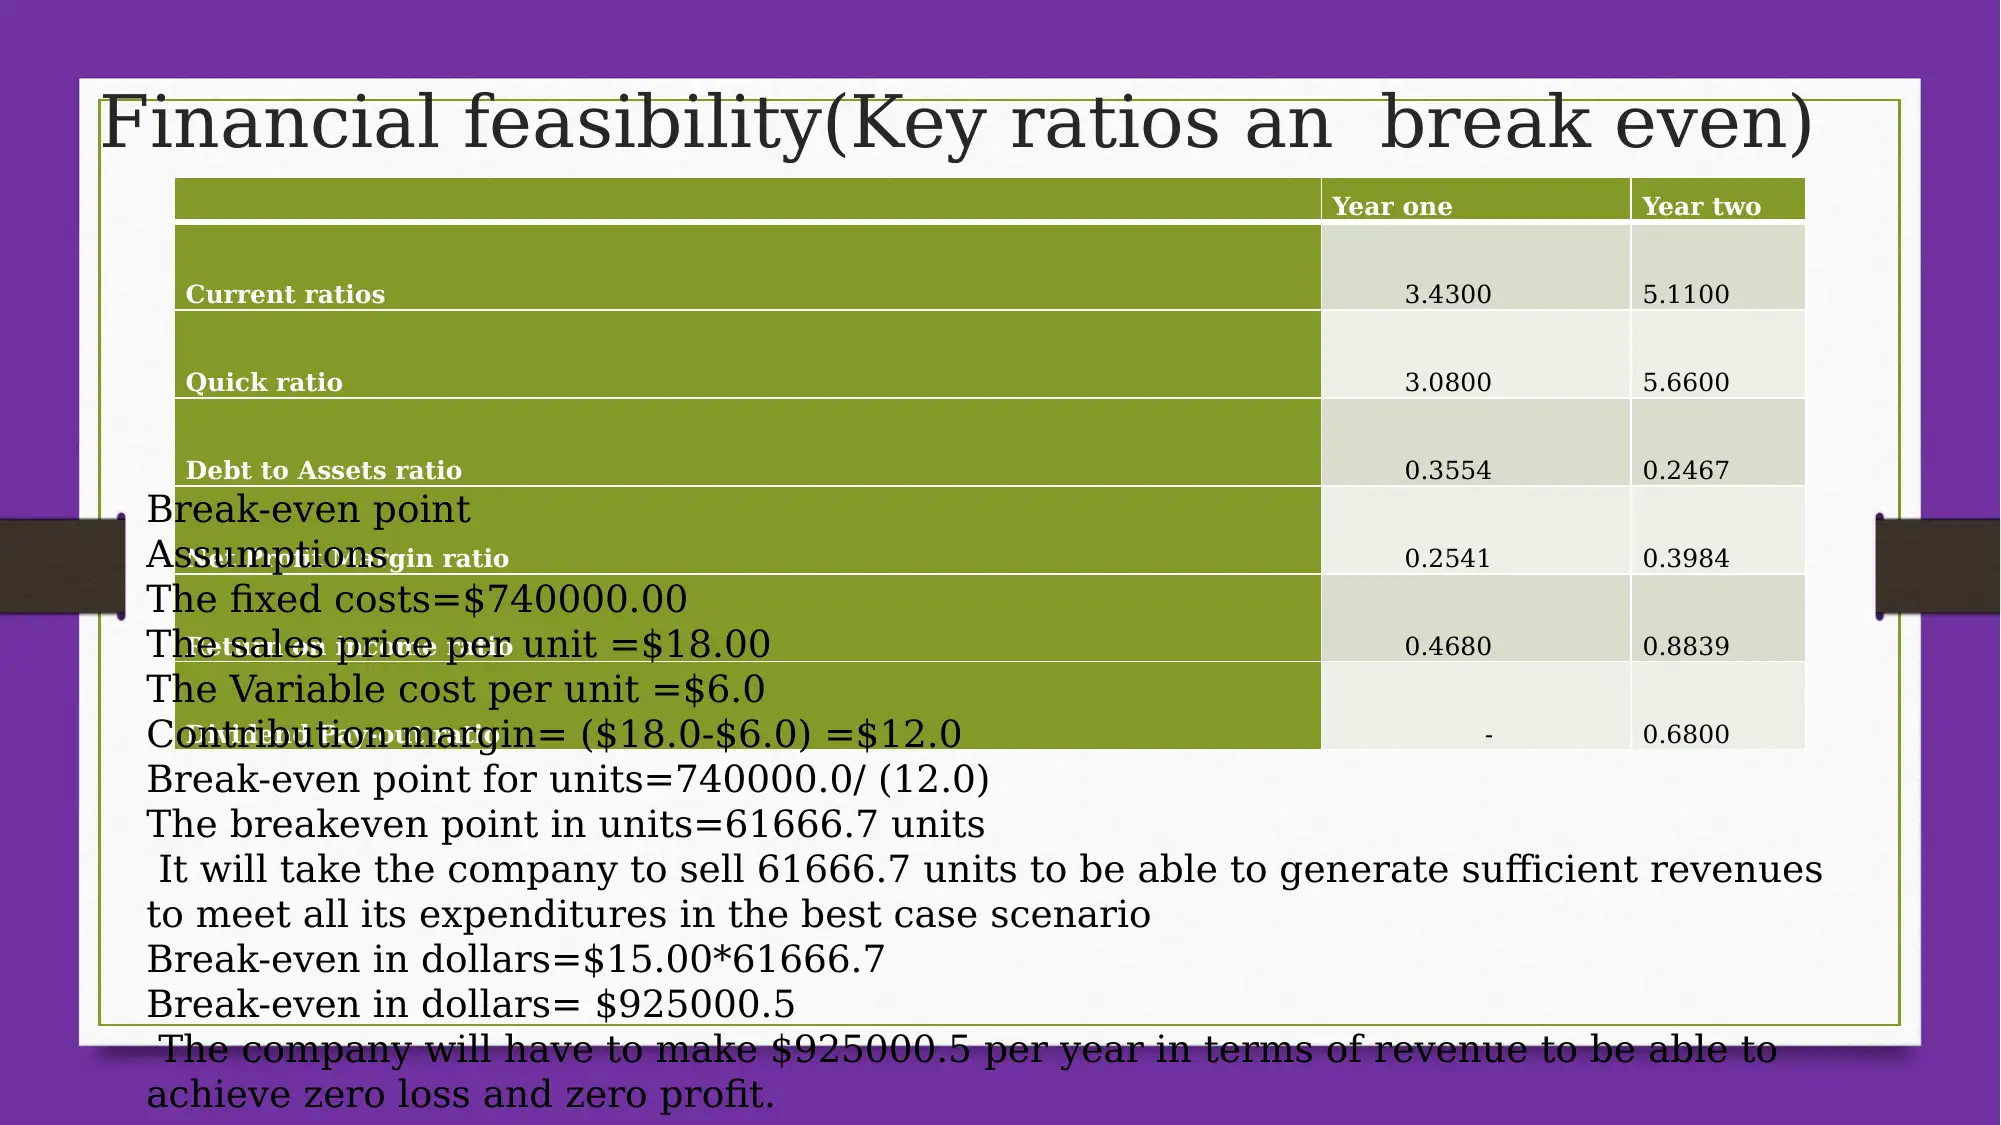
Financial feasibility(Key ratios an break even)
Year one Year two
Current ratios 3.4300 5.1100
Quick ratio 3.0800 5.6600
Debt to Assets ratio 0.3554 0.2467
Net Profit Margin ratio 0.2541 0.3984
Return on income ratio 0.4680 0.8839
Dividend Pay-out ratio - 0.6800
Break-even point
Assumptions
The fixed costs=$740000.00
The sales price per unit =$18.00
The Variable cost per unit =$6.0
Contribution margin= ($18.0-$6.0) =$12.0
Break-even point for units=740000.0/ (12.0)
The breakeven point in units=61666.7 units
It will take the company to sell 61666.7 units to be able to generate sufficient revenues
to meet all its expenditures in the best case scenario
Break-even in dollars=$15.00*61666.7
Break-even in dollars= $925000.5
The company will have to make $925000.5 per year in terms of revenue to be able to
achieve zero loss and zero profit.
Operational feasibility, scope, as well as
scalability of idea as used for commercialization.
• considering operation feasibility, the company has
obtained trust from the customers and more customers
have gained interest towards services provided by the
organization
• Scope, the idea only applies to customers located in areas
where there are physical offices and stores; there would
be great expenditures for customers outside those areas.
• Considering scalability of the idea, the idea is measure
and attainable.
⊘ This is a preview!⊘
Do you want full access?
Subscribe today to unlock all pages.
Trusted by 1+ million students worldwide
Involving Investors
• Investors are willing to invest their money in the idea
because, the idea is viable and profit generating
• So as to attract more investors and generate more profits,
the idea would be established in the organization as early
as possible. Stores would be established in places were
there are potentially easy to access customers
• There are endless profits to investors both long-term and
short-term investors.
Paraphrase This Document
Need a fresh take? Get an instant paraphrase of this document with our AI Paraphraser
what the idea offers in return
• The idea benefits the organization
• The idea also benefits customers
• The idea benefits Investors
• The idea benefits the organization
• The idea also benefits customers
• The idea benefits Investors
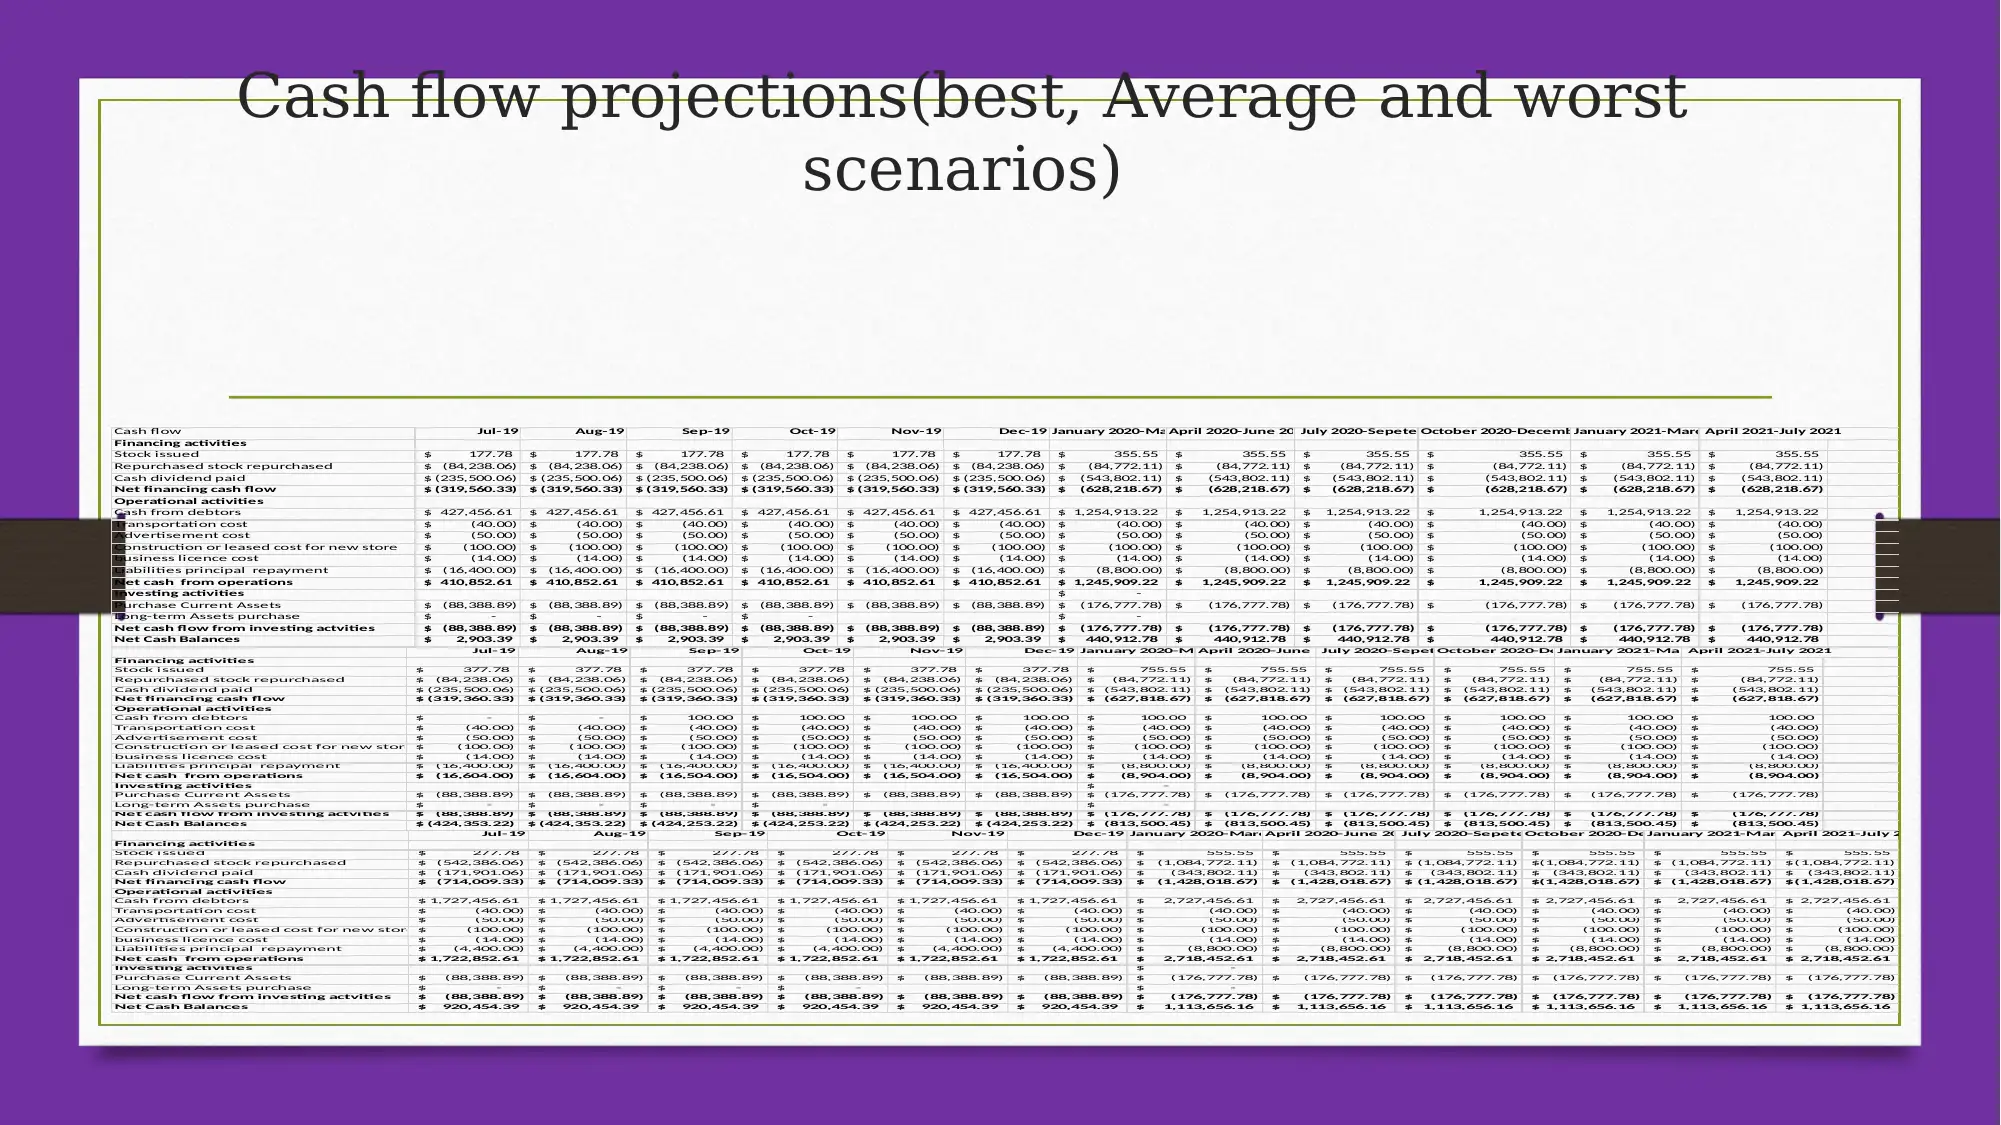
Cash flow projections(best, Average and worst
scenarios)
Jul-19 Aug-19 Sep-19 Oct-19 Nov-19 Dec-19 January 2020-March 2020April 2020-June 2020July 2020-Sepetember 2020October 2020-December 2020January 2021-March 2021April 2021-July 2021
Financing activities
Stock issued 277.78$ 277.78$ 277.78$ 277.78$ 277.78$ 277.78$ 555.55$ 555.55$ 555.55$ 555.55$ 555.55$ 555.55$
Repurchased stock repurchased (542,386.06)$ (542,386.06)$ (542,386.06)$ (542,386.06)$ (542,386.06)$ (542,386.06)$ (1,084,772.11)$ (1,084,772.11)$ (1,084,772.11)$ (1,084,772.11)$ (1,084,772.11)$ (1,084,772.11)$
Cash dividend paid (171,901.06)$ (171,901.06)$ (171,901.06)$ (171,901.06)$ (171,901.06)$ (171,901.06)$ (343,802.11)$ (343,802.11)$ (343,802.11)$ (343,802.11)$ (343,802.11)$ (343,802.11)$
Net financing cash flow (714,009.33)$ (714,009.33)$ (714,009.33)$ (714,009.33)$ (714,009.33)$ (714,009.33)$ (1,428,018.67)$ (1,428,018.67)$ (1,428,018.67)$ (1,428,018.67)$ (1,428,018.67)$ (1,428,018.67)$
Operational activities
Cash from debtors 1,727,456.61$ 1,727,456.61$ 1,727,456.61$ 1,727,456.61$ 1,727,456.61$ 1,727,456.61$ 2,727,456.61$ 2,727,456.61$ 2,727,456.61$ 2,727,456.61$ 2,727,456.61$ 2,727,456.61$
Transportation cost (40.00)$ (40.00)$ (40.00)$ (40.00)$ (40.00)$ (40.00)$ (40.00)$ (40.00)$ (40.00)$ (40.00)$ (40.00)$ (40.00)$
Advertisement cost (50.00)$ (50.00)$ (50.00)$ (50.00)$ (50.00)$ (50.00)$ (50.00)$ (50.00)$ (50.00)$ (50.00)$ (50.00)$ (50.00)$
Construction or leased cost for new store (100.00)$ (100.00)$ (100.00)$ (100.00)$ (100.00)$ (100.00)$ (100.00)$ (100.00)$ (100.00)$ (100.00)$ (100.00)$ (100.00)$
business licence cost (14.00)$ (14.00)$ (14.00)$ (14.00)$ (14.00)$ (14.00)$ (14.00)$ (14.00)$ (14.00)$ (14.00)$ (14.00)$ (14.00)$
Liabilities principal repayment (4,400.00)$ (4,400.00)$ (4,400.00)$ (4,400.00)$ (4,400.00)$ (4,400.00)$ (8,800.00)$ (8,800.00)$ (8,800.00)$ (8,800.00)$ (8,800.00)$ (8,800.00)$
Net cash from operations 1,722,852.61$ 1,722,852.61$ 1,722,852.61$ 1,722,852.61$ 1,722,852.61$ 1,722,852.61$ 2,718,452.61$ 2,718,452.61$ 2,718,452.61$ 2,718,452.61$ 2,718,452.61$ 2,718,452.61$
Investing activities -$
Purchase Current Assets (88,388.89)$ (88,388.89)$ (88,388.89)$ (88,388.89)$ (88,388.89)$ (88,388.89)$ (176,777.78)$ (176,777.78)$ (176,777.78)$ (176,777.78)$ (176,777.78)$ (176,777.78)$
Long-term Assets purchase -$ -$ -$ -$ -$
Net cash flow from investing actvities (88,388.89)$ (88,388.89)$ (88,388.89)$ (88,388.89)$ (88,388.89)$ (88,388.89)$ (176,777.78)$ (176,777.78)$ (176,777.78)$ (176,777.78)$ (176,777.78)$ (176,777.78)$
Net Cash Balances 920,454.39$ 920,454.39$ 920,454.39$ 920,454.39$ 920,454.39$ 920,454.39$ 1,113,656.16$ 1,113,656.16$ 1,113,656.16$ 1,113,656.16$ 1,113,656.16$ 1,113,656.16$
Cash flow Jul-19 Aug-19 Sep-19 Oct-19 Nov-19 Dec-19 January 2020-March 2020April 2020-June 2020July 2020-Sepetember 2020October 2020-December 2020January 2021-March 2021April 2021-July 2021
Financing activities
Stock issued 177.78$ 177.78$ 177.78$ 177.78$ 177.78$ 177.78$ 355.55$ 355.55$ 355.55$ 355.55$ 355.55$ 355.55$
Repurchased stock repurchased (84,238.06)$ (84,238.06)$ (84,238.06)$ (84,238.06)$ (84,238.06)$ (84,238.06)$ (84,772.11)$ (84,772.11)$ (84,772.11)$ (84,772.11)$ (84,772.11)$ (84,772.11)$
Cash dividend paid (235,500.06)$ (235,500.06)$ (235,500.06)$ (235,500.06)$ (235,500.06)$ (235,500.06)$ (543,802.11)$ (543,802.11)$ (543,802.11)$ (543,802.11)$ (543,802.11)$ (543,802.11)$
Net financing cash flow (319,560.33)$ (319,560.33)$ (319,560.33)$ (319,560.33)$ (319,560.33)$ (319,560.33)$ (628,218.67)$ (628,218.67)$ (628,218.67)$ (628,218.67)$ (628,218.67)$ (628,218.67)$
Operational activities
Cash from debtors 427,456.61$ 427,456.61$ 427,456.61$ 427,456.61$ 427,456.61$ 427,456.61$ 1,254,913.22$ 1,254,913.22$ 1,254,913.22$ 1,254,913.22$ 1,254,913.22$ 1,254,913.22$
Transportation cost (40.00)$ (40.00)$ (40.00)$ (40.00)$ (40.00)$ (40.00)$ (40.00)$ (40.00)$ (40.00)$ (40.00)$ (40.00)$ (40.00)$
Advertisement cost (50.00)$ (50.00)$ (50.00)$ (50.00)$ (50.00)$ (50.00)$ (50.00)$ (50.00)$ (50.00)$ (50.00)$ (50.00)$ (50.00)$
Construction or leased cost for new store (100.00)$ (100.00)$ (100.00)$ (100.00)$ (100.00)$ (100.00)$ (100.00)$ (100.00)$ (100.00)$ (100.00)$ (100.00)$ (100.00)$
business licence cost (14.00)$ (14.00)$ (14.00)$ (14.00)$ (14.00)$ (14.00)$ (14.00)$ (14.00)$ (14.00)$ (14.00)$ (14.00)$ (14.00)$
Liabilities principal repayment (16,400.00)$ (16,400.00)$ (16,400.00)$ (16,400.00)$ (16,400.00)$ (16,400.00)$ (8,800.00)$ (8,800.00)$ (8,800.00)$ (8,800.00)$ (8,800.00)$ (8,800.00)$
Net cash from operations 410,852.61$ 410,852.61$ 410,852.61$ 410,852.61$ 410,852.61$ 410,852.61$ 1,245,909.22$ 1,245,909.22$ 1,245,909.22$ 1,245,909.22$ 1,245,909.22$ 1,245,909.22$
Investing activities -$
Purchase Current Assets (88,388.89)$ (88,388.89)$ (88,388.89)$ (88,388.89)$ (88,388.89)$ (88,388.89)$ (176,777.78)$ (176,777.78)$ (176,777.78)$ (176,777.78)$ (176,777.78)$ (176,777.78)$
Long-term Assets purchase -$ -$ -$ -$ -$
Net cash flow from investing actvities (88,388.89)$ (88,388.89)$ (88,388.89)$ (88,388.89)$ (88,388.89)$ (88,388.89)$ (176,777.78)$ (176,777.78)$ (176,777.78)$ (176,777.78)$ (176,777.78)$ (176,777.78)$
Net Cash Balances 2,903.39$ 2,903.39$ 2,903.39$ 2,903.39$ 2,903.39$ 2,903.39$ 440,912.78$ 440,912.78$ 440,912.78$ 440,912.78$ 440,912.78$ 440,912.78$
Jul-19 Aug-19 Sep-19 Oct-19 Nov-19 Dec-19 January 2020-March 2020April 2020-June 2020July 2020-Sepetember 2020October 2020-December 2020January 2021-March 2021April 2021-July 2021
Financing activities
Stock issued 377.78$ 377.78$ 377.78$ 377.78$ 377.78$ 377.78$ 755.55$ 755.55$ 755.55$ 755.55$ 755.55$ 755.55$
Repurchased stock repurchased (84,238.06)$ (84,238.06)$ (84,238.06)$ (84,238.06)$ (84,238.06)$ (84,238.06)$ (84,772.11)$ (84,772.11)$ (84,772.11)$ (84,772.11)$ (84,772.11)$ (84,772.11)$
Cash dividend paid (235,500.06)$ (235,500.06)$ (235,500.06)$ (235,500.06)$ (235,500.06)$ (235,500.06)$ (543,802.11)$ (543,802.11)$ (543,802.11)$ (543,802.11)$ (543,802.11)$ (543,802.11)$
Net financing cash flow (319,360.33)$ (319,360.33)$ (319,360.33)$ (319,360.33)$ (319,360.33)$ (319,360.33)$ (627,818.67)$ (627,818.67)$ (627,818.67)$ (627,818.67)$ (627,818.67)$ (627,818.67)$
Operational activities
Cash from debtors -$ -$ 100.00$ 100.00$ 100.00$ 100.00$ 100.00$ 100.00$ 100.00$ 100.00$ 100.00$ 100.00$
Transportation cost (40.00)$ (40.00)$ (40.00)$ (40.00)$ (40.00)$ (40.00)$ (40.00)$ (40.00)$ (40.00)$ (40.00)$ (40.00)$ (40.00)$
Advertisement cost (50.00)$ (50.00)$ (50.00)$ (50.00)$ (50.00)$ (50.00)$ (50.00)$ (50.00)$ (50.00)$ (50.00)$ (50.00)$ (50.00)$
Construction or leased cost for new store (100.00)$ (100.00)$ (100.00)$ (100.00)$ (100.00)$ (100.00)$ (100.00)$ (100.00)$ (100.00)$ (100.00)$ (100.00)$ (100.00)$
business licence cost (14.00)$ (14.00)$ (14.00)$ (14.00)$ (14.00)$ (14.00)$ (14.00)$ (14.00)$ (14.00)$ (14.00)$ (14.00)$ (14.00)$
Liabilities principal repayment (16,400.00)$ (16,400.00)$ (16,400.00)$ (16,400.00)$ (16,400.00)$ (16,400.00)$ (8,800.00)$ (8,800.00)$ (8,800.00)$ (8,800.00)$ (8,800.00)$ (8,800.00)$
Net cash from operations (16,604.00)$ (16,604.00)$ (16,504.00)$ (16,504.00)$ (16,504.00)$ (16,504.00)$ (8,904.00)$ (8,904.00)$ (8,904.00)$ (8,904.00)$ (8,904.00)$ (8,904.00)$
Investing activities -$
Purchase Current Assets (88,388.89)$ (88,388.89)$ (88,388.89)$ (88,388.89)$ (88,388.89)$ (88,388.89)$ (176,777.78)$ (176,777.78)$ (176,777.78)$ (176,777.78)$ (176,777.78)$ (176,777.78)$
Long-term Assets purchase -$ -$ -$ -$ -$
Net cash flow from investing actvities (88,388.89)$ (88,388.89)$ (88,388.89)$ (88,388.89)$ (88,388.89)$ (88,388.89)$ (176,777.78)$ (176,777.78)$ (176,777.78)$ (176,777.78)$ (176,777.78)$ (176,777.78)$
Net Cash Balances (424,353.22)$ (424,353.22)$ (424,253.22)$ (424,253.22)$ (424,253.22)$ (424,253.22)$ (813,500.45)$ (813,500.45)$ (813,500.45)$ (813,500.45)$ (813,500.45)$ (813,500.45)$
⊘ This is a preview!⊘
Do you want full access?
Subscribe today to unlock all pages.
Trusted by 1+ million students worldwide
References
• Geissdoerfer, M., Savaget, P., Evans, S.(2017)."The Cambridge Business Model Innovation
Process". Procedia Manufacturing. 8: 262–269. doi:10.1016/j.promfg.2017.02.033. ISSN 2351-
9789.
• Karl M.P., Ralf, M.(2010).Profit from Software Ecosystems: Business Models, Ecosystems and
Partnerships in the Software Industry. Norderstedt, Germany: BOD. ISBN 978-3-8391-6983-4.
• Burgess, S; Sellitto, C; Karanasios, S.(2009).Effective Web Presence Solutions for Small
Businesses: Strategies and Successful Implementation, IGI Global
• Pantano, E. (2014). Innovation drivers in retail industry. International Journal of Information
Management, 34(3), 344-350.
• Souto, J. E. (2015). Business model innovation and business concept innovation as the context of
incremental innovation and radical innovation. Tourism Management, 51, 142-155.
• Visnjic, I., Wiengarten, F., & Neely, A. (2016). Only the brave: Product innovation, service
business model innovation, and their impact on performance. Journal of Product Innovation
Management, 33(1), 36-52.
• Mahar, S.; Wright, P., Daniel B., Kurt, M., Hill, R.P.(2014). "Optimizing marketer costs and
consumer benefits across "clicks" and "bricks"". Journal of the Academy of Marketing Science.
42 (6): 619–641. doi:10.1007/s11747-014-0367-8.
1 out of 10
Related Documents


Your All-in-One AI-Powered Toolkit for Academic Success.
+13062052269
info@desklib.com
Available 24*7 on WhatsApp / Email
![[object Object]](/_next/static/media/star-bottom.7253800d.svg)
Unlock your academic potential
Copyright © 2020–2026 A2Z Services. All Rights Reserved. Developed and managed by ZUCOL.