Quality Management and Business Process Improvement Report

Verified

Added on  2023/04/21

|15
|2918
|170
Report
AI Summary
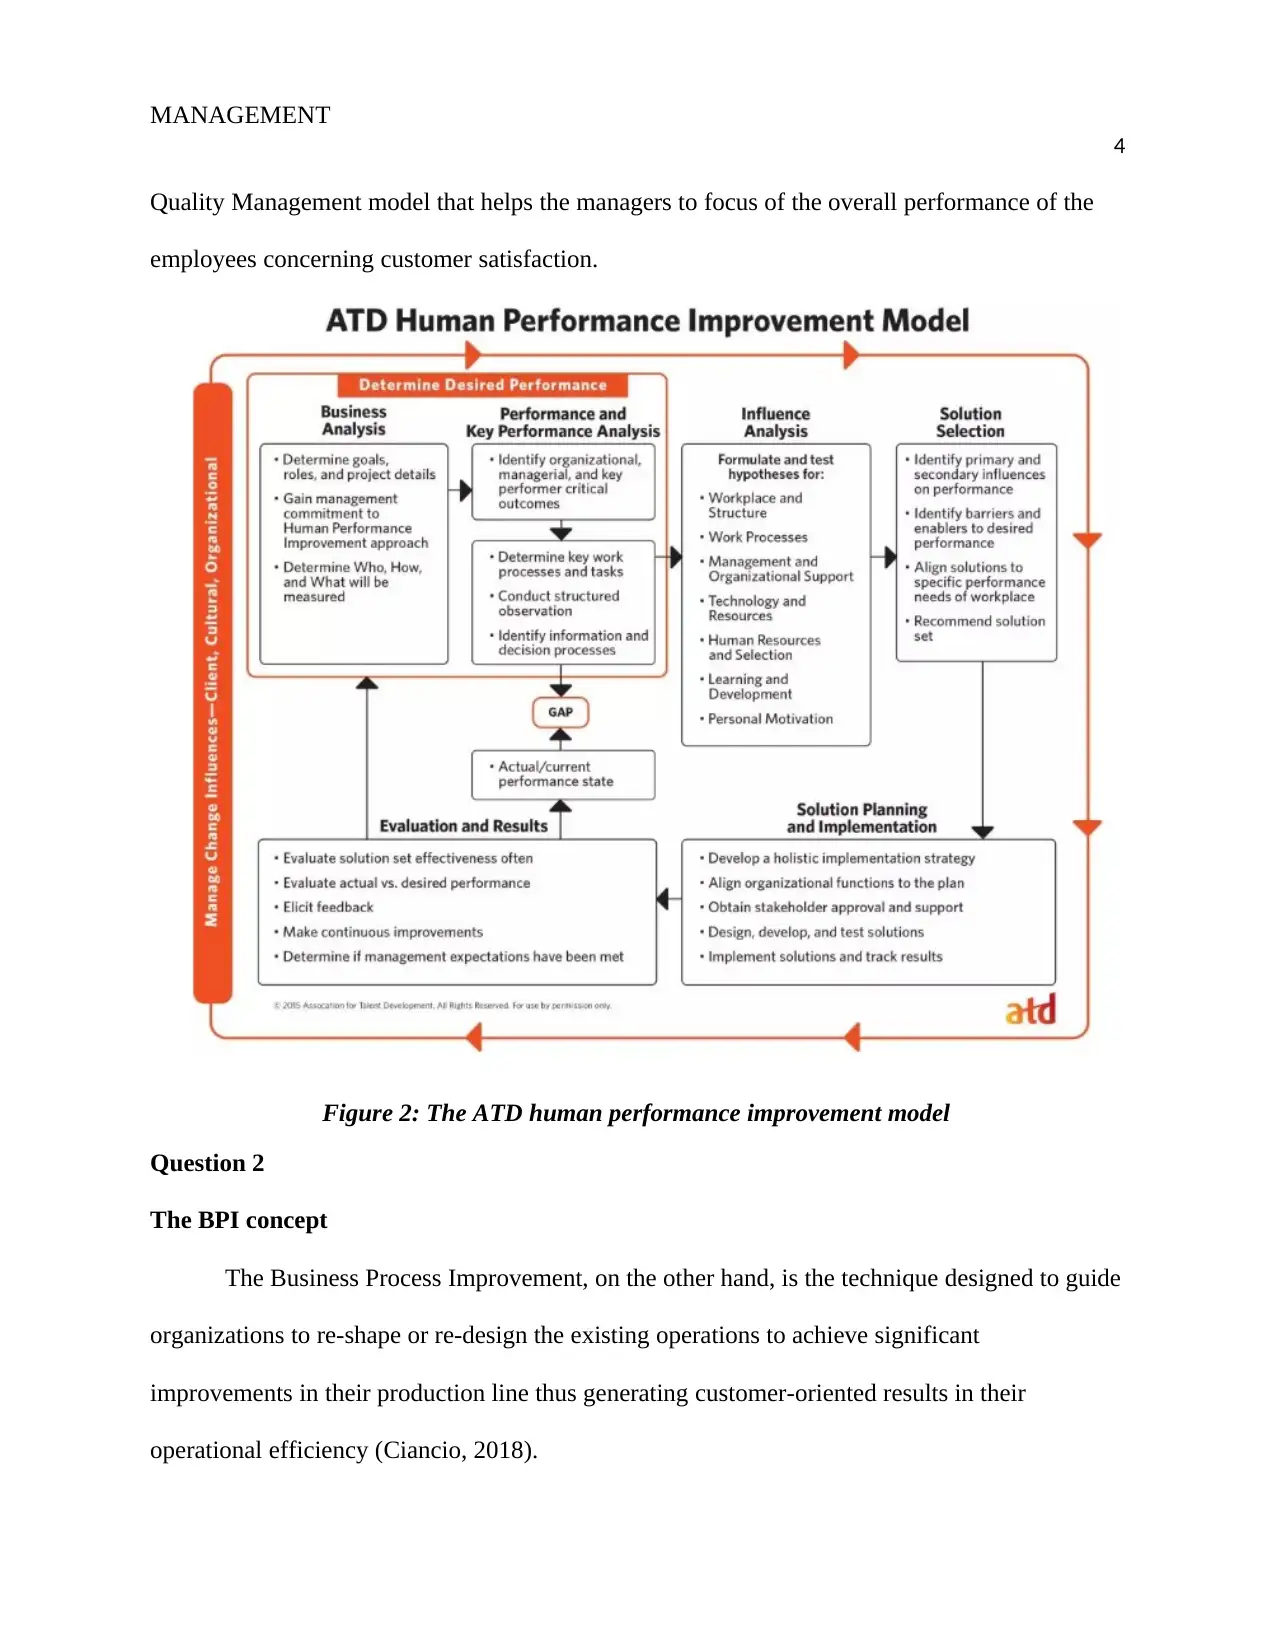
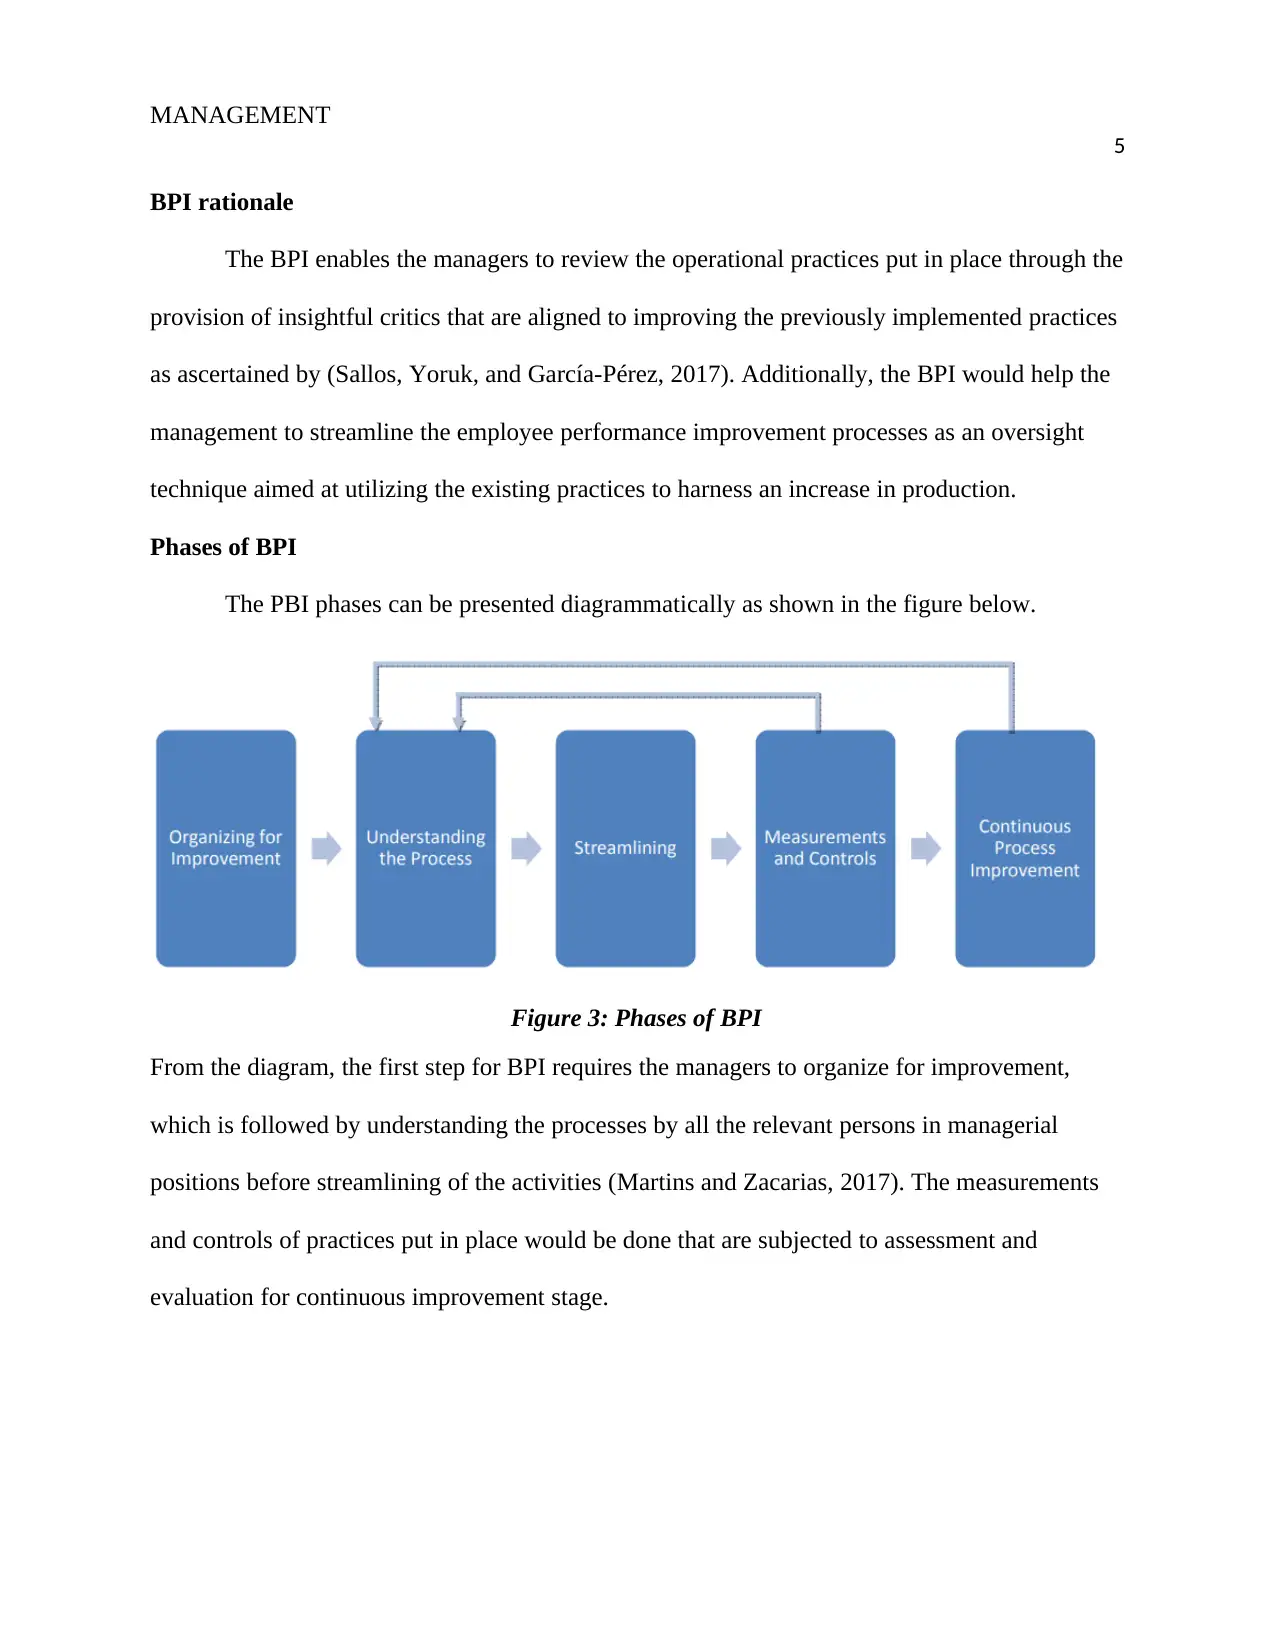
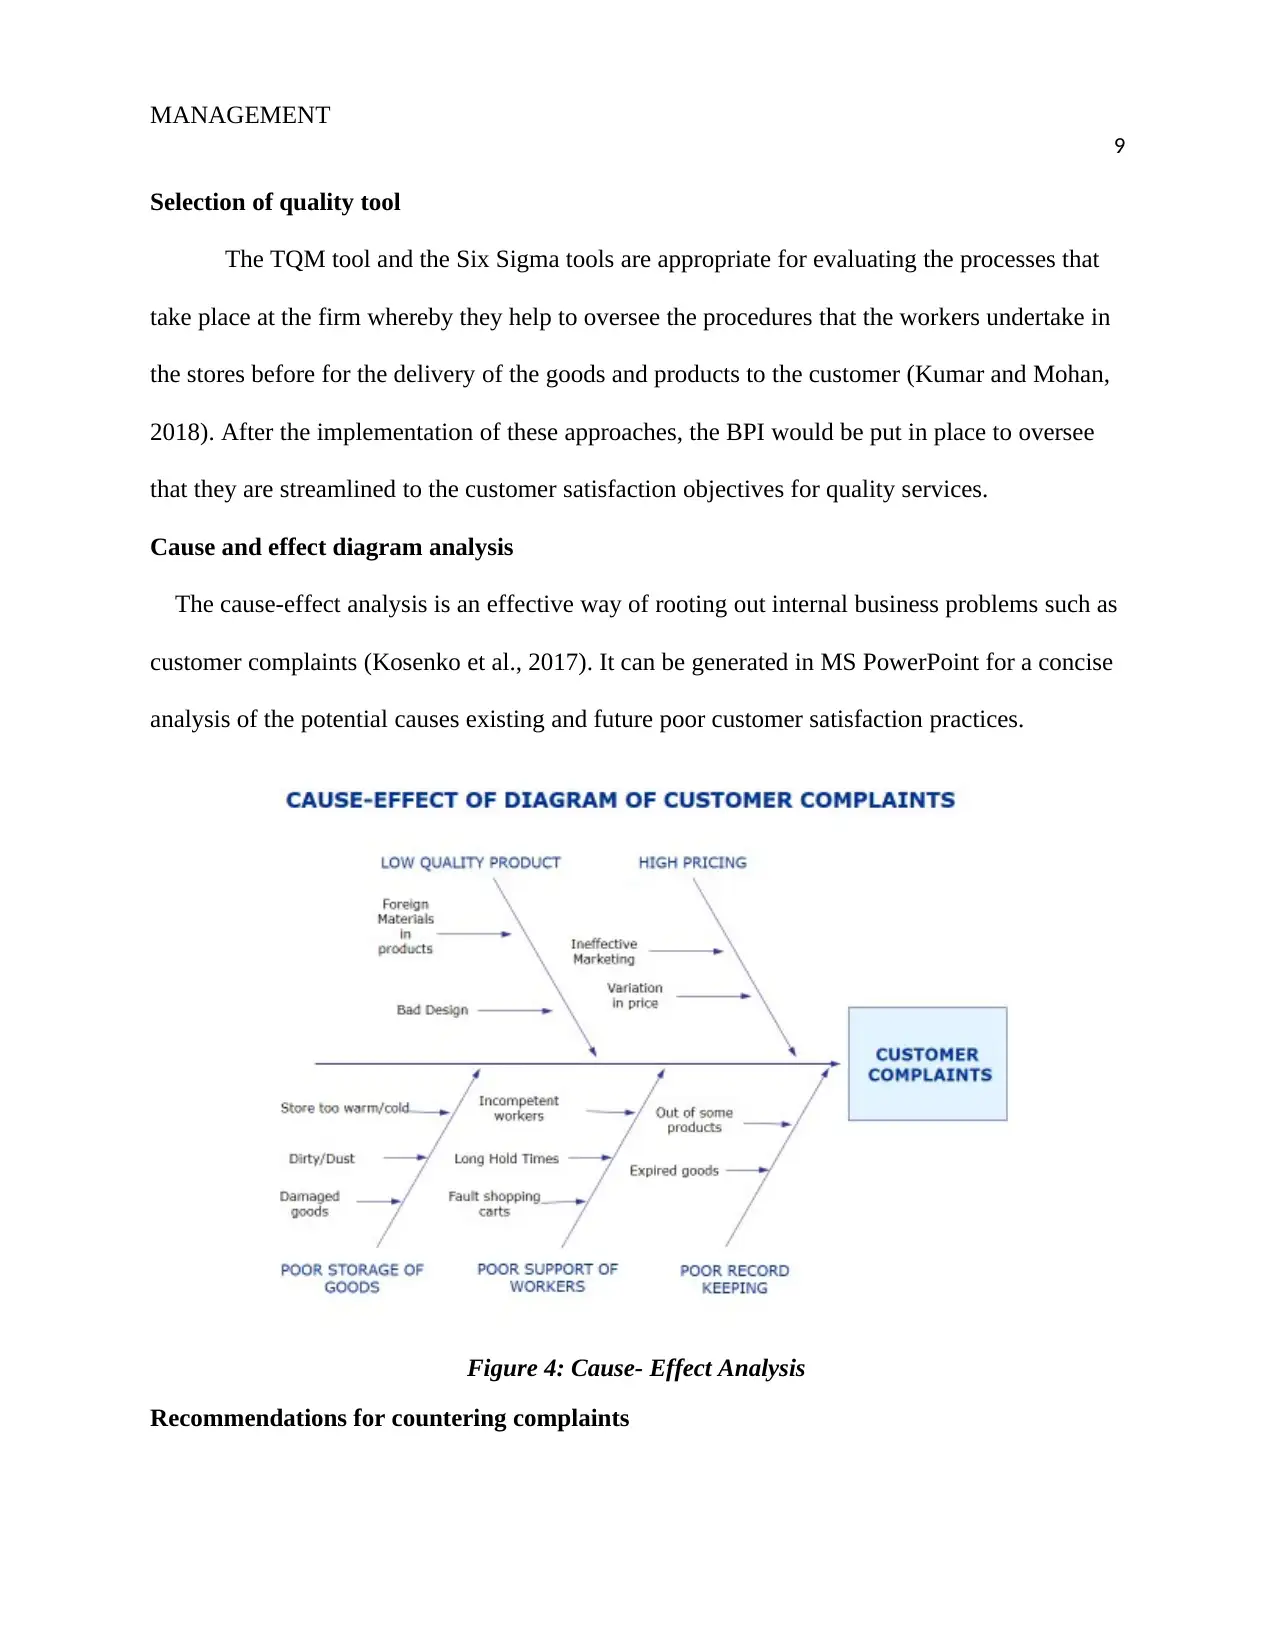
This report provides a comprehensive analysis of quality management and business improvement strategies. It begins by evaluating key concepts such as performance management cycles and the importance of performance improvement models like the ATD human model and Total Quality Management. The report then delves into Business Process Improvement (BPI), its rationale, and phases, highlighting its role in reshaping organizational operations for customer-oriented results. Furthermore, it evaluates Japanese approaches to quality control, including lean/six-sigma and Kaizen, emphasizing their focus on continuous improvement and waste reduction. The report also discusses the key drivers of Total Quality Management (TQM), the importance of ISO 9000, and the distinctions between Baldrige awards and ISO certification. It further integrates six-sigma and lean methodologies, showcasing their combined impact on process optimization and defect elimination. Finally, the report addresses customer complaints at SMART-FUTURE Ltd., categorizing them and recommending solutions based on cause-effect analysis and P-chart analysis, emphasizing the importance of addressing issues like poor storage conditions to maintain customer satisfaction and market share. The document is available on Desklib with other study tools for students.
Document Page
Running head: MANAGEMENT
1
Managing Quality and Business Improvement
Student’s Name
Institutional Affiliation
Professor’s Name
Date
tabler-icon-diamond-filled.svg

Paraphrase This Document

Need a fresh take? Get an instant paraphrase of this document with our AI Paraphraser
Document Page
MANAGEMENT
2
Managing Quality and Business Improvement
Part A
Question 1
Evaluation of concept
Evaluation of concept in the management of quality and improvement of businesses is the
measure of effectiveness and efficiency in assessment processes in all the aspects of companies
such as the financial records, human resource management and practices that lead to customer
satisfaction among other methods (Posavac, 2015). However, effectiveness refers to the quality
of the results (consistency) associated with completion of the duties and tasks by both the
managers and the employees whereas efficiency is the time taken for a task be completed.
Performance management cycle
It depicts the phases involved in business management processes, which include
planning, monitoring, reviewing, and rewarding of the workers’ performance (Shields et al.,
2015). The processes are centered on setting the goals of employees that are inclined to the
strategic objectives of the business. Moreover, the cycle entails continual communication
between the managers/ supervisors and the workers throughout the financial year in the efforts to
enhance the organization’s vision, mission, objectives, and goals. The cycle can be represented
in the diagram as shown below.
Document Page
MANAGEMENT
3
Figure 1: Performance management cycle
Importance of performance improvement
Performance improvement of the workers is crucial as a way of encouraging the
employees to work at their optimal level of performance as acknowledged by Seleem, Attia, and
El-Assal (2016). Increasing the output of individual employees would lead to a cumulative
increase in the production level of the business organization thus maximizing the returns as well
as customer satisfaction.
Evaluation of performance improvement model
The ATD human model is essential in performance improvement of the employees as it
provides an analysis of the key performance, influence analysis, solution selection, Gap analysis,
solution planning, and evaluation of the individual results of the employees and the firm at large
as illustrated below (Abaci and Pershing, 2017). Another model of improvement is the Total
Document Page
MANAGEMENT
4
Quality Management model that helps the managers to focus of the overall performance of the
employees concerning customer satisfaction.
Figure 2: The ATD human performance improvement model
Question 2
The BPI concept
The Business Process Improvement, on the other hand, is the technique designed to guide
organizations to re-shape or re-design the existing operations to achieve significant
improvements in their production line thus generating customer-oriented results in their
operational efficiency (Ciancio, 2018).
tabler-icon-diamond-filled.svg

Paraphrase This Document

Need a fresh take? Get an instant paraphrase of this document with our AI Paraphraser
Document Page
MANAGEMENT
5
BPI rationale
The BPI enables the managers to review the operational practices put in place through the
provision of insightful critics that are aligned to improving the previously implemented practices
as ascertained by (Sallos, Yoruk, and García-Pérez, 2017). Additionally, the BPI would help the
management to streamline the employee performance improvement processes as an oversight
technique aimed at utilizing the existing practices to harness an increase in production.
Phases of BPI
The PBI phases can be presented diagrammatically as shown in the figure below.
Figure 3: Phases of BPI
From the diagram, the first step for BPI requires the managers to organize for improvement,
which is followed by understanding the processes by all the relevant persons in managerial
positions before streamlining of the activities (Martins and Zacarias, 2017). The measurements
and controls of practices put in place would be done that are subjected to assessment and
evaluation for continuous improvement stage.
Document Page
MANAGEMENT
6
Question 3
Evaluation of two TQC Japanese approaches
The Japanese adopted the lean/ six-sigma technique and the Kaizen improvement
technique to help the managers in identification of the less productive practices or processes so
that they can replace them with efficient and more productive measures that could improve the
effectiveness and efficacy of production. The two approaches lead to increase in productivity and
quality of the products.
KAIZEN improvement focus
KAIZEN is a technique of creating continuous improvement whereby the ideas are based
on small and positive ongoing processes or changes that can result in significant improvements
(Alvarado-Ramírez et al., 2018). The technique is core to the lean manufacturing that lies on the
cooperation and commitment of standards contrary to the approaches that deploy radical changes
and top-down transformation. Additionally, the approach focusses on lowering the defects,
elimination of the wastes, boosting of productivity, and encourage the workers towards
accountability, purpose, and promotion of innovation (Carvalho, 2016).
Part B
Question 1
The key drivers of TQM
The major drivers for the Total Quality Management were delivery of customer-end
value by focusing on the entire organization rather than individual processes (Jalilvand et al.,
2018). The model gained popularity due to the competition for customers that had made the
competitors in the market to prioritize customer satisfaction to gain higher sales and market
shares.
Document Page
MANAGEMENT
7
Importance of ISO 9000
The ISO 9000 is a management standard of quality that entails the guidelines intended to
increase efficiency in business that would contribute to customer satisfaction. The certification is
to ensure a quality management system that would increase production, reduction of unnecessary
costs, and ensure quality processes and products (Kakouris and Sfakianaki, 2019).
Evaluation of key points of the three distinction awards
The awards of distinction focus on enhancing competitiveness through the delivery of
continual improvement of the customer value and the operational performance in general.
Another critical point of the distinction award is to encourage knowledge sharing to drive
learning, and creation of evolvement of knowledge in funds in business operation. The third
point is to ensure conformity to the quality practices by the organisations for a healthy business
competition.
Question 2
Comparison of Baldrige awards and ISO certification
The Baldrige awards focus on factors of improvement for the customer value and
operational performance whereas the ISO certification is for the conformity to the set standards
and practices (Valmohammadi and Roshanzamir, 2015). However, while the Baldrige’s purpose
is considered educational for encouraging the sharing of business knowledge, the primary goal of
ISO certification is to promote and facilitate trade. The Baldrige award is acknowledged for
addressing factors such as market focus, customer satisfaction, continuous improvement, human
resources development, and integration through analysis, ISO certification hardly cover 10
percent of the Baldrige award criteria (Ross, 2017)
tabler-icon-diamond-filled.svg

Paraphrase This Document

Need a fresh take? Get an instant paraphrase of this document with our AI Paraphraser
Document Page
MANAGEMENT
8
Question 3
Six-sigma programme
The six-sigma was developed to measure the defects and inconsistencies in the
production process as an indicator for efficiency level. The core tool for a six-sigma process is
the DMAIC that is based on Definition where the opportunity for improvement is identified, then
Measure to determine the benchmark metrics for the problem, which is the Analyzed to uncover
the inconsistencies. After an analysis in done, Improvement is carried out to get rid of the
problem whereby Control is enhanced to monitor the new process (Marques and Matthé, 2017).
Lean/ Six Sigma integration
The Six Sigma aims at eliminating the defects for the better quality of production
whereas Lean aims to optimize the process itself as much as possible (Allen, 2019). In Lean, a
low-value step of a process is identified and eliminated although it might not have a significant
impact on the result. The integration of lean/ Six Sigma defines the end-customer value, maps
out the process as it identifies the steps that are not creating value while cutting them out and
finally iterating the operations above until the business achieves efficiency (Gijo, Palod, and
Antony, 2018).
Part C
Question 1
Categorization of complaints at SMART-FUTURE Ltd.
The customer complaints can be categorized into the following; Poor storage condition of
goods, Poor support of employees, High Pricing, Low Quality of the products, and Poor Record
keeping of goods. Using these categories, the manager can classify the complaints appropriately
for analysis.
Document Page
MANAGEMENT
9
Selection of quality tool
The TQM tool and the Six Sigma tools are appropriate for evaluating the processes that
take place at the firm whereby they help to oversee the procedures that the workers undertake in
the stores before for the delivery of the goods and products to the customer (Kumar and Mohan,
2018). After the implementation of these approaches, the BPI would be put in place to oversee
that they are streamlined to the customer satisfaction objectives for quality services.
Cause and effect diagram analysis
The cause-effect analysis is an effective way of rooting out internal business problems such as
customer complaints (Kosenko et al., 2017). It can be generated in MS PowerPoint for a concise
analysis of the potential causes existing and future poor customer satisfaction practices.
Figure 4: Cause- Effect Analysis
Recommendations for countering complaints
Document Page
MANAGEMENT
10
From the cause-effect analysis, the management should conduct an improvement
management practice for the workers to ensure the organisation has competent personnel that
adheres to the needs of the customers. Performance improvement would also ensure the workers
maintain high standards of hygiene and ready to serve the customers the entire time.
Additionally, the firm should carry our lean/ Six Sigma practices to ensure high-quality products
that do not have foreign materials and be in good design. The approach would further provide
that the storage be in excellent condition with an updated inventory of the goods and products.
Moreover, the firm should be consistent with the pricing of goods during advertisement and at
the time of the actual sales to ensure the customer confidence is restored (Nakamura et al., 2017).
In case there are overcrowding of customers at the stores, the firm should make an effort to open
up new branches with intensive advertisements for the newly opened stores that would serve to
improve the customer road map to the goods and services offered thus promoting their
satisfaction.
Question 2
Variables
Complaints/
samples P UCL LCL
Poor product quality 3 4 5.58 2.52
High Pricing 1 4 5.58 2.52
Poor record keeping 5 4 5.58 2.52
Poor support of employees 3 4 5.58 2.52
Poor storage conditions 6 4 5.58 2.52
Total 20
Table 1: P-Chart values
tabler-icon-diamond-filled.svg

Paraphrase This Document

Need a fresh take? Get an instant paraphrase of this document with our AI Paraphraser
Document Page
MANAGEMENT
11
Computation of p
P is the control line, which can be considered as the average or the mean by the following
formula P= of samples
Number of variables = 4
Computation of Sp
Sp is the standard deviation that can be obtained from the MS Excel given by
Sp = 1.58119
Computation of UCL
The Upper Control Limit is the standard deviation from the mean on the upper side of the
control line, which is calculated from MS Excel given by
UCL= 5.58
Computation of LCL
The lower Control Limit is the standard deviation from the mean on the lower side given
by
LCL = 2.52
Document Page
MANAGEMENT
12
P-chart for 20 samples
Poor product quality
High Pricing
Poor record keeping
Poor support of employees
Poor storage conditions
0
1
2
3
4
5
6
7
P-Chart for customer complaints
Complaints/ samples
p
UCL
LCL
Variables
Samples/ Complaints
Figure 5: P-Chart graph
Comments in control and out of control
From the P-chart above, it can be seen that the complaints regarding the poor storage
conditions are out of control and require significant measures that can be used to solve the
problem. There is a necessity to fix the problem immediately as it could raise more concerns that
can easily result in the loss of market shares. However, the chart indicates that the complaints
raised over product qualities, record keeping, and support from the employees lie within the
upper and the lower control limit; thus, the management is in control. Pricing is depicted to be
beyond the lower limit, therefore, the problem is under control (Quinino, Bessegato, and Cruz,
2017).
chevron_up_icon
1 out of 15
circle_padding
hide_on_mobile
zoom_out_icon
[object Object]