University Data Analysis Report: Business Information Systems
VerifiedAdded on 2021/06/18
|9
|908
|91
Report
AI Summary
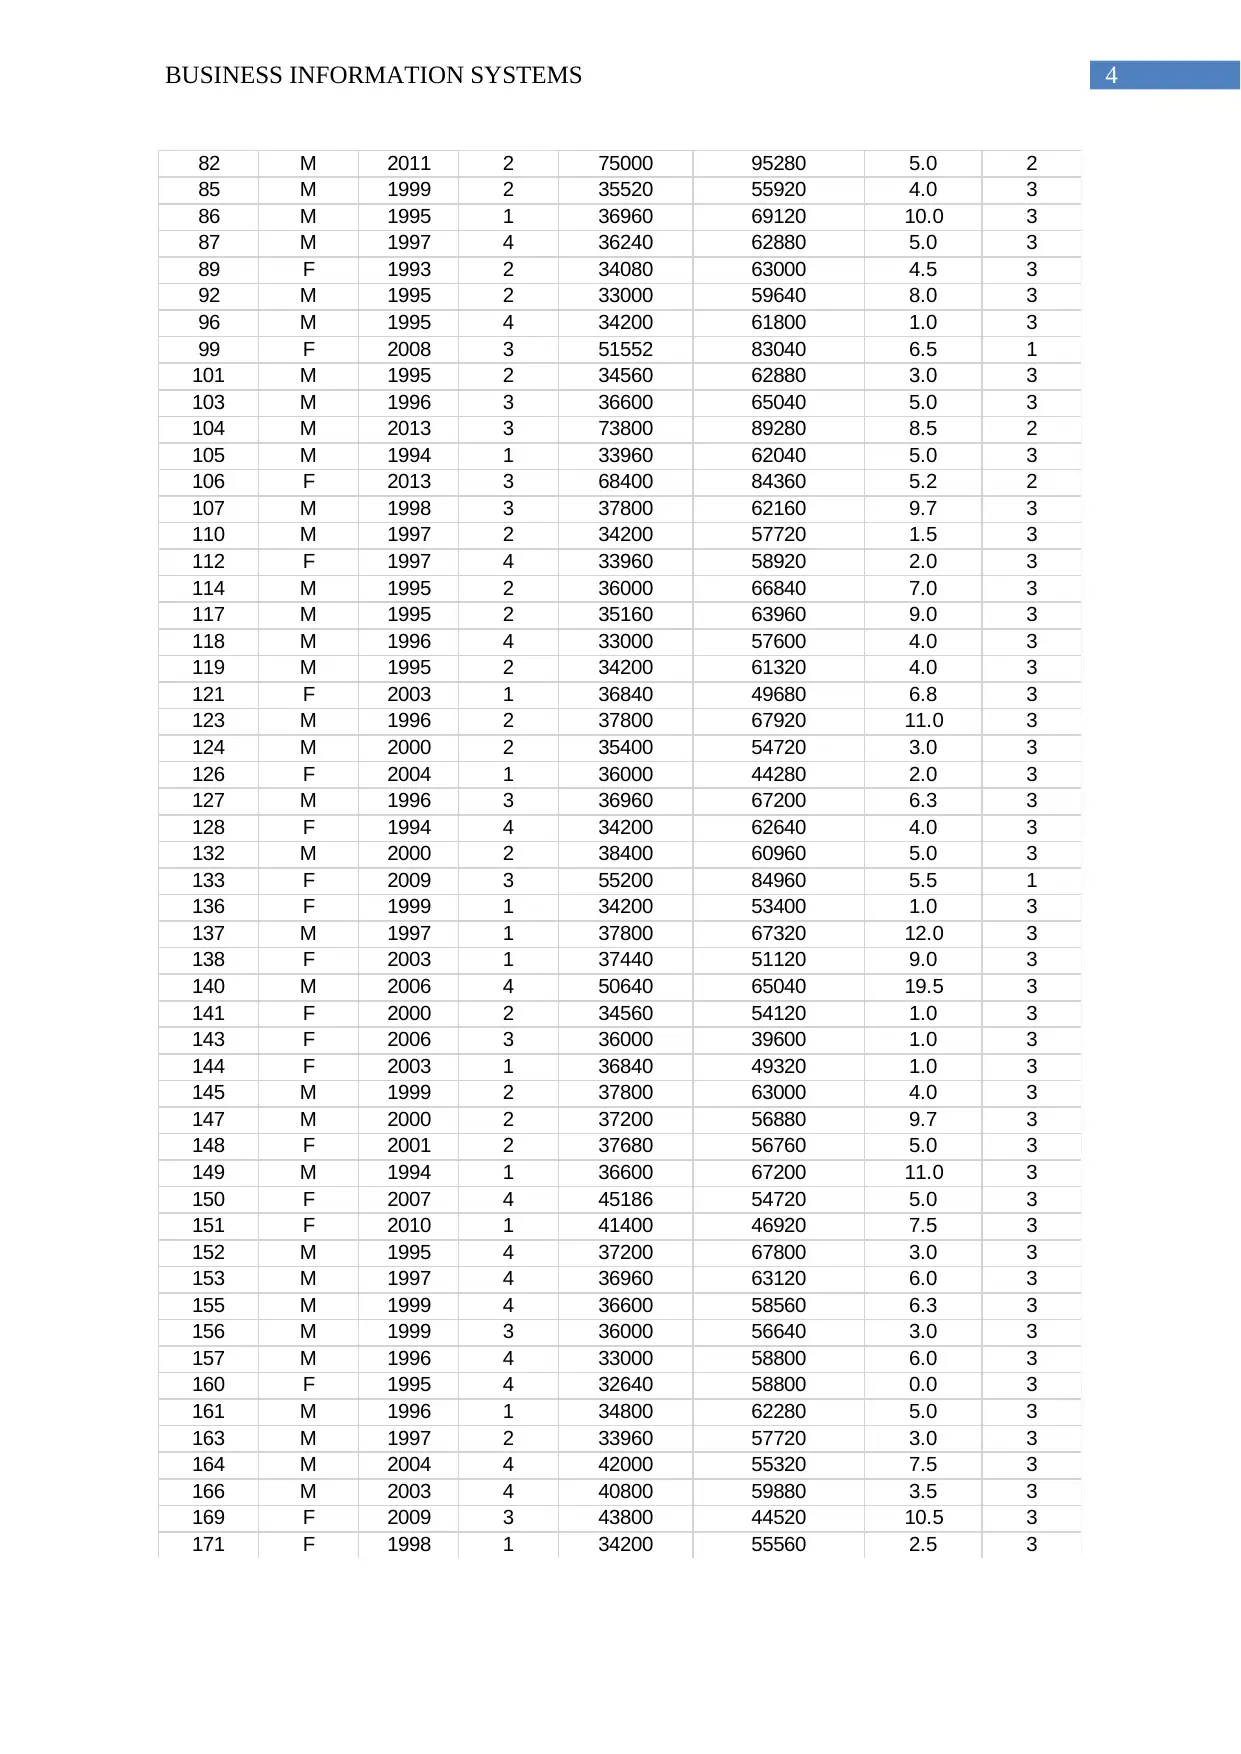
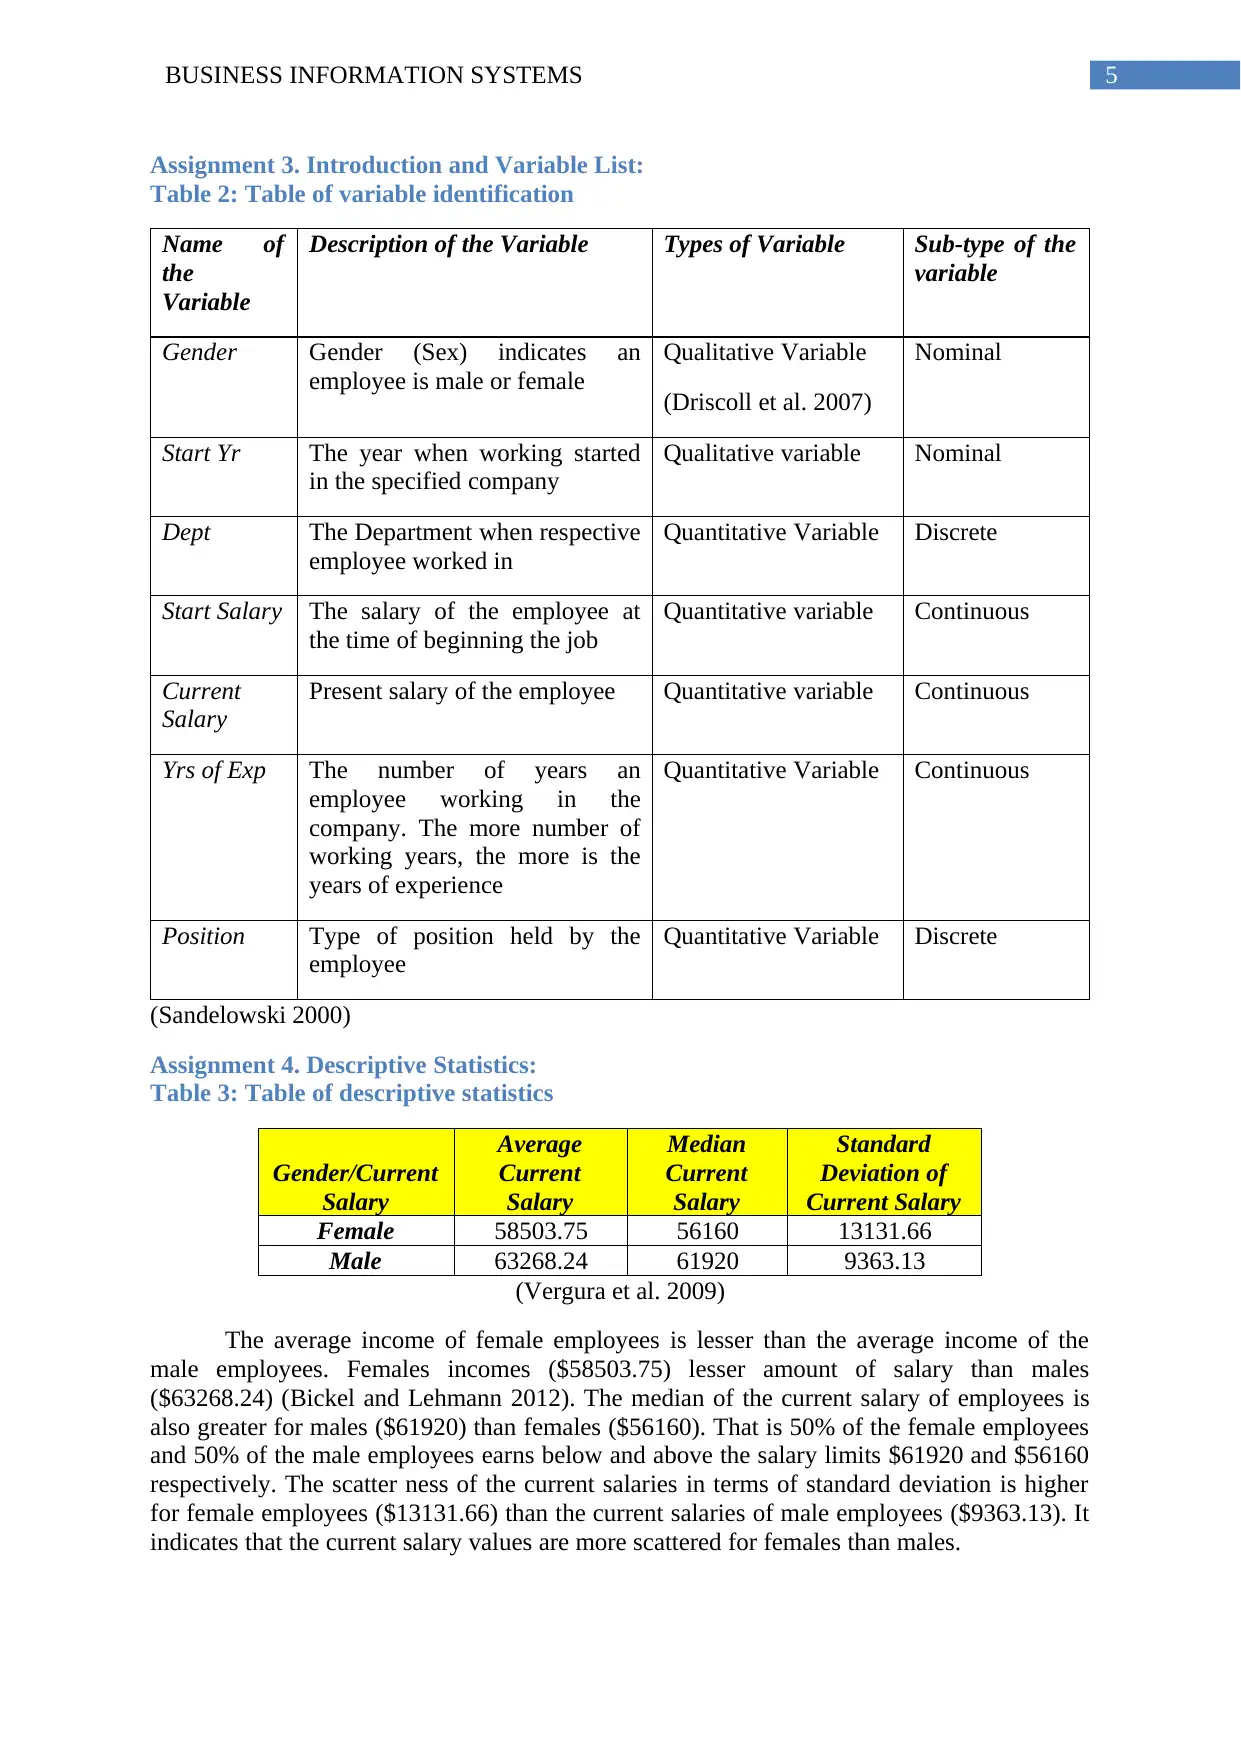
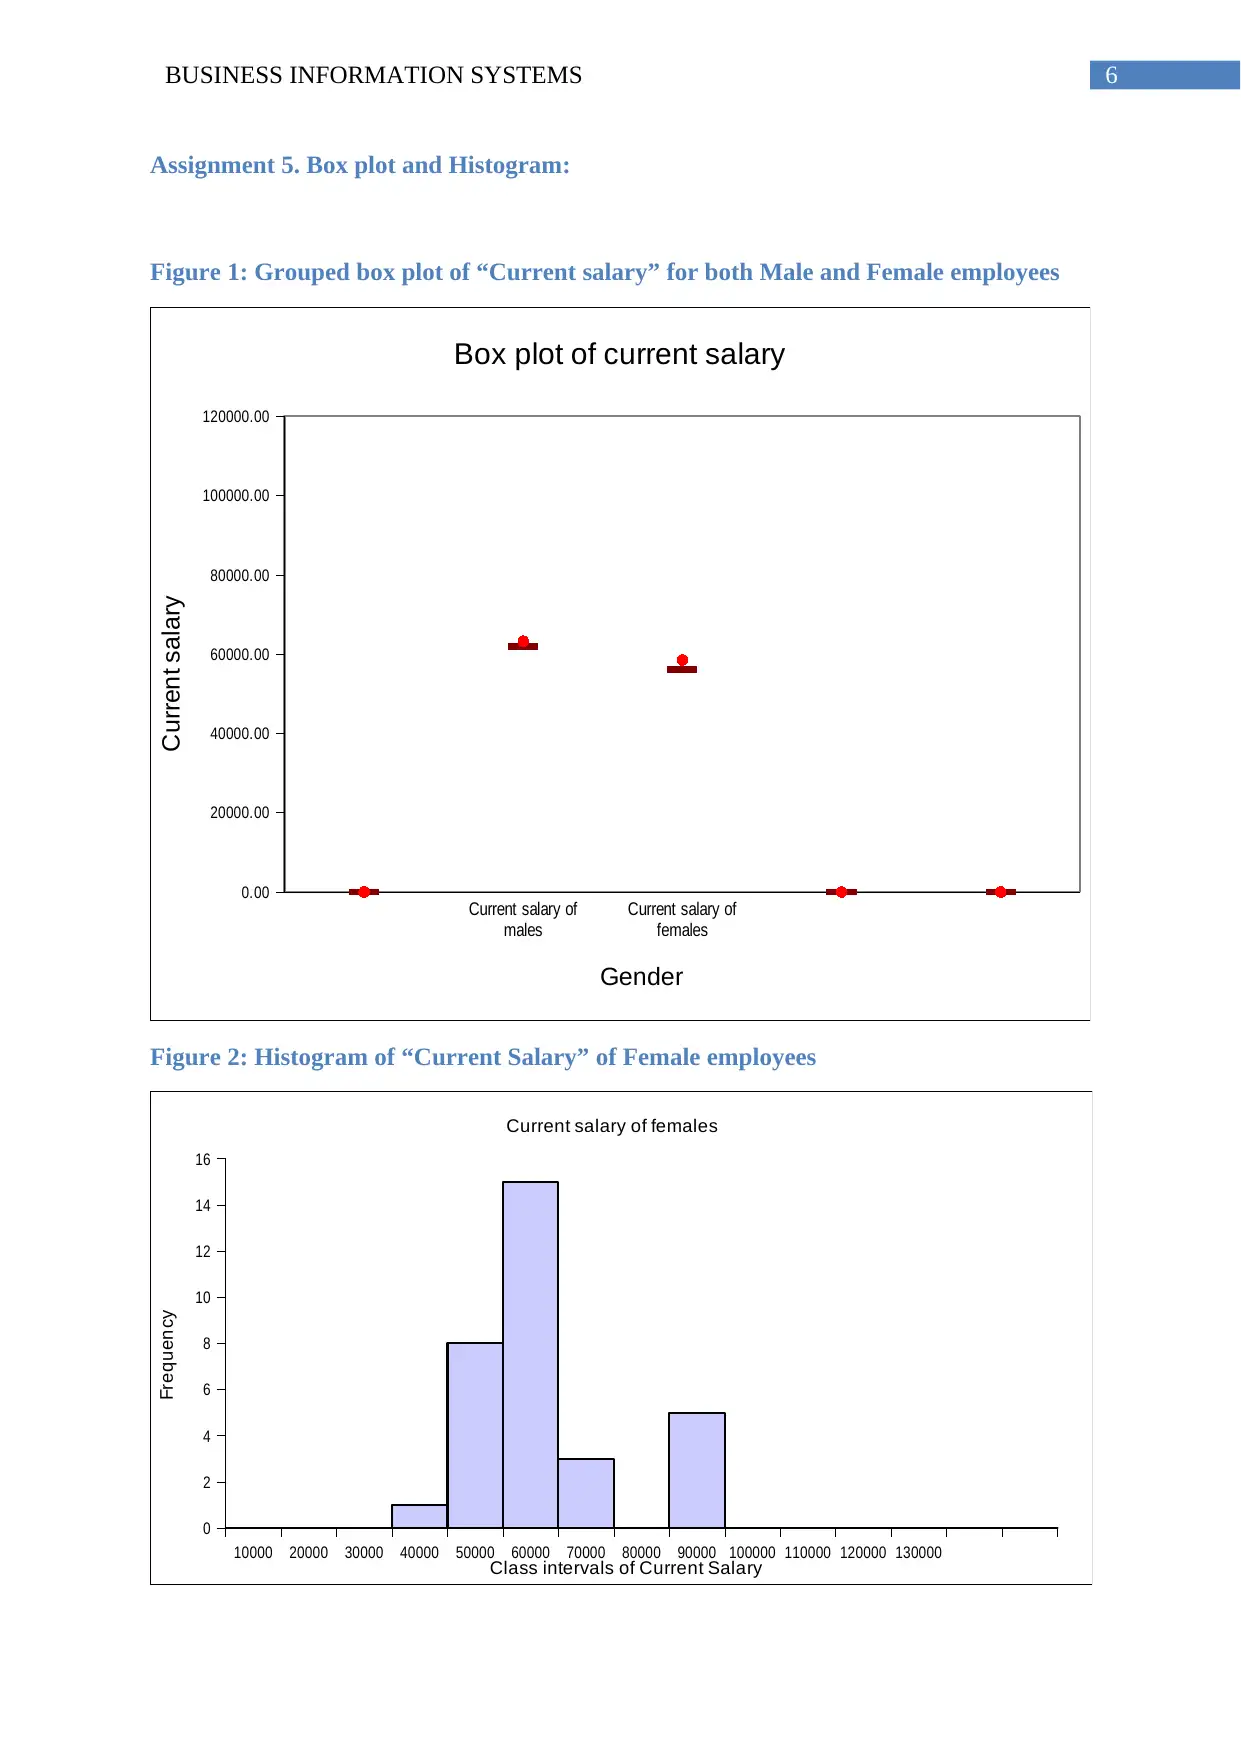
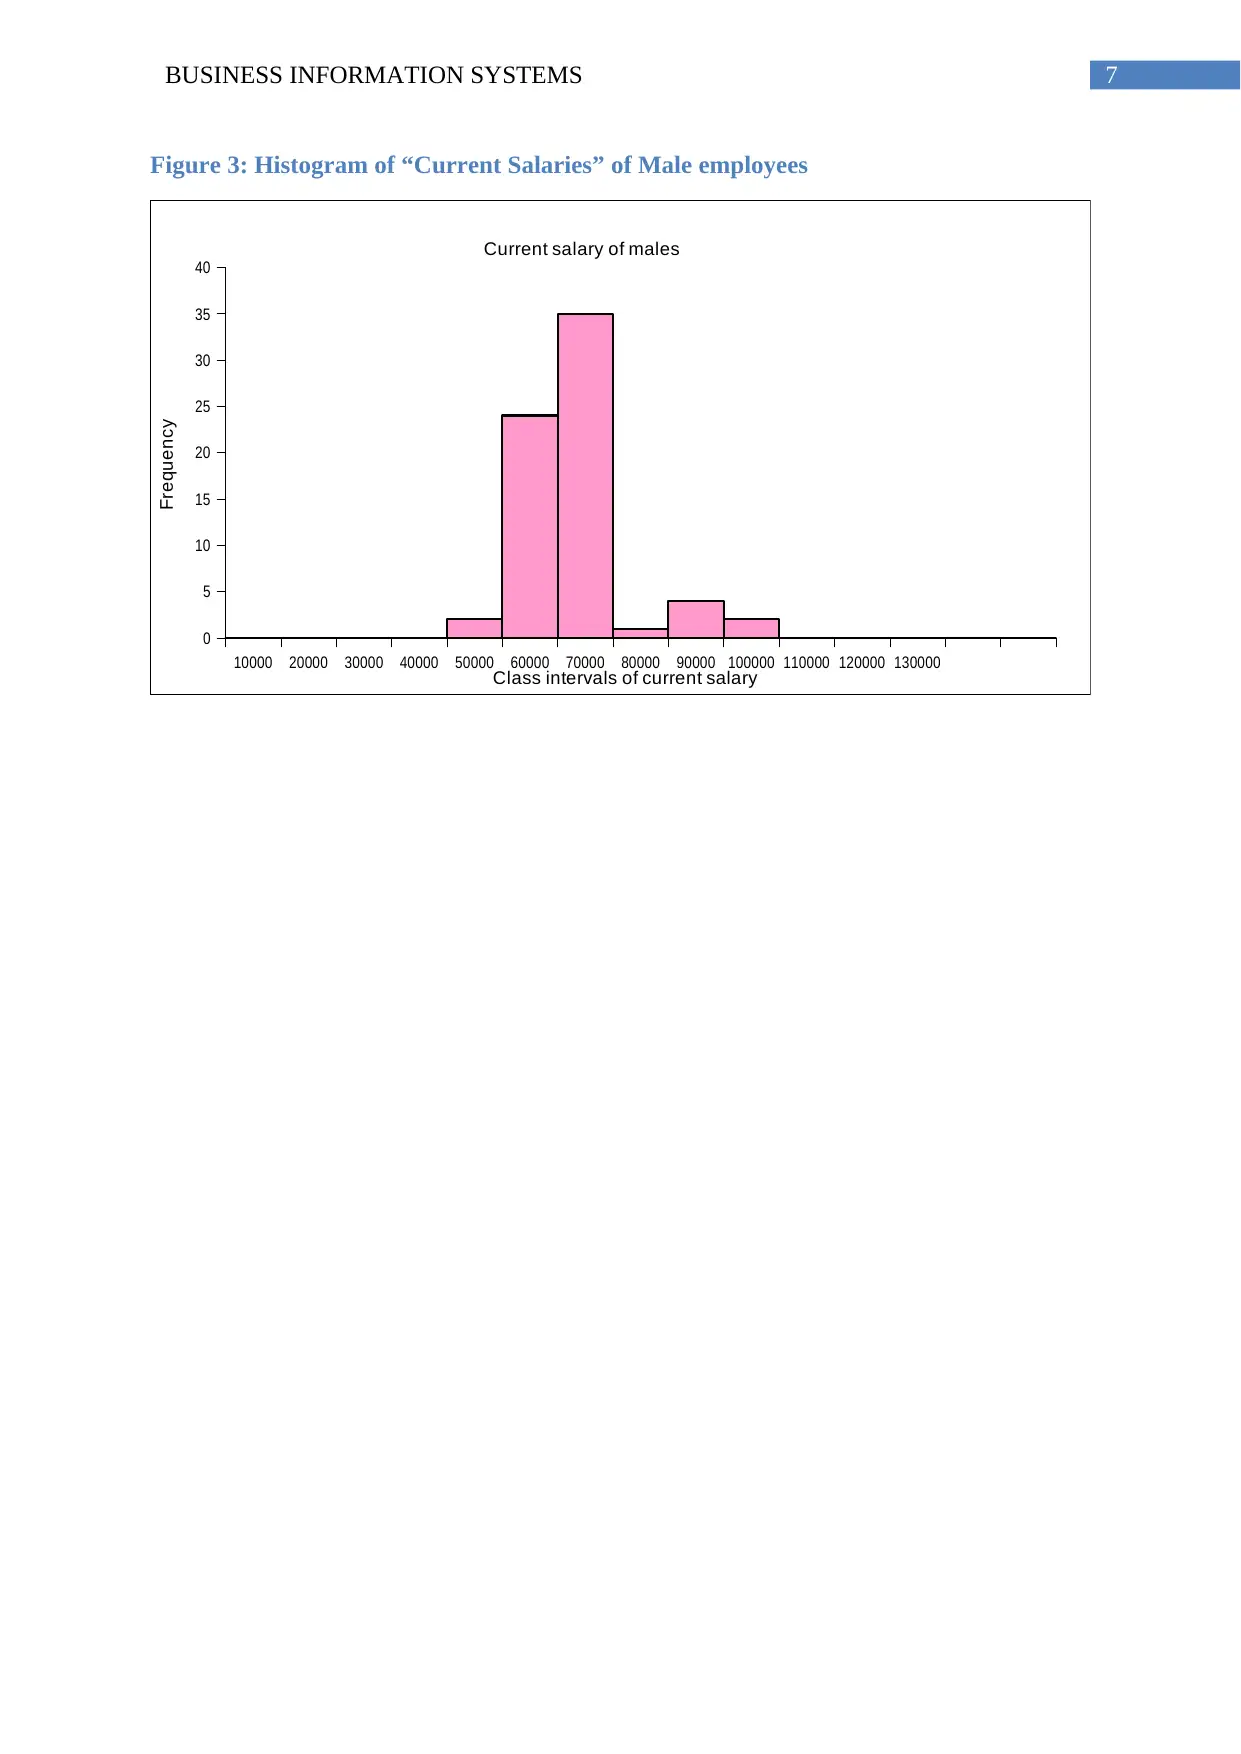
This report presents a comprehensive analysis of a business information system's employee data, focusing on salary structures and gender-based disparities. The analysis begins with data randomization, selecting 100 samples from an initial dataset of 171 employees. The report then details the variables, including gender, start year, department, starting salary, current salary, years of experience, and position. Descriptive statistics, such as average and median salaries, and standard deviations are calculated and compared between male and female employees, revealing income differences. The report further visualizes the data using a grouped box plot comparing current salaries by gender and histograms illustrating the distribution of current salaries for both genders. The findings highlight salary variations and provide a statistical overview of the employee data, supported by relevant references.

Running head: BUSINESS INFORMATION SYSTEMS
Business Information Systems
Name of the Student:
Name of the University:
Course ID:
Business Information Systems
Name of the Student:
Name of the University:
Course ID:
Paraphrase This Document
Need a fresh take? Get an instant paraphrase of this document with our AI Paraphraser

BUSINESS INFORMATION SYSTEMS 1
Table of Contents
Table of Contents.......................................................................................................................1
Introduction:...............................................................................................................................3
Data analysis:.............................................................................................................................3
Assignment 1. Randomisation:..............................................................................................3
Assignment 2. Data:...............................................................................................................3
Assignment 3. Introduction and Variable List:......................................................................6
Assignment 4. Descriptive Statistics:.....................................................................................6
Assignment 5. Box plot and Histogram:................................................................................7
References:.................................................................................................................................9
Table of Figures
Figure 1: Grouped box plot of “Current salary” for both Male and Female employees............7
Figure 2: Histogram of “Current Salary” of Female employees................................................7
Figure 3: Histogram of “Current Salaries” of Male employees.................................................8
Table of Tables
Table 1: Table of randomized variables.....................................................................................2
Table 2: Table of variable identification....................................................................................5
Table 3: Table of descriptive statistics.......................................................................................5

2BUSINESS INFORMATION SYSTEMS
Introduction:
Each year the undertaken company reveals the scenario of salaries of employees,
gender issue and other types of data related to this employment. These parameters undertaken
in the data set includes the data regarding gender, working department, the year of starting of
working in the company, beginning salary, current salary and the types of position the
employees held. It results a complete portfolio of the employees associated with the
company. The data set comprises the data of sampled 171 employees working in a private
company.
Data analysis:
Assignment 1. Randomisation:
From the 171 samples of basic portfolio of employees tabulated in “Macro” page, the
researcher randomises the data and with the help of randomisation technique chooses 100
samples. This data is generated by clicking of “Random Sample Generator” button. The 100
samples are different from each other and these are stored in another page named
“Randomised data”. With the help of these randomised samples, the researcher accomplished
the whole assignment.
Assignment 2. Data:
Table 1: Table of randomized variables
You're viewing a preview
Unlock full access by subscribing today!

3BUSINESS INFORMATION SYSTEMS
ID Gender Start Yr Dept Start Salary Current Salary Yrs of Exp Position
1 F 1993 3 35520 67080 10.7 3
5 M 1997 3 34800 58440 0.0 3
6 F 1999 3 36000 57120 8.3 3
9 M 1998 4 36000 59160 8.0 3
10 M 1997 2 34200 57360 1.0 3
11 M 1994 2 32160 58320 4.0 3
12 M 2011 4 70800 89280 6.0 2
15 M 1999 4 38400 62160 5.0 3
16 F 1997 4 34800 58680 2.0 3
18 M 1994 1 36000 67080 9.5 3
20 M 1997 2 37200 64080 6.0 3
21 M 1995 1 34200 60360 5.8 3
23 F 1998 4 33840 53640 0.0 3
25 M 1995 1 34500 62400 3.0 3
27 M 1993 2 37200 71160 12.0 3
28 F 2005 3 38400 45720 2.5 3
29 F 2000 2 34560 54000 3.0 3
30 F 2002 2 39360 57120 8.0 3
32 M 2009 3 43800 44160 15.1 3
34 F 2000 4 37200 57600 4.5 3
35 M 1995 1 33960 61560 5.0 3
36 M 1998 2 37320 62040 6.0 3
38 M 1994 3 33600 63720 10.2 3
39 F 2008 1 42000 45360 7.8 3
41 M 2004 2 40800 55920 5.0 3
44 M 2000 4 36000 55200 2.0 3
47 F 2012 3 69060 85200 8.0 2
50 F 1996 3 33792 59400 5.0 3
51 M 1995 4 36360 67080 14.5 3
52 M 2010 2 53400 80520 3.0 1
54 M 1996 4 34200 60720 4.0 3
55 M 2009 3 58800 90840 7.5 1
58 M 1998 2 33600 56400 3.3 3
60 M 1997 2 35040 59520 4.0 3
61 M 2002 2 36600 52080 5.0 3
63 M 1997 1 33960 58680 1.0 3
64 F 2011 3 69600 87960 4.5 2
65 M 1996 3 35520 63120 6.0 3
66 M 1997 1 36000 61080 5.0 3
67 F 2003 1 36240 47520 9.8 3
70 M 2000 3 33840 51240 0.5 3
71 M 1995 2 34800 63120 5.8 3
74 M 1997 1 34740 61560 4.0 3
76 M 2011 3 50400 48120 11.3 3
79 M 2000 1 34920 67320 4.0 3
80 M 2008 4 53400 86040 5.5 1
81 M 2001 3 38760 58560 4.0 3
Paraphrase This Document
Need a fresh take? Get an instant paraphrase of this document with our AI Paraphraser

4BUSINESS INFORMATION SYSTEMS
82 M 2011 2 75000 95280 5.0 2
85 M 1999 2 35520 55920 4.0 3
86 M 1995 1 36960 69120 10.0 3
87 M 1997 4 36240 62880 5.0 3
89 F 1993 2 34080 63000 4.5 3
92 M 1995 2 33000 59640 8.0 3
96 M 1995 4 34200 61800 1.0 3
99 F 2008 3 51552 83040 6.5 1
101 M 1995 2 34560 62880 3.0 3
103 M 1996 3 36600 65040 5.0 3
104 M 2013 3 73800 89280 8.5 2
105 M 1994 1 33960 62040 5.0 3
106 F 2013 3 68400 84360 5.2 2
107 M 1998 3 37800 62160 9.7 3
110 M 1997 2 34200 57720 1.5 3
112 F 1997 4 33960 58920 2.0 3
114 M 1995 2 36000 66840 7.0 3
117 M 1995 2 35160 63960 9.0 3
118 M 1996 4 33000 57600 4.0 3
119 M 1995 2 34200 61320 4.0 3
121 F 2003 1 36840 49680 6.8 3
123 M 1996 2 37800 67920 11.0 3
124 M 2000 2 35400 54720 3.0 3
126 F 2004 1 36000 44280 2.0 3
127 M 1996 3 36960 67200 6.3 3
128 F 1994 4 34200 62640 4.0 3
132 M 2000 2 38400 60960 5.0 3
133 F 2009 3 55200 84960 5.5 1
136 F 1999 1 34200 53400 1.0 3
137 M 1997 1 37800 67320 12.0 3
138 F 2003 1 37440 51120 9.0 3
140 M 2006 4 50640 65040 19.5 3
141 F 2000 2 34560 54120 1.0 3
143 F 2006 3 36000 39600 1.0 3
144 F 2003 1 36840 49320 1.0 3
145 M 1999 2 37800 63000 4.0 3
147 M 2000 2 37200 56880 9.7 3
148 F 2001 2 37680 56760 5.0 3
149 M 1994 1 36600 67200 11.0 3
150 F 2007 4 45186 54720 5.0 3
151 F 2010 1 41400 46920 7.5 3
152 M 1995 4 37200 67800 3.0 3
153 M 1997 4 36960 63120 6.0 3
155 M 1999 4 36600 58560 6.3 3
156 M 1999 3 36000 56640 3.0 3
157 M 1996 4 33000 58800 6.0 3
160 F 1995 4 32640 58800 0.0 3
161 M 1996 1 34800 62280 5.0 3
163 M 1997 2 33960 57720 3.0 3
164 M 2004 4 42000 55320 7.5 3
166 M 2003 4 40800 59880 3.5 3
169 F 2009 3 43800 44520 10.5 3
171 F 1998 1 34200 55560 2.5 3

5BUSINESS INFORMATION SYSTEMS
Assignment 3. Introduction and Variable List:
Table 2: Table of variable identification
Name of
the
Variable
Description of the Variable Types of Variable Sub-type of the
variable
Gender Gender (Sex) indicates an
employee is male or female
Qualitative Variable
(Driscoll et al. 2007)
Nominal
Start Yr The year when working started
in the specified company
Qualitative variable Nominal
Dept The Department when respective
employee worked in
Quantitative Variable Discrete
Start Salary The salary of the employee at
the time of beginning the job
Quantitative variable Continuous
Current
Salary
Present salary of the employee Quantitative variable Continuous
Yrs of Exp The number of years an
employee working in the
company. The more number of
working years, the more is the
years of experience
Quantitative Variable Continuous
Position Type of position held by the
employee
Quantitative Variable Discrete
(Sandelowski 2000)
Assignment 4. Descriptive Statistics:
Table 3: Table of descriptive statistics
Gender/Current
Salary
Average
Current
Salary
Median
Current
Salary
Standard
Deviation of
Current Salary
Female 58503.75 56160 13131.66
Male 63268.24 61920 9363.13
(Vergura et al. 2009)
The average income of female employees is lesser than the average income of the
male employees. Females incomes ($58503.75) lesser amount of salary than males
($63268.24) (Bickel and Lehmann 2012). The median of the current salary of employees is
also greater for males ($61920) than females ($56160). That is 50% of the female employees
and 50% of the male employees earns below and above the salary limits $61920 and $56160
respectively. The scatter ness of the current salaries in terms of standard deviation is higher
for female employees ($13131.66) than the current salaries of male employees ($9363.13). It
indicates that the current salary values are more scattered for females than males.
You're viewing a preview
Unlock full access by subscribing today!

6BUSINESS INFORMATION SYSTEMS
Assignment 5. Box plot and Histogram:
Figure 1: Grouped box plot of “Current salary” for both Male and Female employees
Current salary of
males
Current salary of
females
0.00
20000.00
40000.00
60000.00
80000.00
100000.00
120000.00
Box plot of current salary
Gender
Current salary
Figure 2: Histogram of “Current Salary” of Female employees
10000 20000 30000 40000 50000 60000 70000 80000 90000 100000 110000 120000 130000
0
2
4
6
8
10
12
14
16
Current salary of females
Class intervals of Current Salary
Frequency
Paraphrase This Document
Need a fresh take? Get an instant paraphrase of this document with our AI Paraphraser

7BUSINESS INFORMATION SYSTEMS
Figure 3: Histogram of “Current Salaries” of Male employees
10000 20000 30000 40000 50000 60000 70000 80000 90000 100000 110000 120000 130000
0
5
10
15
20
25
30
35
40
Current salary of males
Class intervals of current salary
Frequency
Figure 3: Histogram of “Current Salaries” of Male employees
10000 20000 30000 40000 50000 60000 70000 80000 90000 100000 110000 120000 130000
0
5
10
15
20
25
30
35
40
Current salary of males
Class intervals of current salary
Frequency

8BUSINESS INFORMATION SYSTEMS
References:
Bickel, P.J. and Lehmann, E.L., 2012. Descriptive statistics for nonparametric models II.
Location. In Selected Works of EL Lehmann (pp. 473-497). Springer, Boston, MA.
Driscoll, D.L., Appiah-Yeboah, A., Salib, P. and Rupert, D.J., 2007. Merging qualitative and
quantitative data in mixed methods research: How to and why not. Ecological and
Environmental Anthropology (University of Georgia), p.18.
Sandelowski, M., 2000. Combining qualitative and quantitative sampling, data collection, and
analysis techniques in mixed‐method studies. Research in nursing & health, 23(3), pp.246-
255.
Vergura, S., Acciani, G., Amoruso, V., Patrono, G.E. and Vacca, F., 2009. Descriptive and
inferential statistics for supervising and monitoring the operation of PV plants. IEEE
Transactions on Industrial Electronics, 56(11), pp.4456-4464.
You're viewing a preview
Unlock full access by subscribing today!
1 out of 9
Related Documents

Your All-in-One AI-Powered Toolkit for Academic Success.
+13062052269
info@desklib.com
Available 24*7 on WhatsApp / Email
Unlock your academic potential
© 2024 | Zucol Services PVT LTD | All rights reserved.