CIS8008 Business Intelligence: House Price Analysis with RapidMiner

Verified

Added on  2024/05/23

|18
|1932
|187
Report
AI Summary
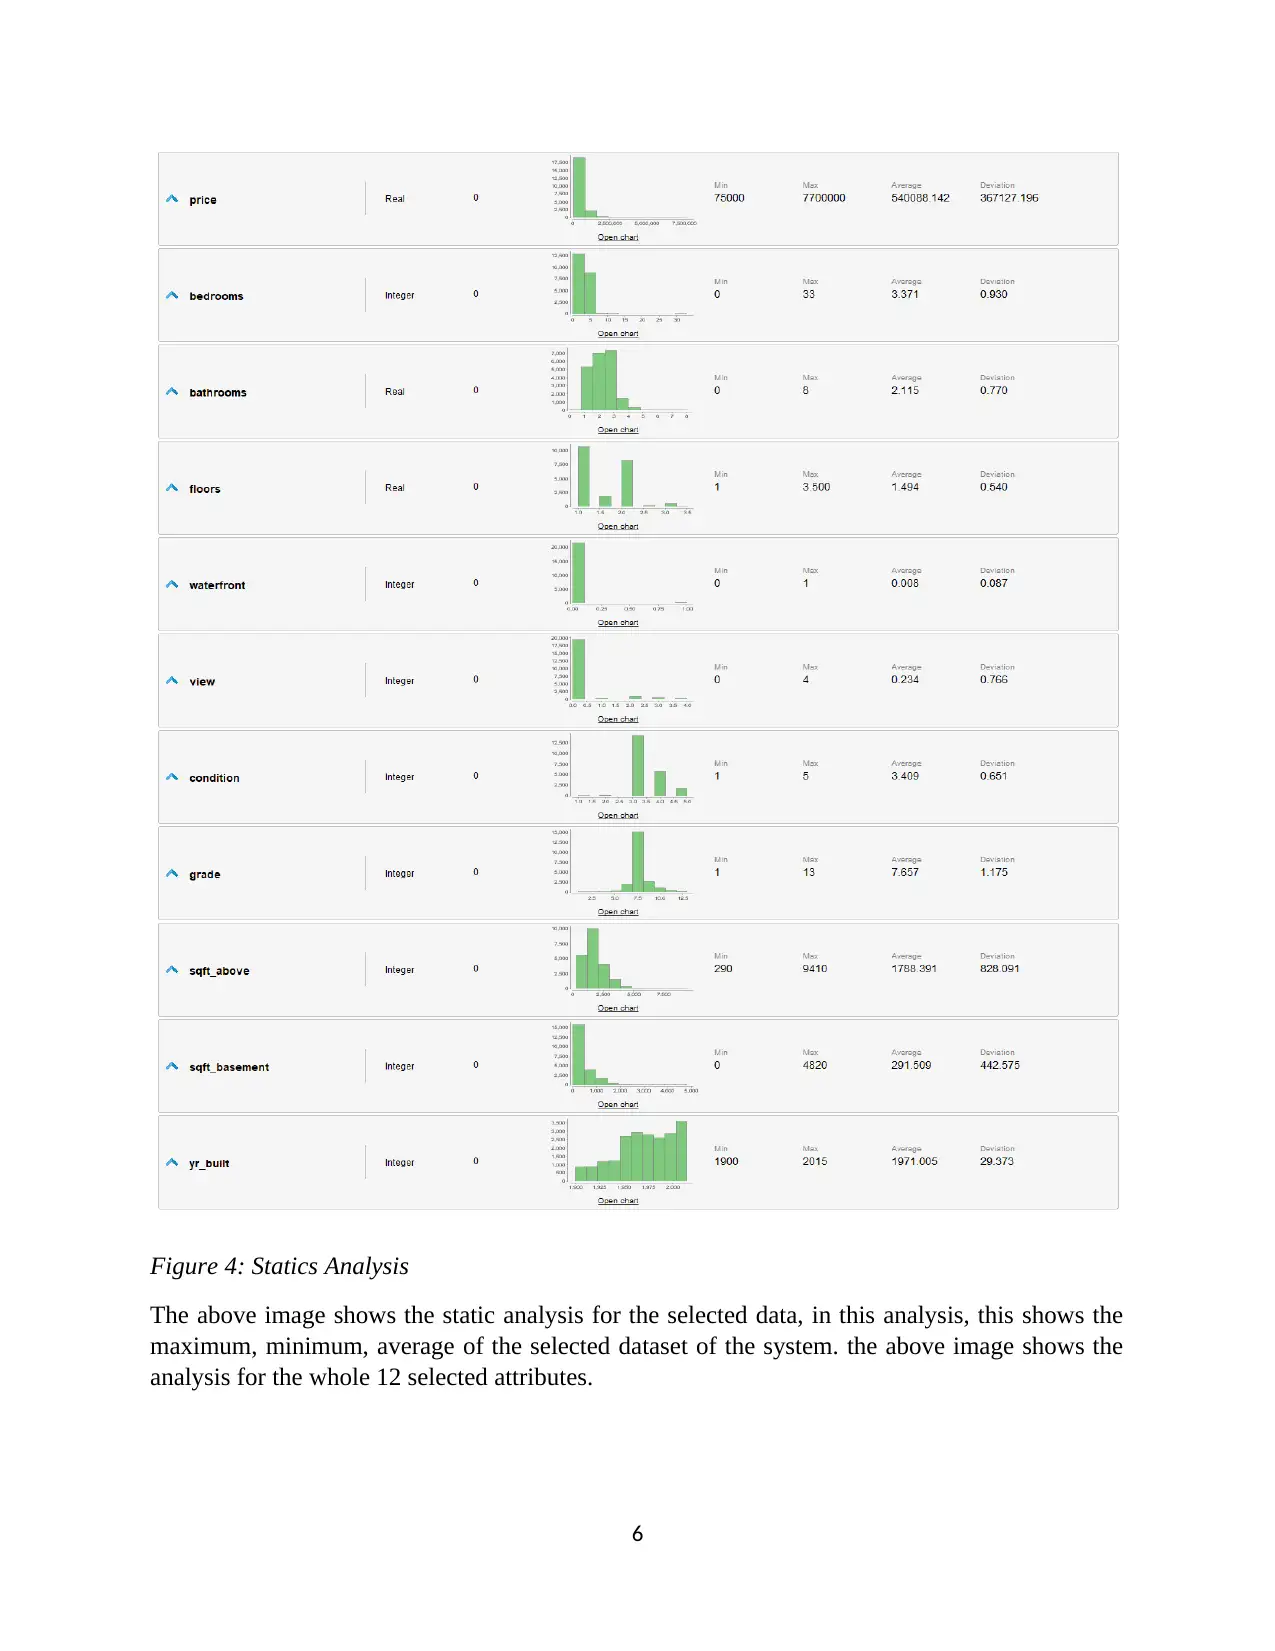
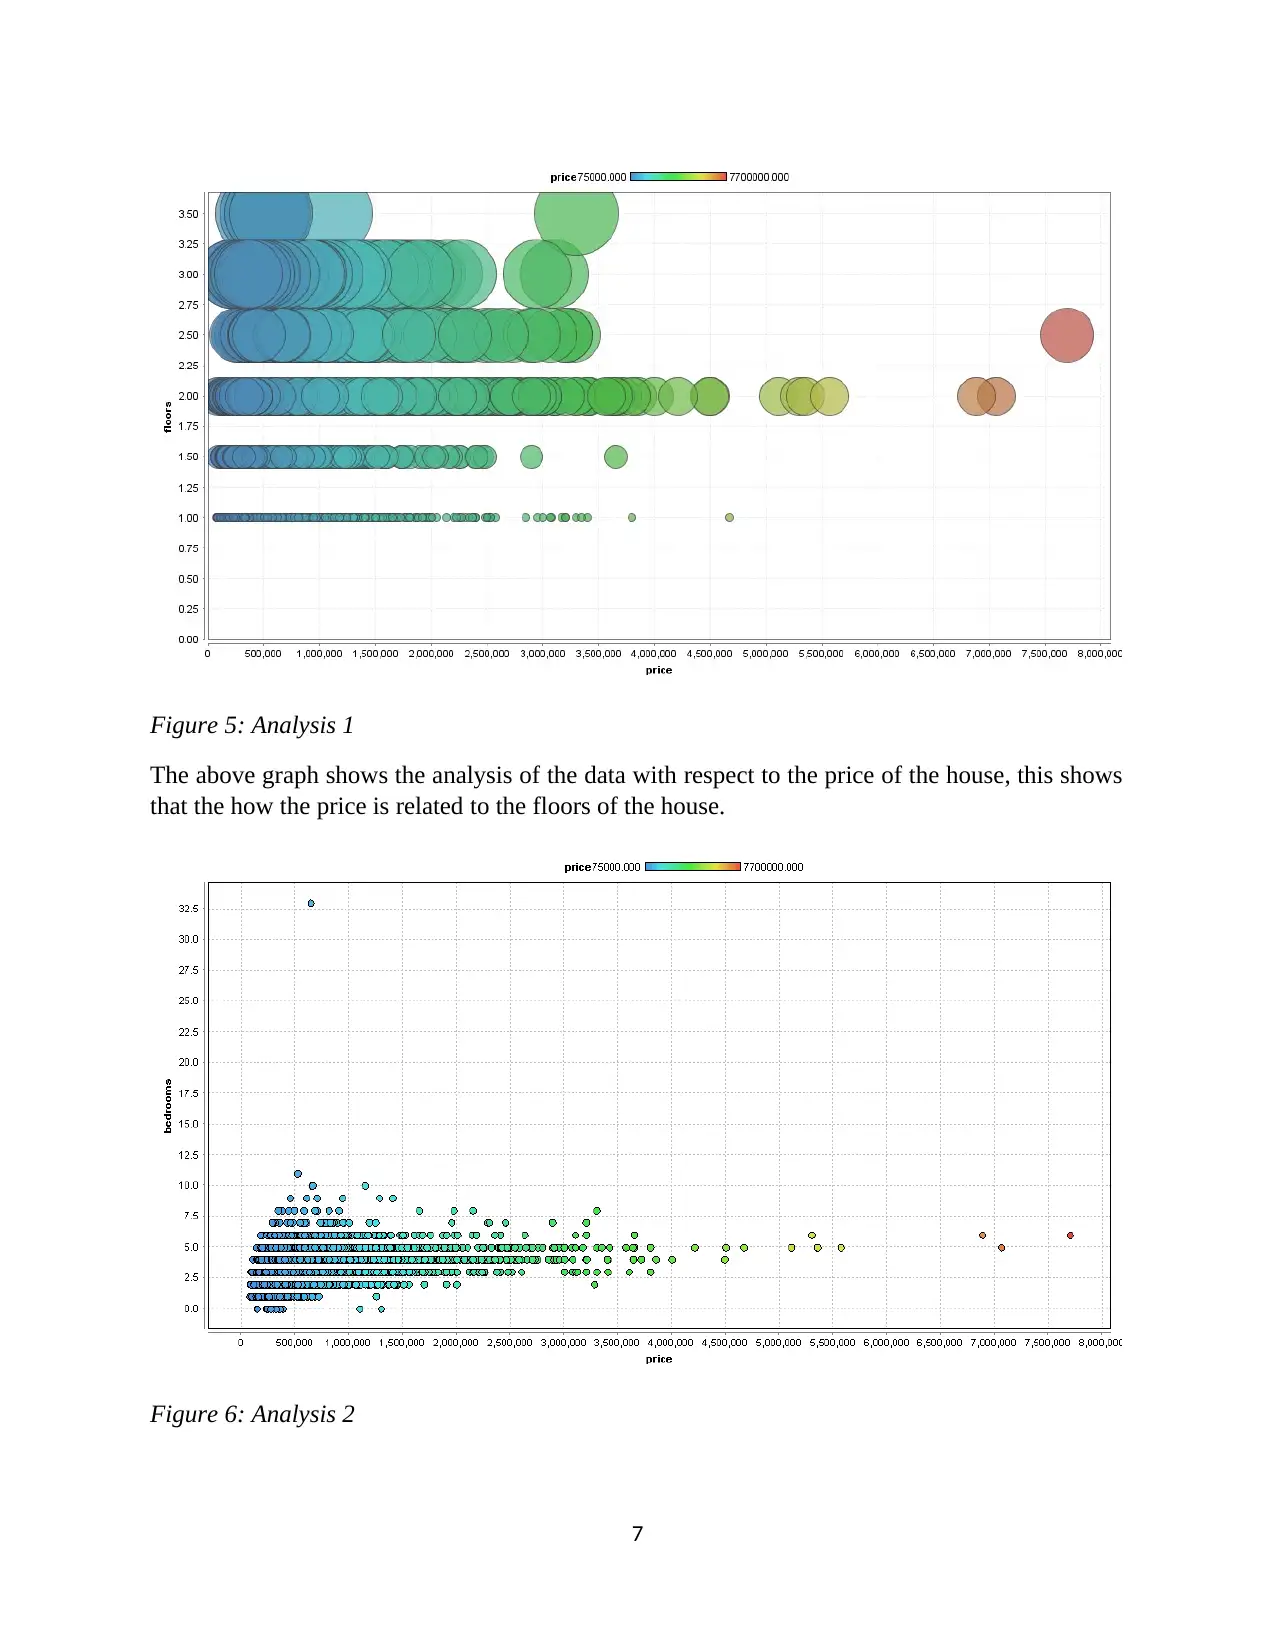
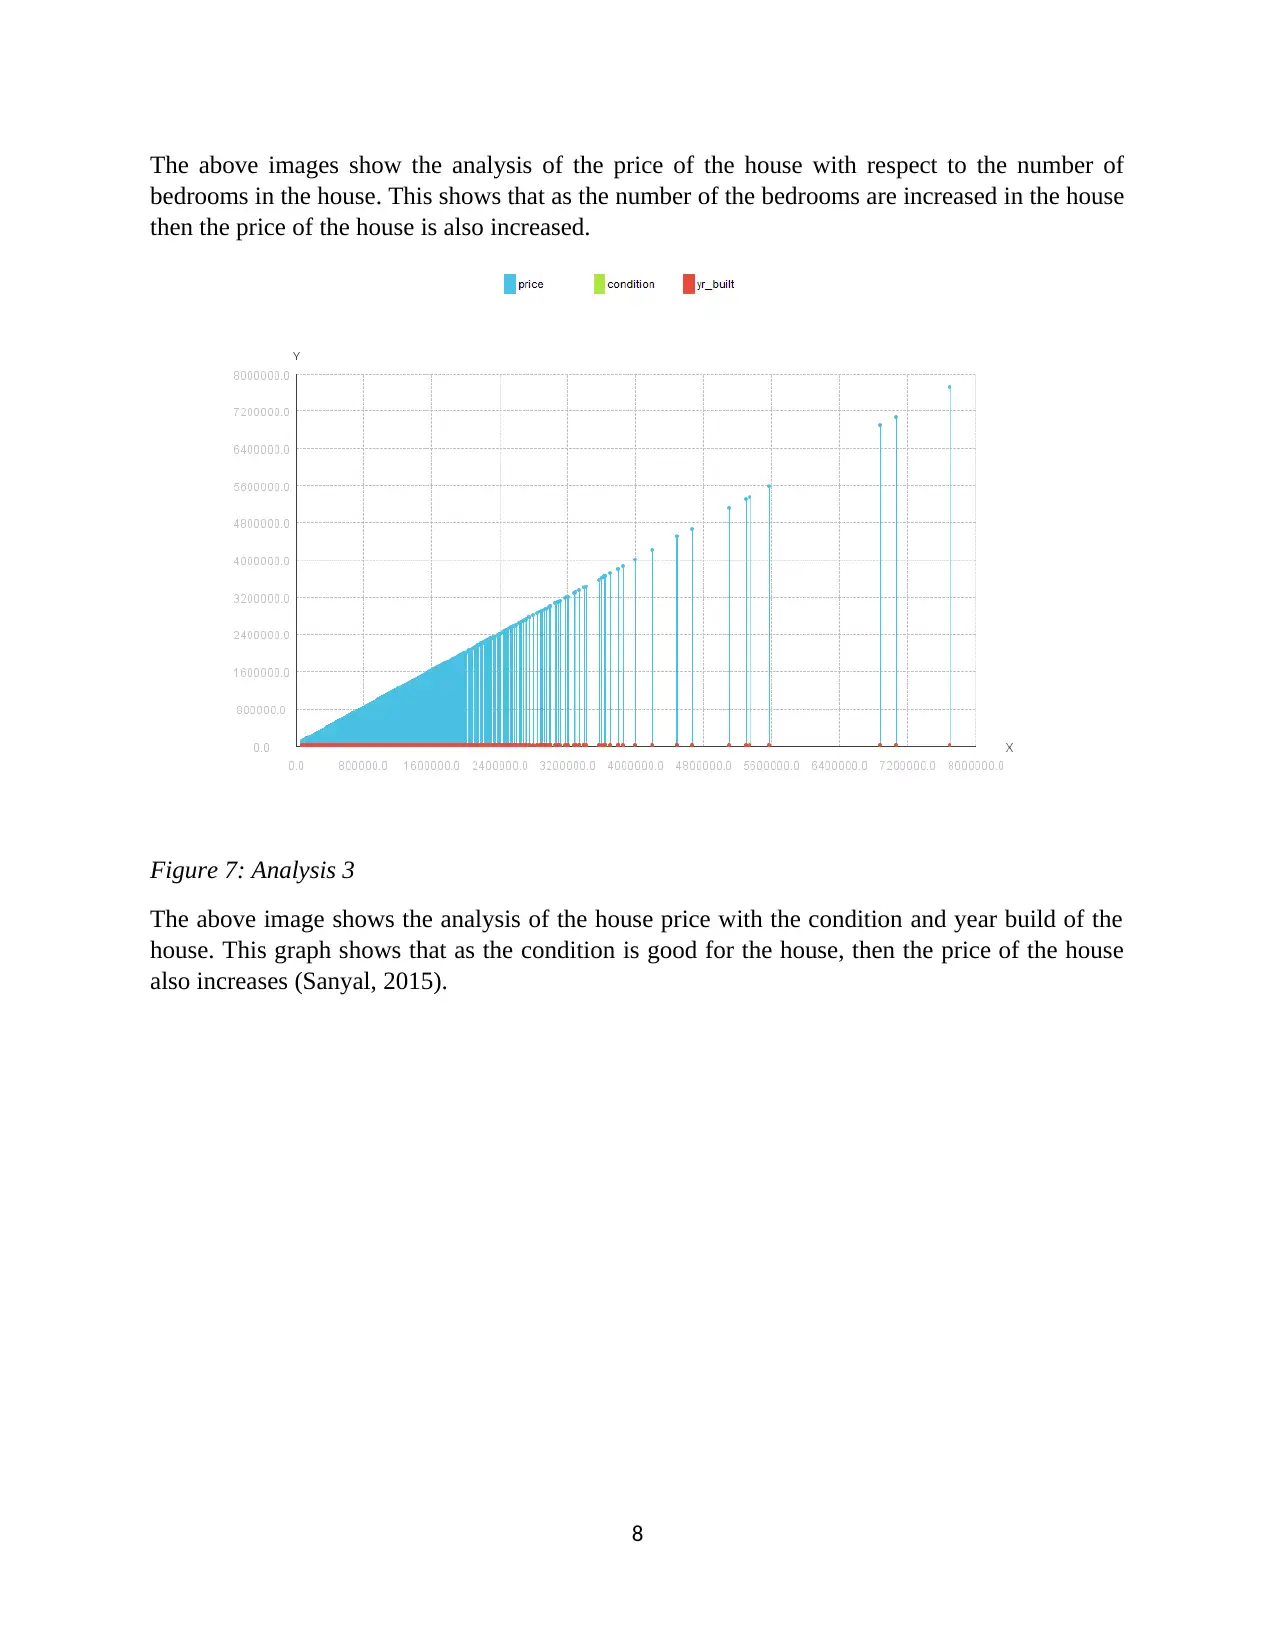
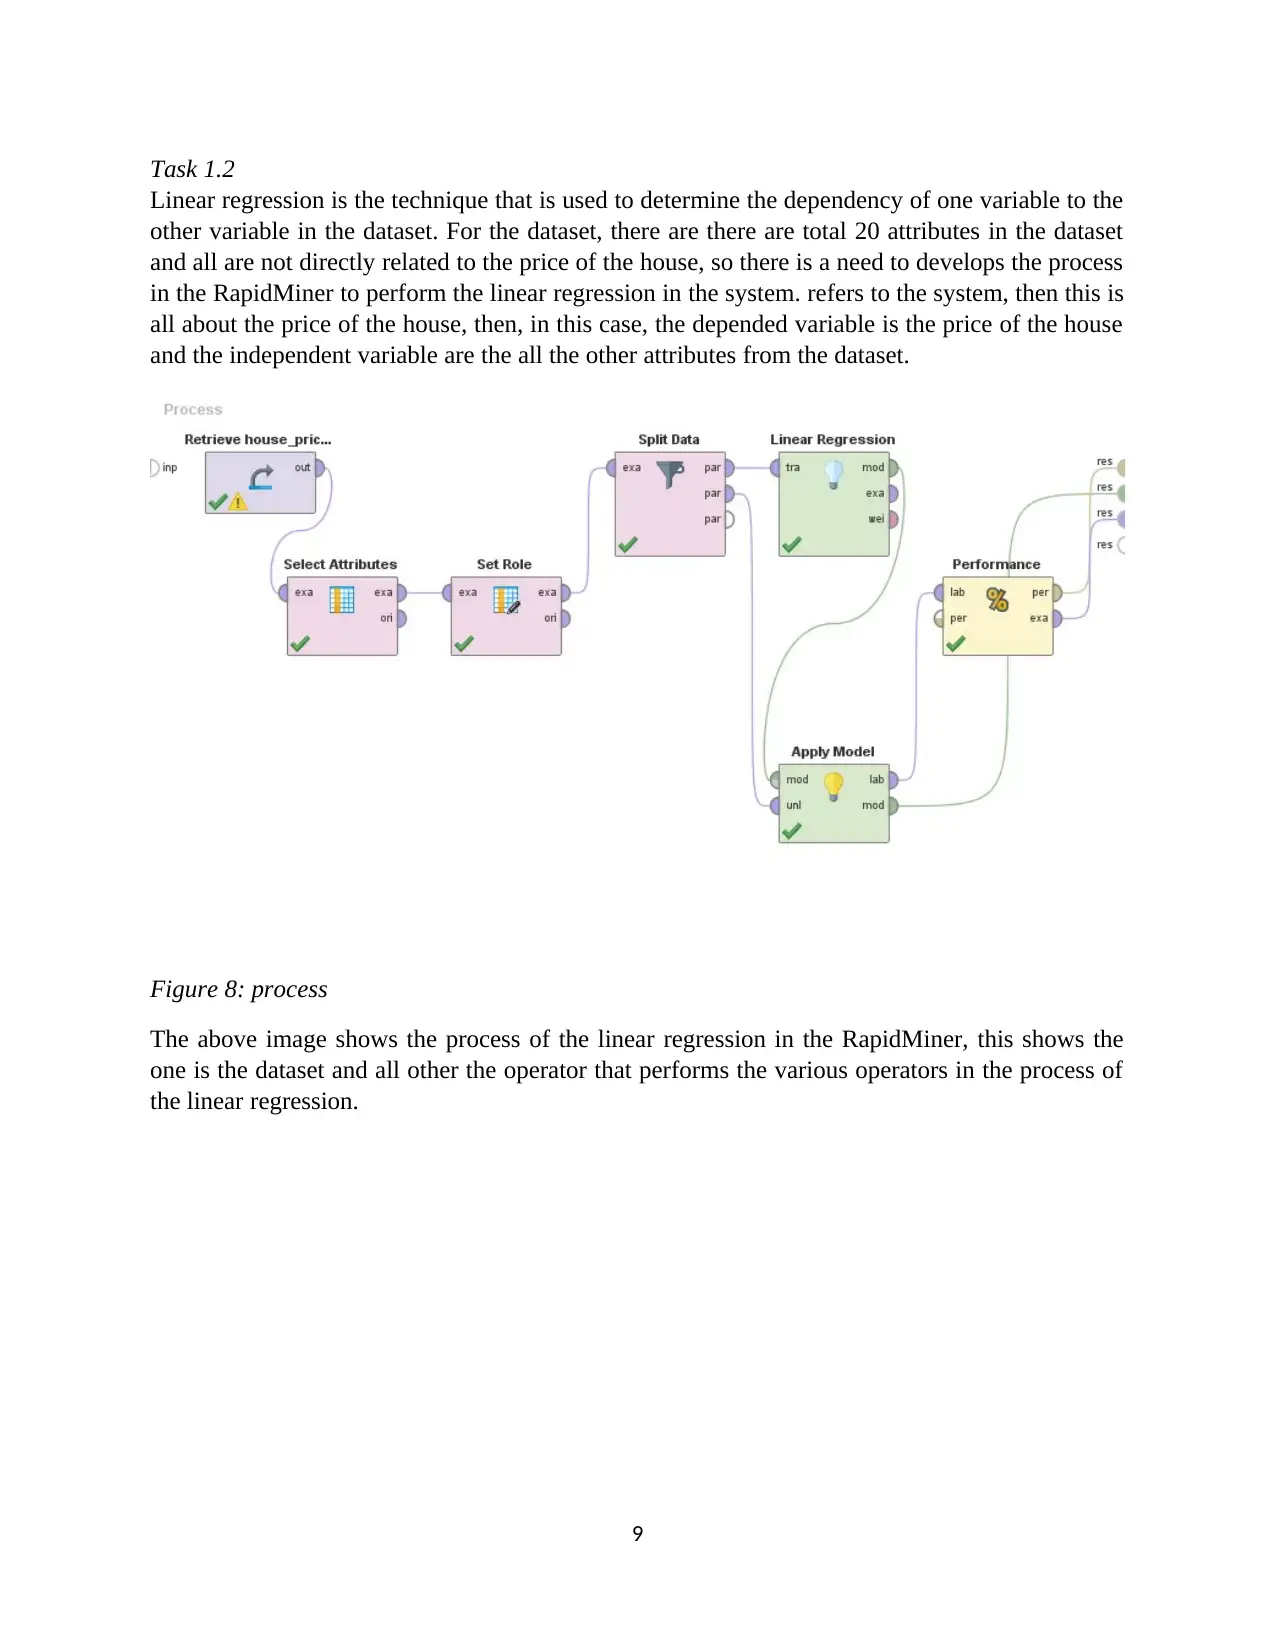
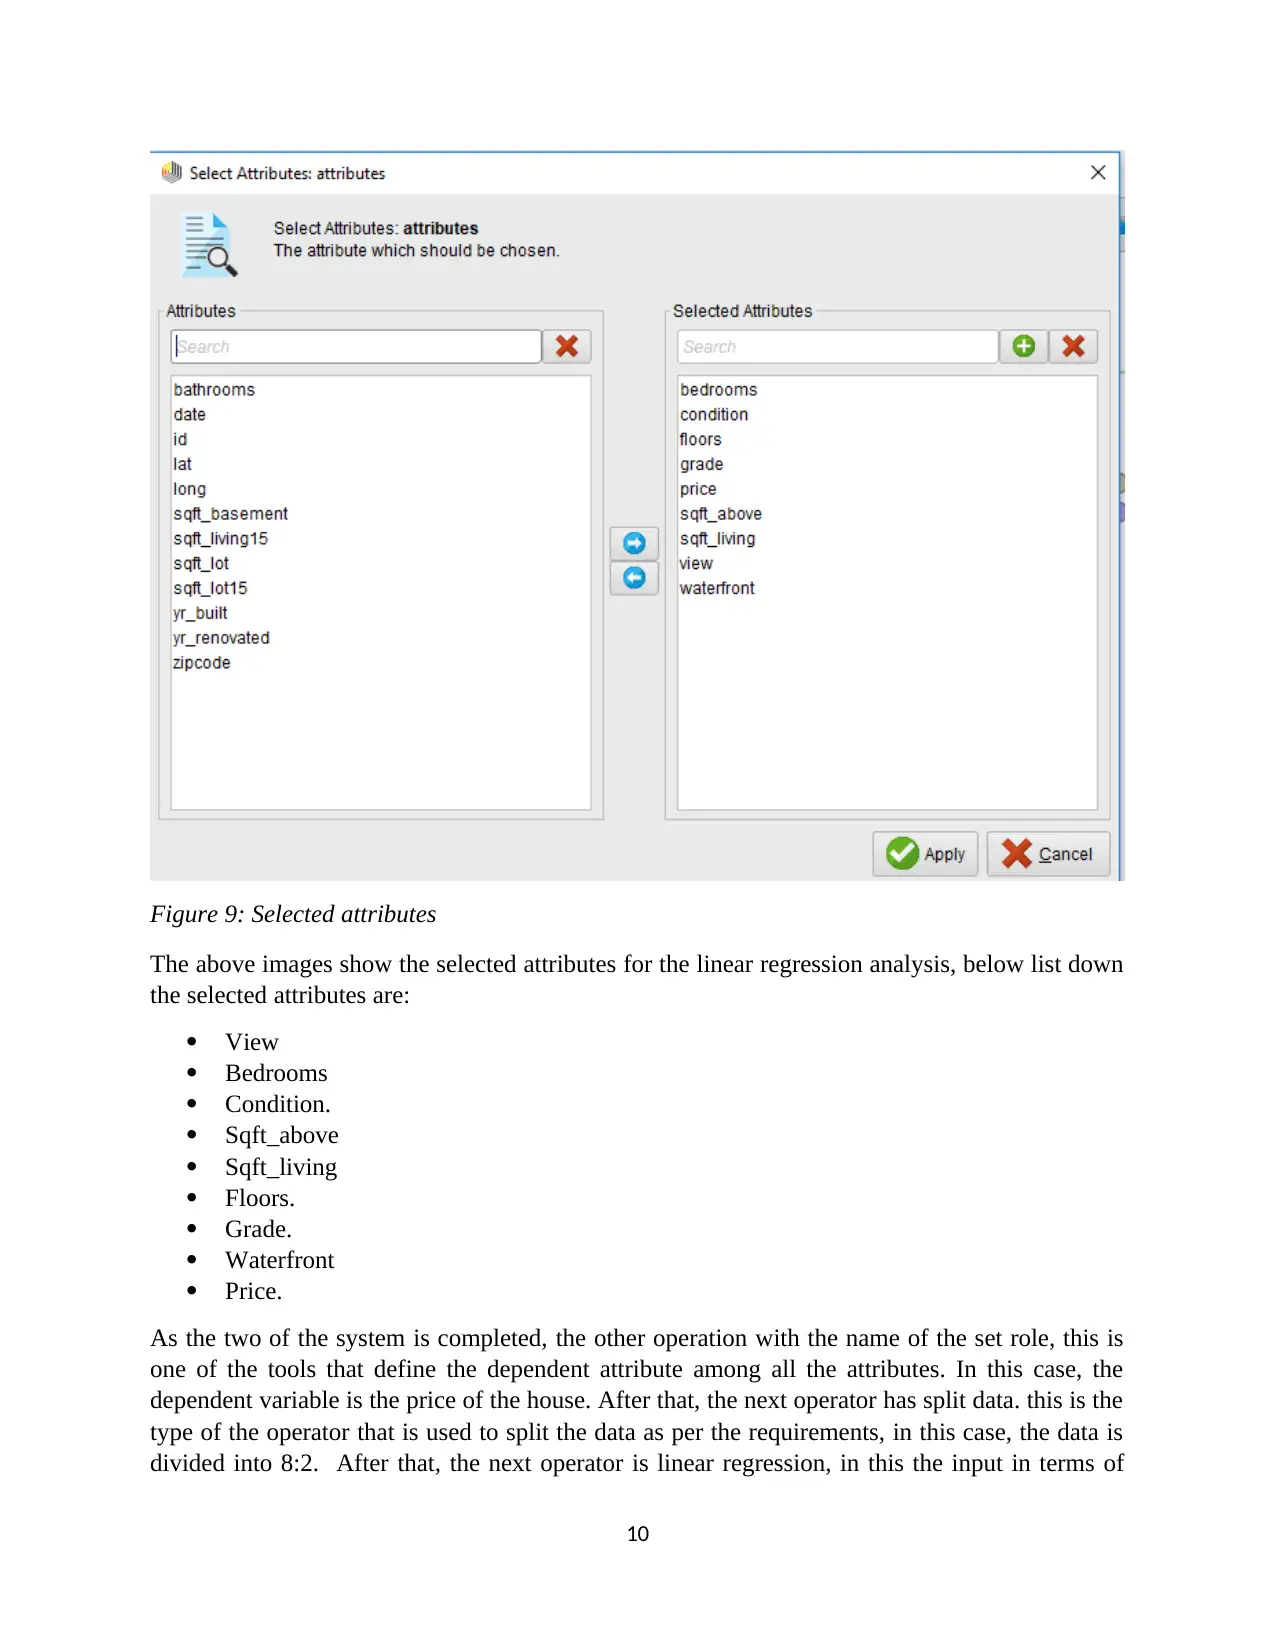
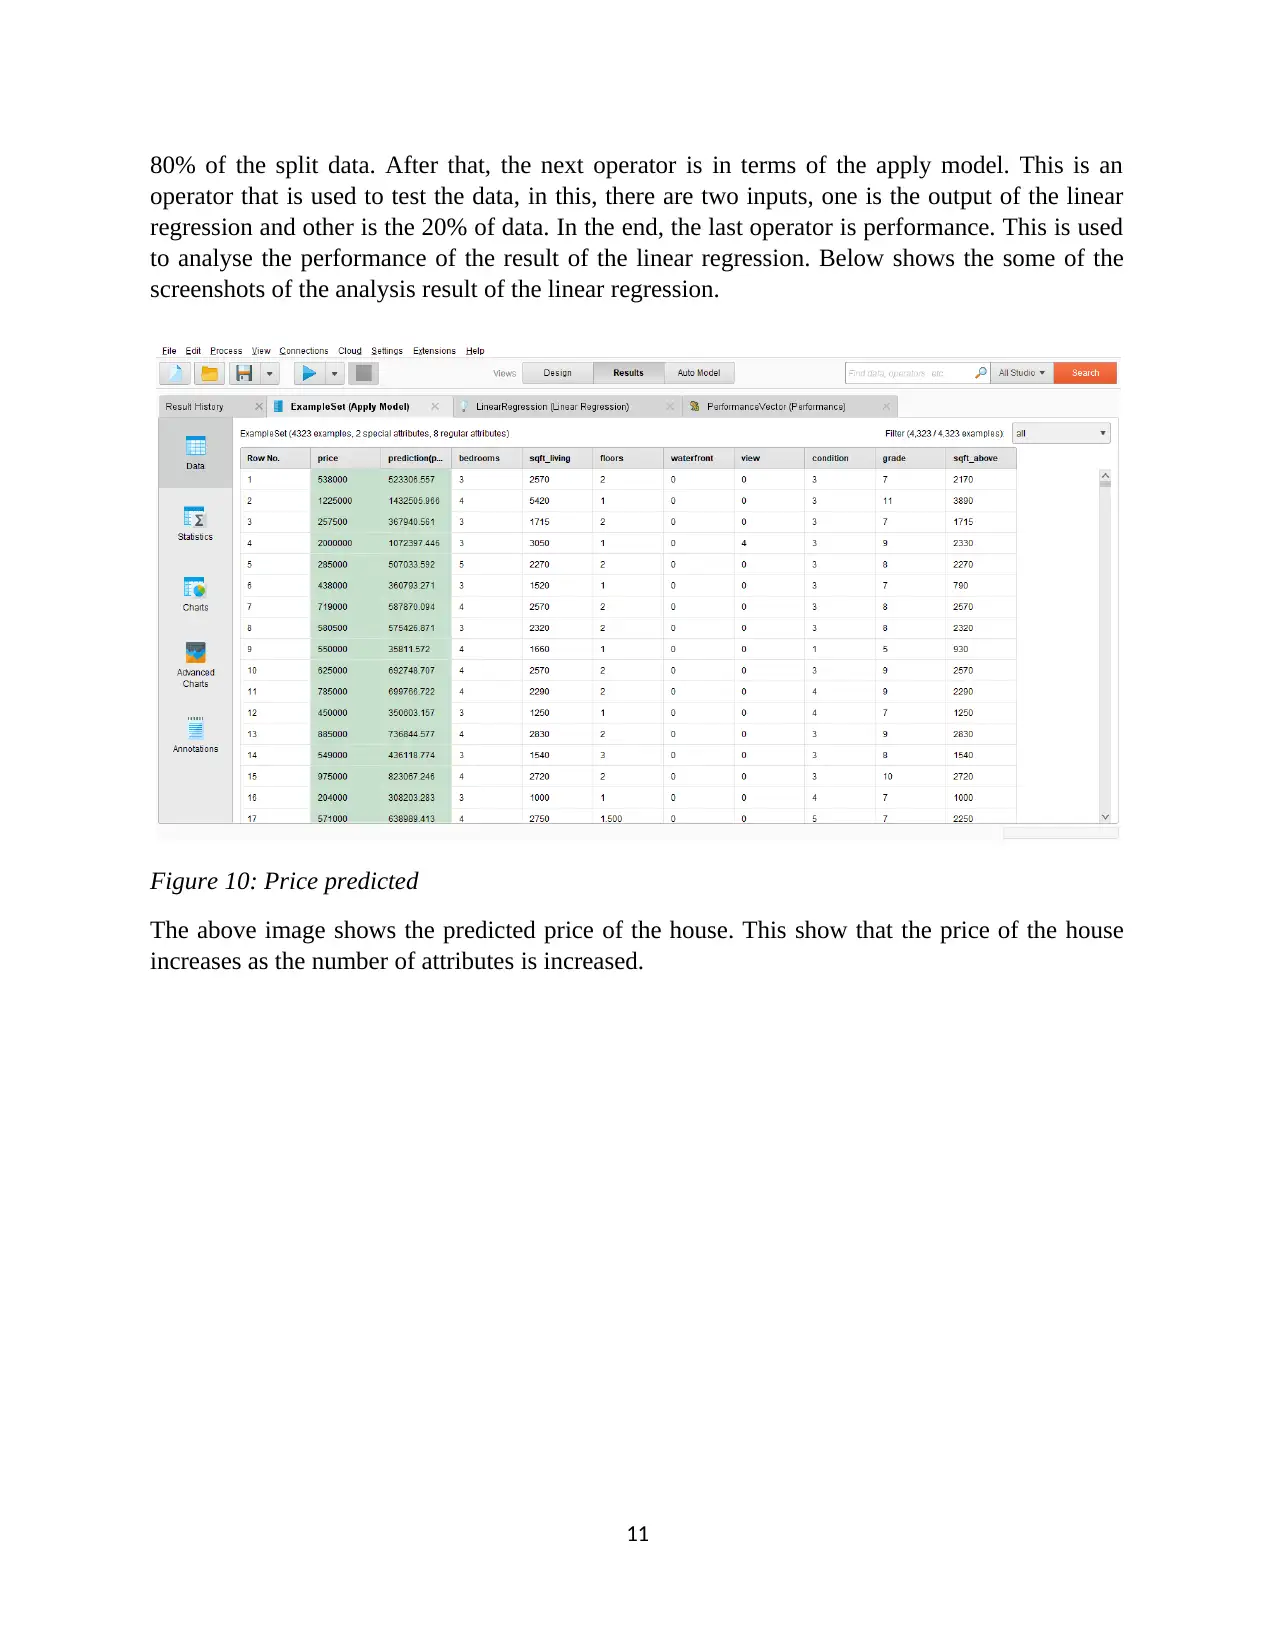
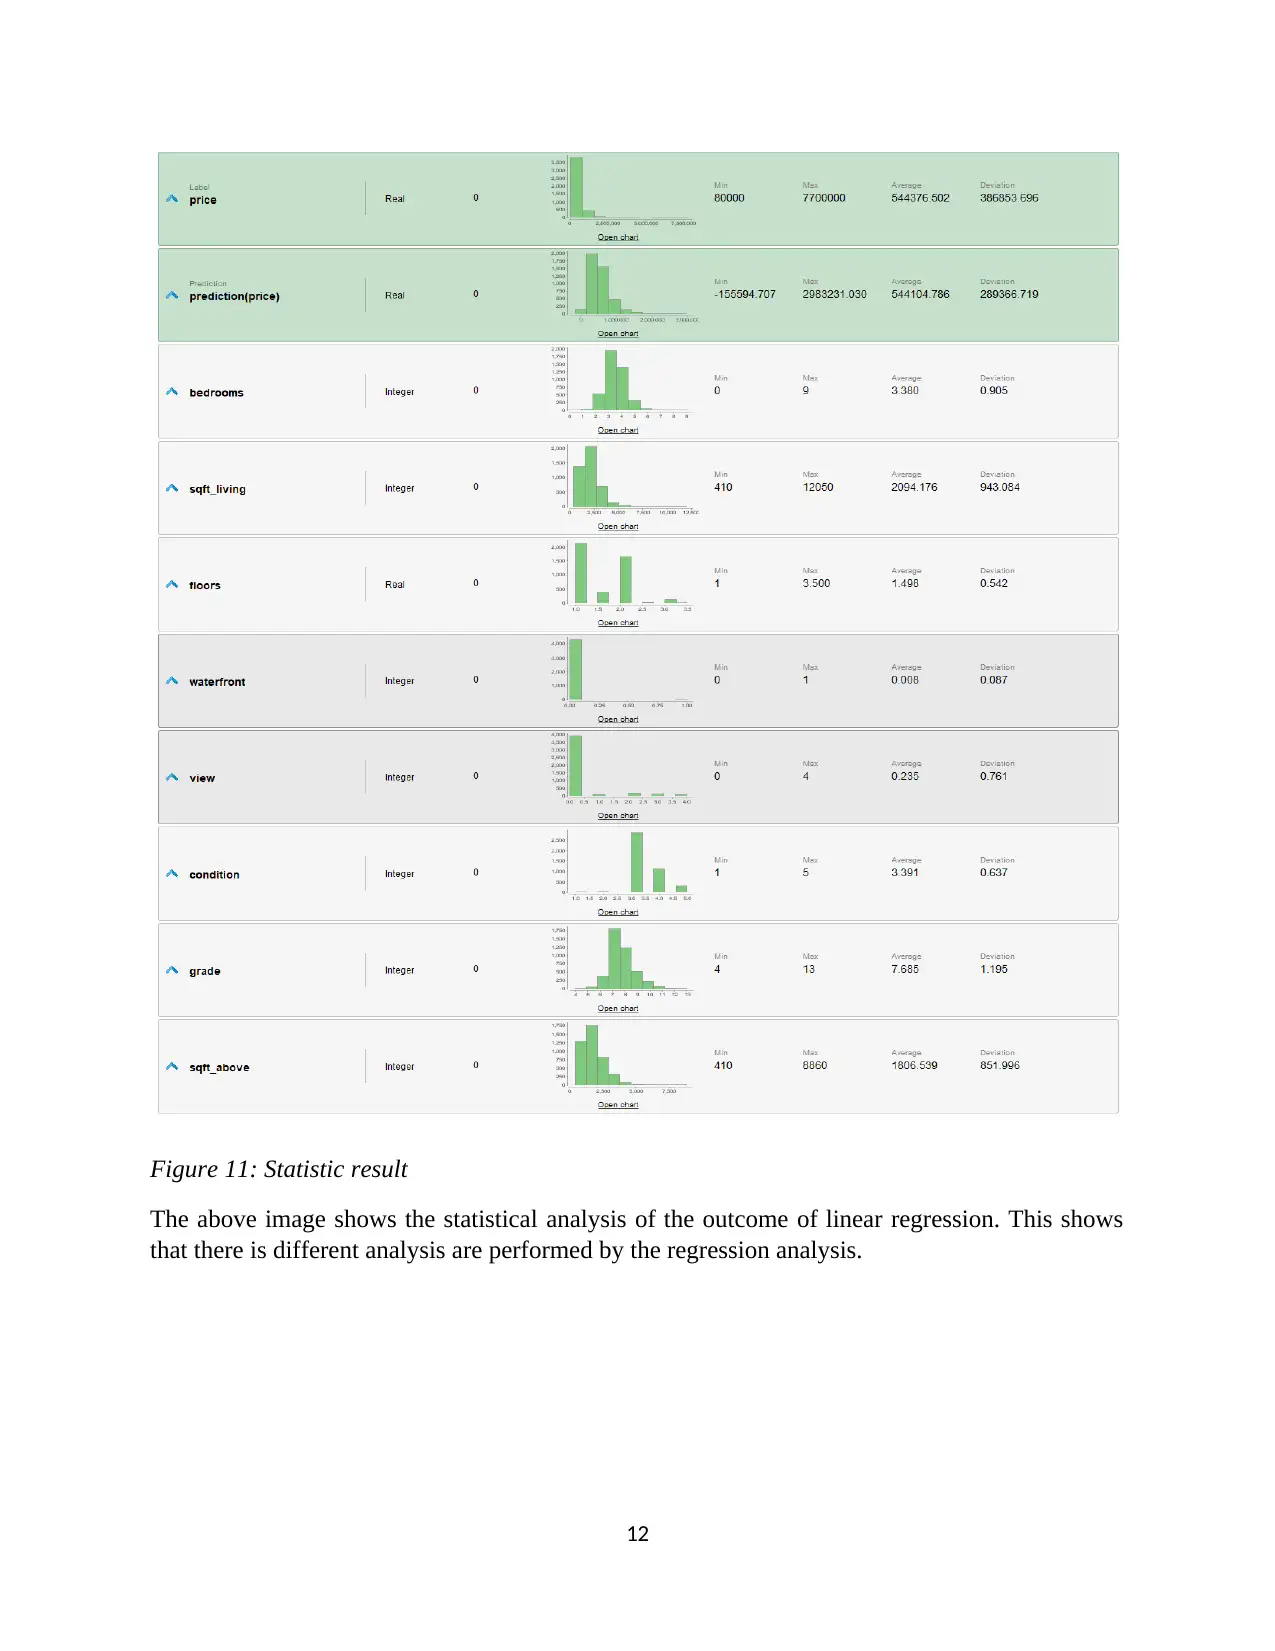
This report presents a business intelligence analysis of house prices using RapidMiner and Tableau. The analysis includes exploratory data analysis (EDA) using RapidMiner to understand the key attributes affecting house prices, such as bathrooms, bedrooms, condition, floors, grades, price, sqft_above, sqft_basement, view, waterfront, and year built. Linear regression is performed in RapidMiner to predict house prices based on selected attributes like view, bedrooms, condition, sqft_above, sqft_living, floors, grade and waterfront. The report also includes a geographical analysis using Tableau, visualizing house prices based on longitude and latitude. The analysis provides insights into the relationship between house prices, house attributes, and location.
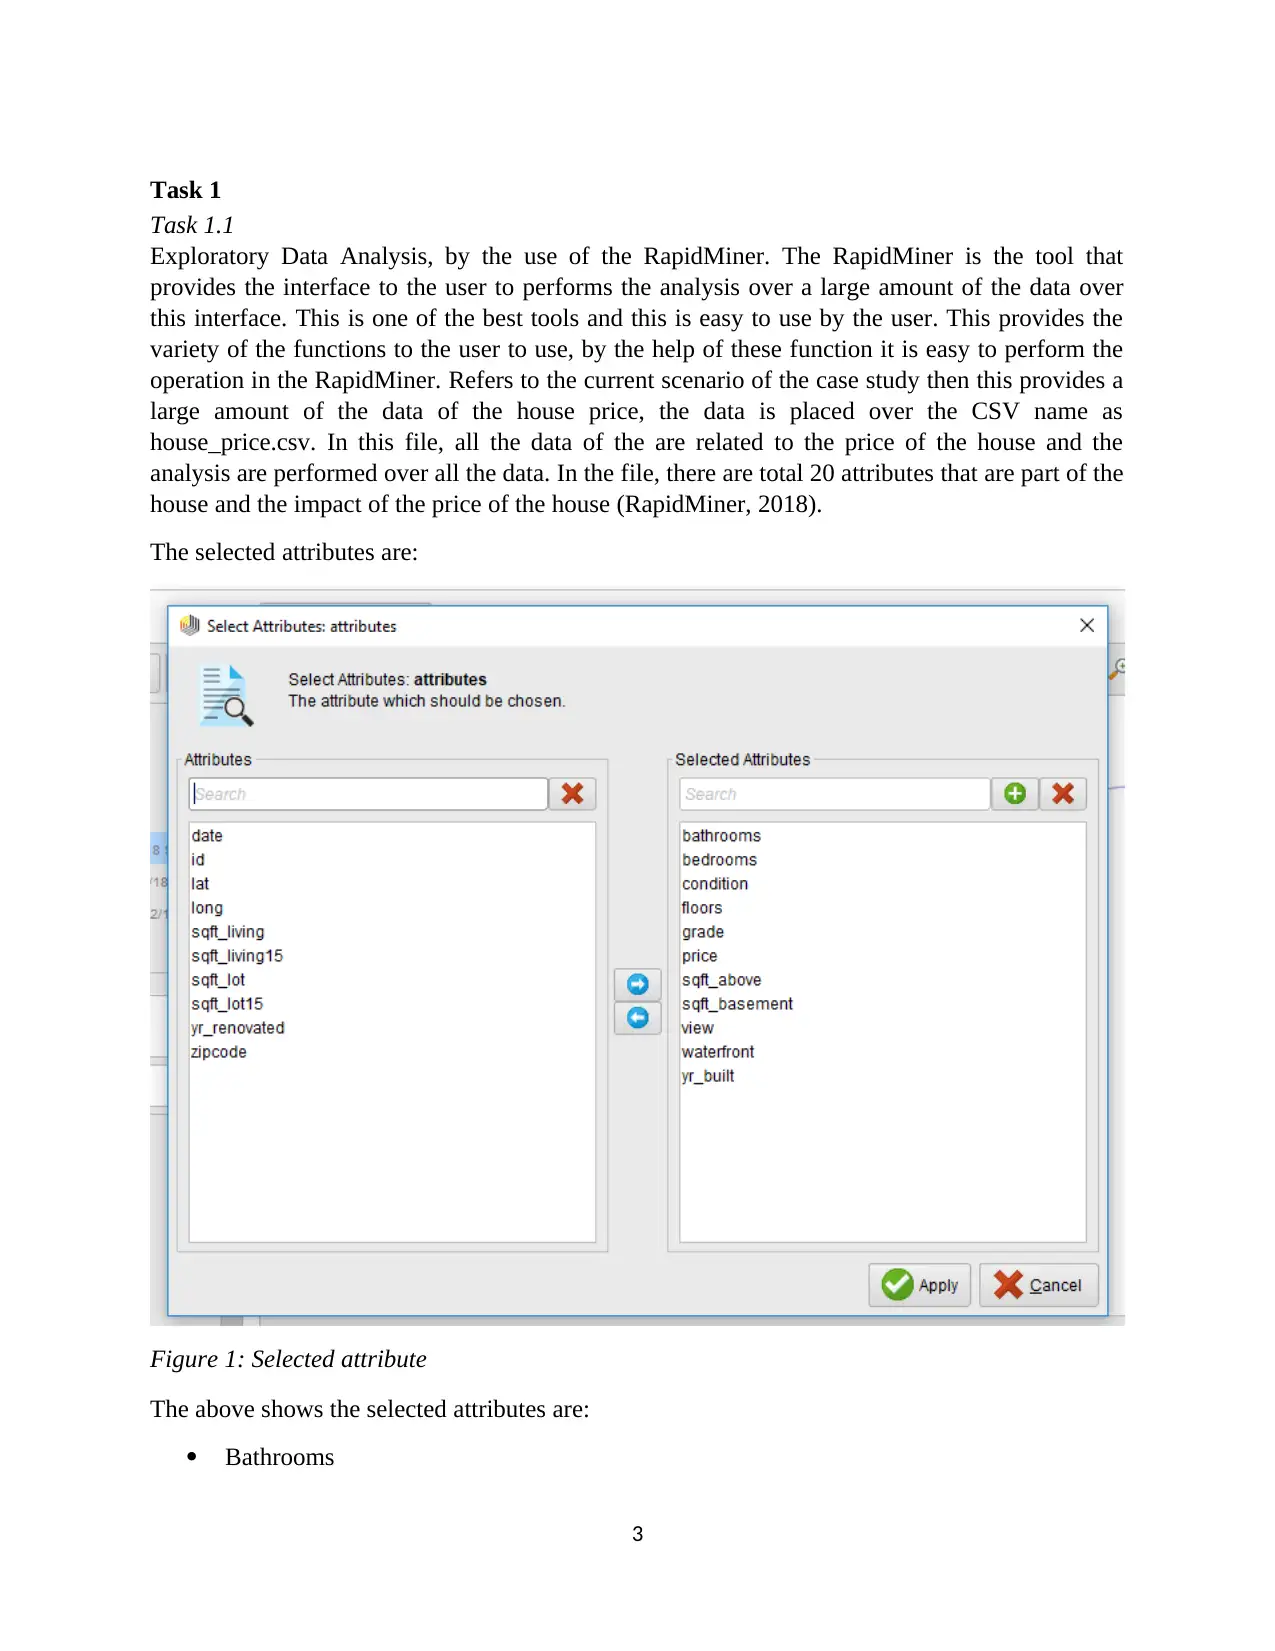
Document Page
CIS8008
Business Intelligence
Assessment 2
Student Name: Maninder Singh
Student ID: U1092651
1
tabler-icon-diamond-filled.svg

Paraphrase This Document

Need a fresh take? Get an instant paraphrase of this document with our AI Paraphraser
Document Page
Contents
Task 1...............................................................................................................................................3
Task 1.1........................................................................................................................................3
Task 1.2........................................................................................................................................9
Task 2.............................................................................................................................................15
Task 2.1......................................................................................................................................15
Task 2.2......................................................................................................................................16
References......................................................................................................................................18
Appendix........................................................................................................................................19
2
Document Page
Task 1
Task 1.1
Exploratory Data Analysis, by the use of the RapidMiner. The RapidMiner is the tool that
provides the interface to the user to performs the analysis over a large amount of the data over
this interface. This is one of the best tools and this is easy to use by the user. This provides the
variety of the functions to the user to use, by the help of these function it is easy to perform the
operation in the RapidMiner. Refers to the current scenario of the case study then this provides a
large amount of the data of the house price, the data is placed over the CSV name as
house_price.csv. In this file, all the data of the are related to the price of the house and the
analysis are performed over all the data. In the file, there are total 20 attributes that are part of the
house and the impact of the price of the house (RapidMiner, 2018).
The selected attributes are:
Figure 1: Selected attribute
The above shows the selected attributes are:
Bathrooms
3
Document Page
Bedrooms
Conditions
Floors
Grades
Price
Sqft_above
Sqft_basement
View
Waterfront
Yr_build
These are the attributes that are required to analyse the price of the house. The process of the
analysis is shown below (RapidMiner, 2018)
Figure 2: Process step
Refers to the above image then this shows the process of the performs the Exploratory Data
Analysis by the use of the RapidMiner. In this process then there are two systems are present one
is the dataset of the house price and other is the select attributes from the dataset. In the dataset,
there are total 20 attributes, but by the use of the select attributes, there are total 11 attributes
selected for the analysis.
After that, the analysis is performed over the RapidMiner, below shows the screenshots of the
analysis.
4
tabler-icon-diamond-filled.svg

Paraphrase This Document

Need a fresh take? Get an instant paraphrase of this document with our AI Paraphraser
Document Page
Figure 3: Sample data
The above image shows the data after apply the select attributes in the whole dataset. The image
shows the data for the analysis and this is the data that are directly related to the price of the
house.
5
Document Page
Figure 4: Statics Analysis
The above image shows the static analysis for the selected data, in this analysis, this shows the
maximum, minimum, average of the selected dataset of the system. the above image shows the
analysis for the whole 12 selected attributes.
6
Document Page
Figure 5: Analysis 1
The above graph shows the analysis of the data with respect to the price of the house, this shows
that the how the price is related to the floors of the house.
Figure 6: Analysis 2
7
tabler-icon-diamond-filled.svg

Paraphrase This Document

Need a fresh take? Get an instant paraphrase of this document with our AI Paraphraser
Document Page
The above images show the analysis of the price of the house with respect to the number of
bedrooms in the house. This shows that as the number of the bedrooms are increased in the house
then the price of the house is also increased.
Figure 7: Analysis 3
The above image shows the analysis of the house price with the condition and year build of the
house. This graph shows that as the condition is good for the house, then the price of the house
also increases (Sanyal, 2015).
8
Document Page
Task 1.2
Linear regression is the technique that is used to determine the dependency of one variable to the
other variable in the dataset. For the dataset, there are there are total 20 attributes in the dataset
and all are not directly related to the price of the house, so there is a need to develops the process
in the RapidMiner to perform the linear regression in the system. refers to the system, then this is
all about the price of the house, then, in this case, the depended variable is the price of the house
and the independent variable are the all the other attributes from the dataset.
Figure 8: process
The above image shows the process of the linear regression in the RapidMiner, this shows the
one is the dataset and all other the operator that performs the various operators in the process of
the linear regression.
9
Document Page
Figure 9: Selected attributes
The above images show the selected attributes for the linear regression analysis, below list down
the selected attributes are:
View
Bedrooms
Condition.
Sqft_above
Sqft_living
Floors.
Grade.
Waterfront
Price.
As the two of the system is completed, the other operation with the name of the set role, this is
one of the tools that define the dependent attribute among all the attributes. In this case, the
dependent variable is the price of the house. After that, the next operator has split data. this is the
type of the operator that is used to split the data as per the requirements, in this case, the data is
divided into 8:2. After that, the next operator is linear regression, in this the input in terms of
10
tabler-icon-diamond-filled.svg

Paraphrase This Document

Need a fresh take? Get an instant paraphrase of this document with our AI Paraphraser
Document Page
80% of the split data. After that, the next operator is in terms of the apply model. This is an
operator that is used to test the data, in this, there are two inputs, one is the output of the linear
regression and other is the 20% of data. In the end, the last operator is performance. This is used
to analyse the performance of the result of the linear regression. Below shows the some of the
screenshots of the analysis result of the linear regression.
Figure 10: Price predicted
The above image shows the predicted price of the house. This show that the price of the house
increases as the number of attributes is increased.
11
Document Page
Figure 11: Statistic result
The above image shows the statistical analysis of the outcome of linear regression. This shows
that there is different analysis are performed by the regression analysis.
12
chevron_up_icon
1 out of 18
circle_padding
hide_on_mobile
zoom_out_icon
[object Object]