Business Intelligence: Analyzing Feasibility of New Cloud Software

Verified

Added on  2023/06/13

|17
|2889
|177
Report
AI Summary
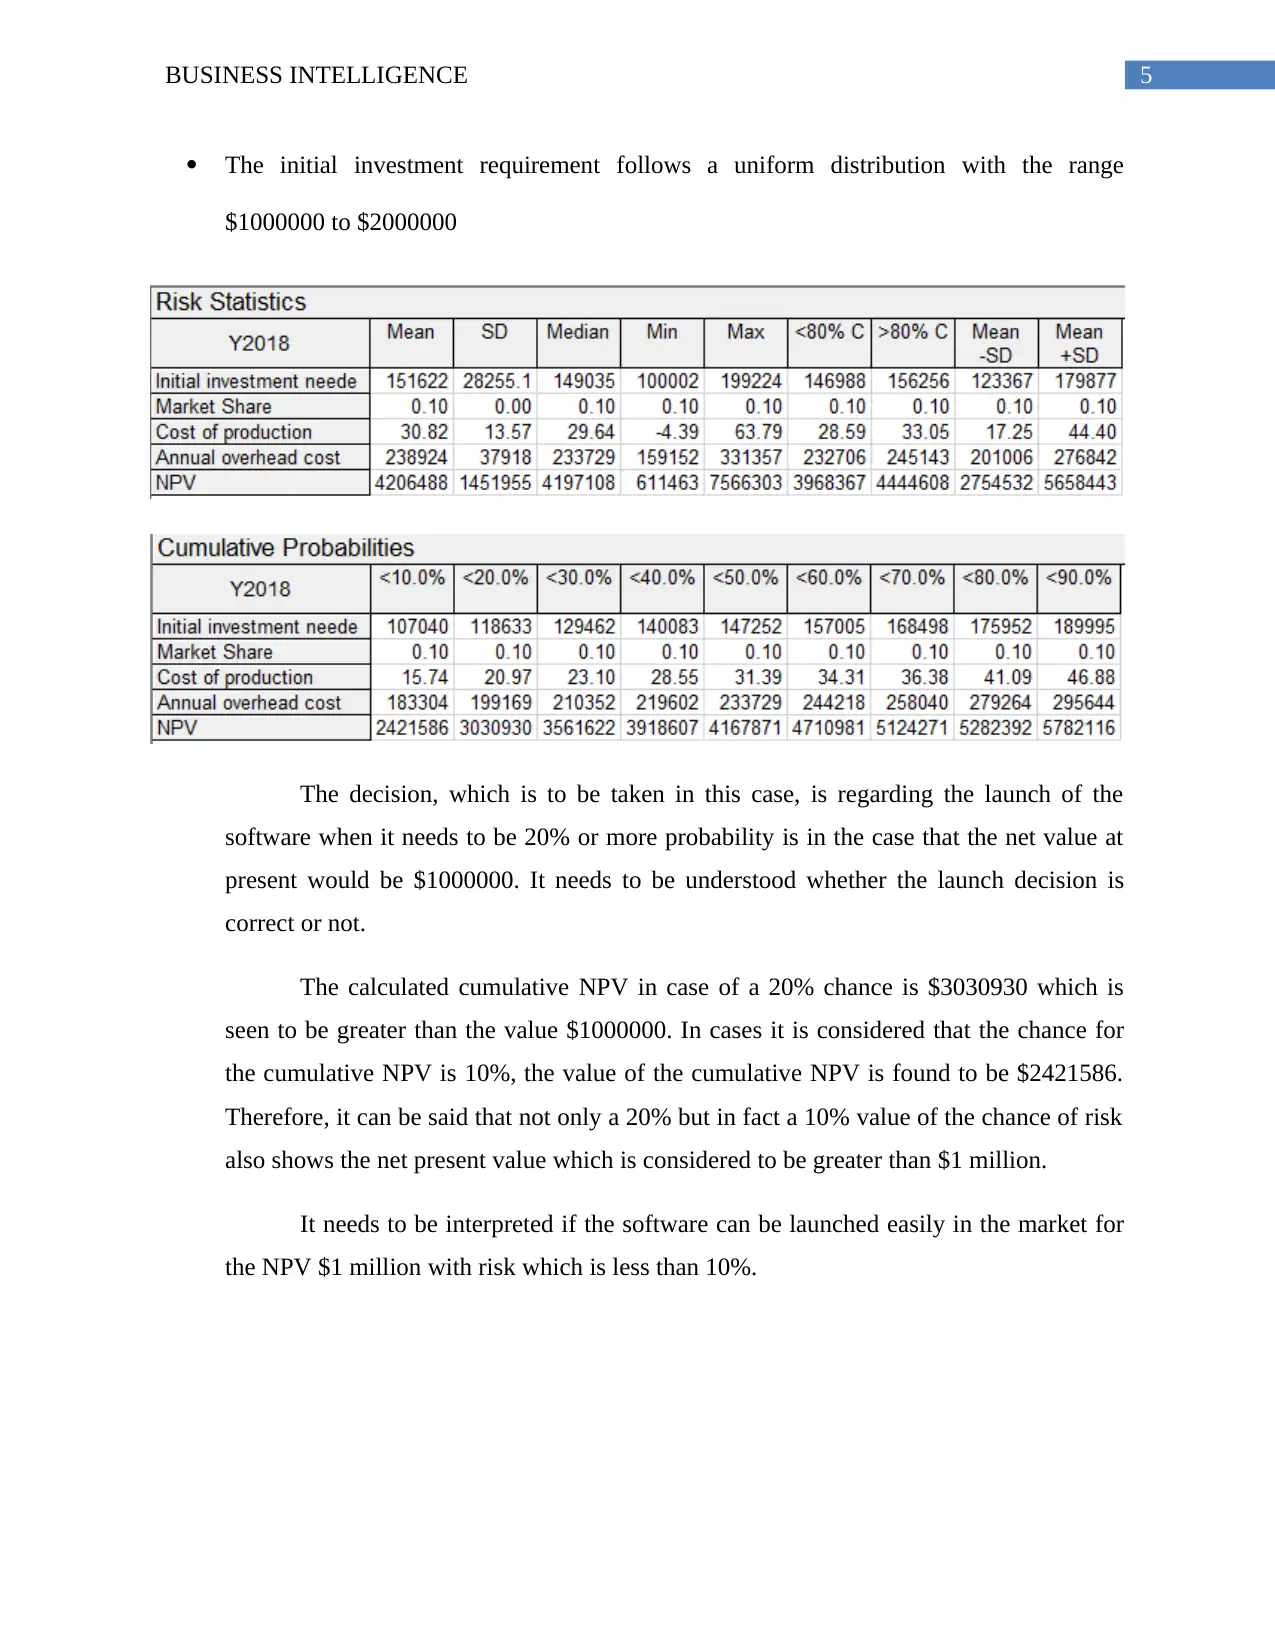
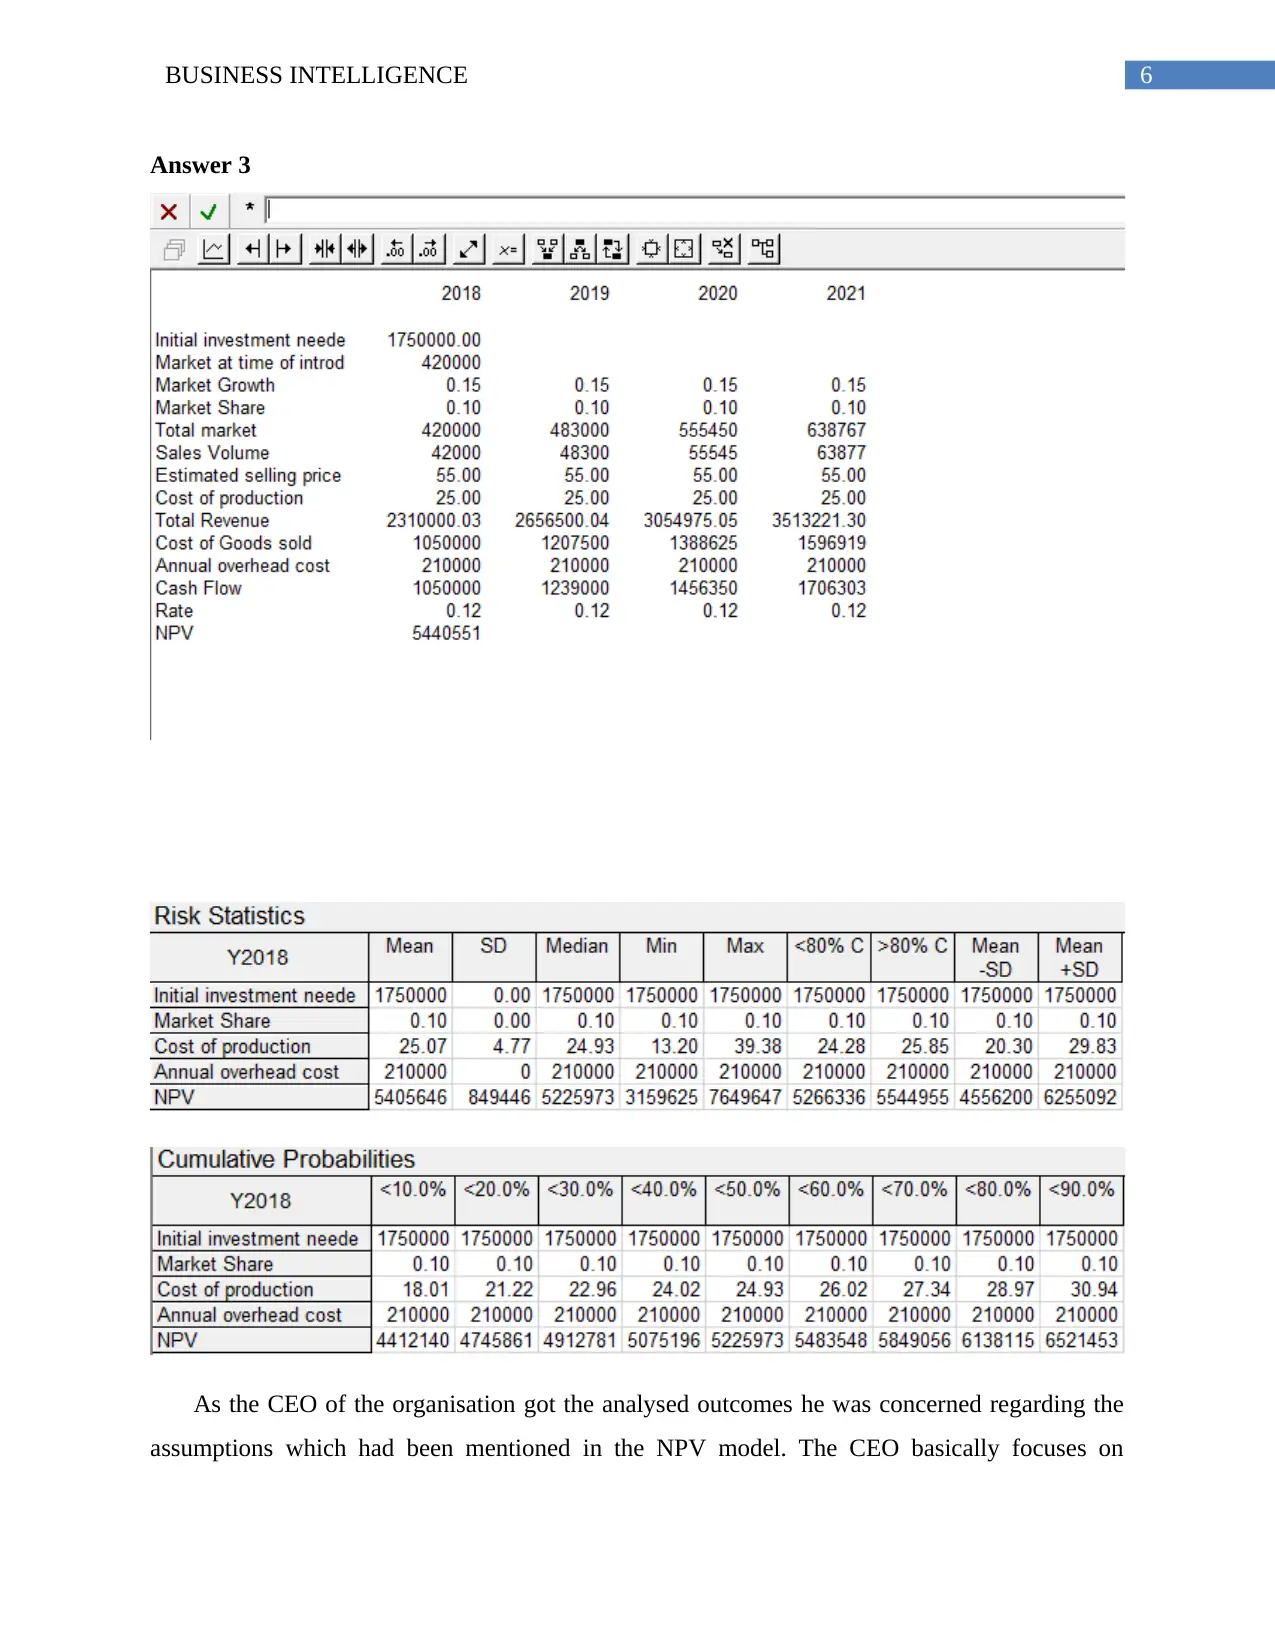
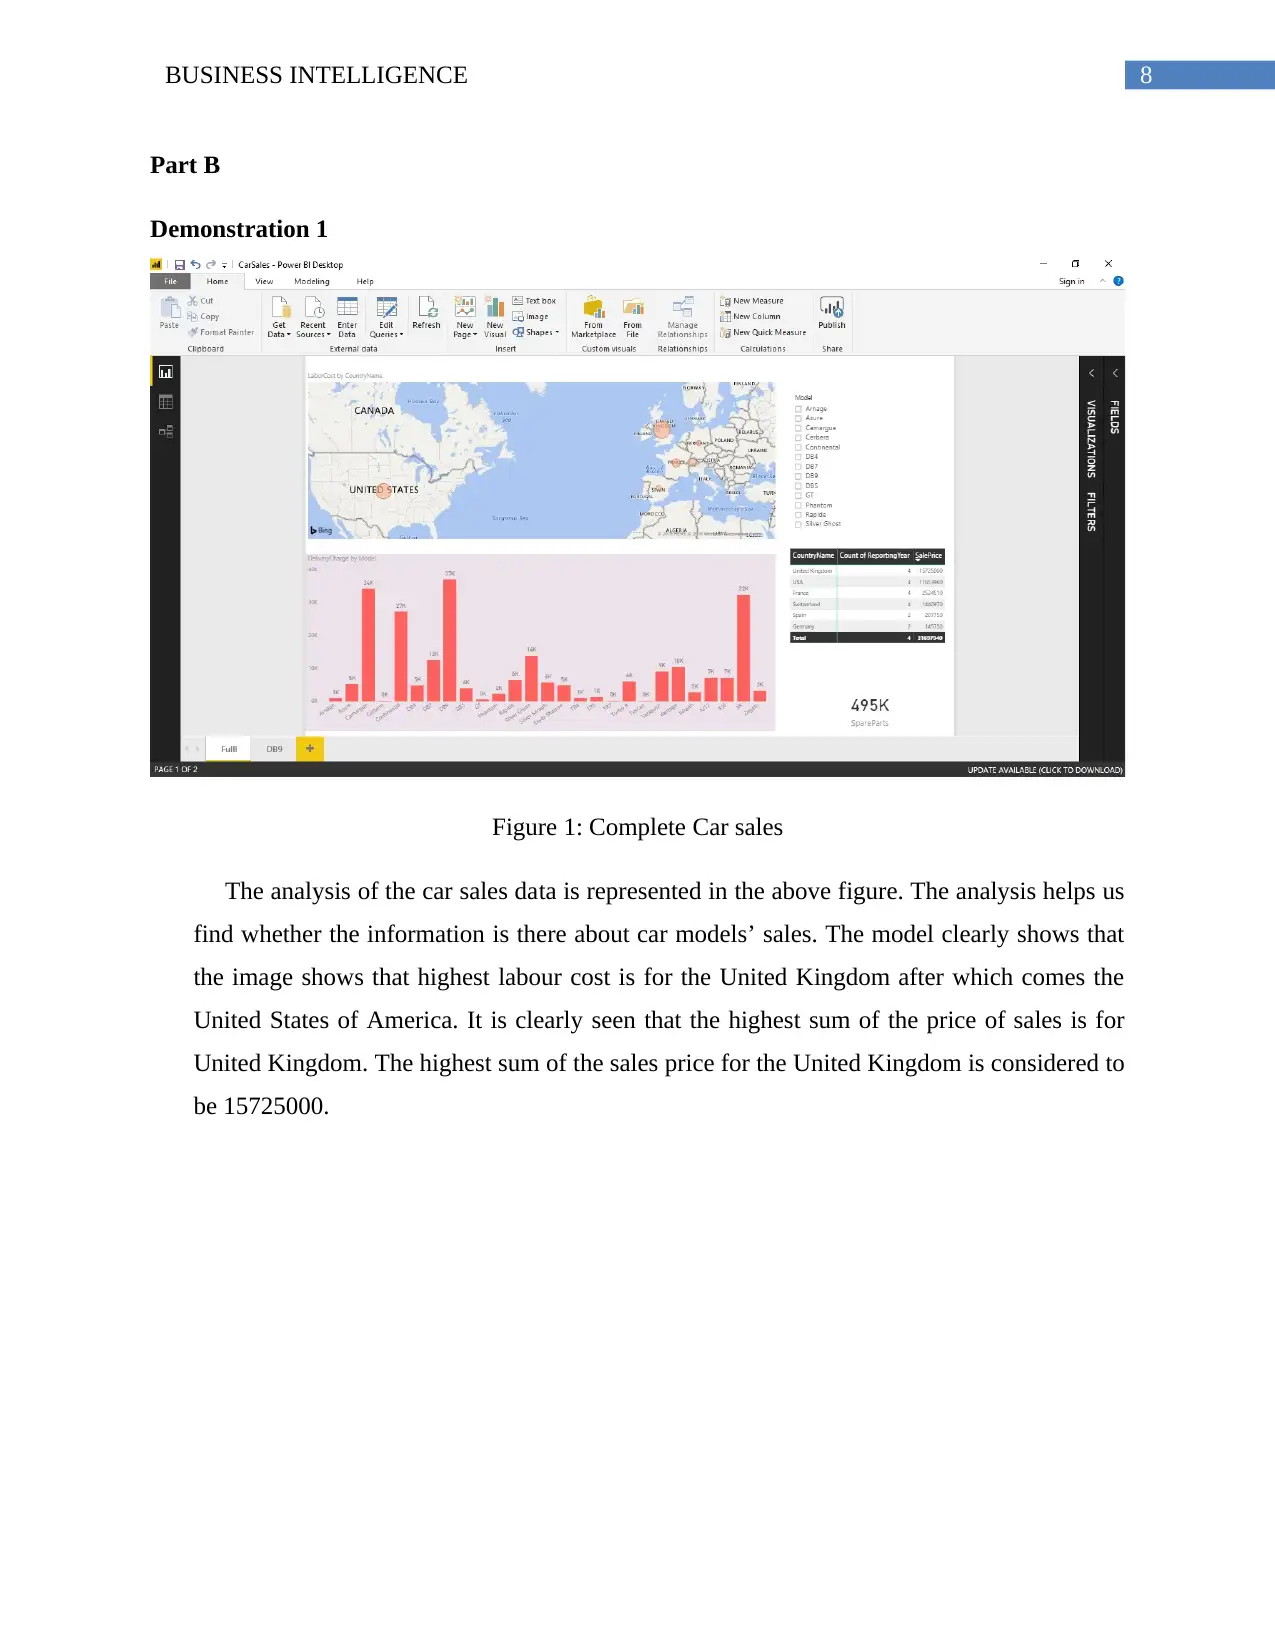
This report assesses the feasibility of Cloud-Pty Limited, an Australian cloud-based software development company, launching a new software product. It uses Visual DSS software and Monte-Carlo simulations to provide insights to senior management. The analysis covers NPV calculations, risk analysis considering market share, production costs, overheads, and initial investment. The CEO's concerns regarding uncertainties in the NPV model are addressed, focusing on selling price distribution, unit costs, and desired NPV probability. The report also includes demonstrations using Power BI to analyze car sales data and funding information in Queensland. Furthermore, it discusses how smart, connected products are transforming competition by enhancing functionality, reliability, and utilization, impacting value chains and industry boundaries, ultimately concluding with the product's capability to meet necessary criteria for a successful market launch.
Document Page
Running head: BUSINESS INTELLIGENCE
Business Intelligence
Name of Student:
Name of University:
Author’s Note:
tabler-icon-diamond-filled.svg

Secure Best Marks with AI Grader

Need help grading? Try our AI Grader for instant feedback on your assignments.
Document Page
1BUSINESS INTELLIGENCE
Table of Contents
Part A...............................................................................................................................................2
Answer 1......................................................................................................................................2
Answer 2......................................................................................................................................3
Answer 3......................................................................................................................................4
Overall Interpretation...................................................................................................................5
Part B...............................................................................................................................................6
Demonstration 1...........................................................................................................................6
Demonstration 2...........................................................................................................................8
Part C...............................................................................................................................................9
How Smart, Connected Products Are Transforming Competition..................................................9
Introduction..................................................................................................................................9
Discussion..................................................................................................................................10
Conclusion.................................................................................................................................11
References......................................................................................................................................13
Document Page
2BUSINESS INTELLIGENCE
Document Page
3BUSINESS INTELLIGENCE
Part A
The company, which has been chosen in this case, is “Cloud-Pty Limited”. It is actually a
cloud-based software development company that is based in Brisbane, Australia. The
organisation is deciding to start newer and better responsive cloud-based software applications in
the required market. Not very long ago, the dynamic and competitive advantage has formulated
some very wrong decisions of investment. At present the senior management requires a crucial
analysis of all sorts of innovative products in the market. The aim in this case is to give valuable
insights to the senior management regarding the feasibility of the new product. Visual DSS
software and Monte-Carlo Simulation procedures are utilized for proper understanding regarding
the software launches.
Answer 1
Based on the decision support models which have been developed utilizing the visual DSS, the
value of NPV has been obtained is $5440551. It can therefore be said that the summarized NPV
is higher than $2 million. Thus it can be said that in case the manager launches the software in
the market at present, it would prove to be a correct decision. The software launch decision
would have been correct.
tabler-icon-diamond-filled.svg

Secure Best Marks with AI Grader

Need help grading? Try our AI Grader for instant feedback on your assignments.
Document Page
4BUSINESS INTELLIGENCE
Answer 2
In case of risk analysis, it is required to analyse the effect of variation in the share of the market,
the cost of producing, overheads and also the primary investment regarding the NPV. In this
connection it can be said that
It is most probable that the market share will range between 5% to 15% and the most
probable value would be 10%
The unit cost follows a normal distribution. Its mean is $30 and its standard deviation is
$12
The interval between which the overhead cost can vary can be in the interval between of
$15000 and $35000. The most suitable value in this case can be $215000 each year.
Document Page
5BUSINESS INTELLIGENCE
The initial investment requirement follows a uniform distribution with the range
$1000000 to $2000000
The decision, which is to be taken in this case, is regarding the launch of the
software when it needs to be 20% or more probability is in the case that the net value at
present would be $1000000. It needs to be understood whether the launch decision is
correct or not.
The calculated cumulative NPV in case of a 20% chance is $3030930 which is
seen to be greater than the value $1000000. In cases it is considered that the chance for
the cumulative NPV is 10%, the value of the cumulative NPV is found to be $2421586.
Therefore, it can be said that not only a 20% but in fact a 10% value of the chance of risk
also shows the net present value which is considered to be greater than $1 million.
It needs to be interpreted if the software can be launched easily in the market for
the NPV $1 million with risk which is less than 10%.
Document Page
6BUSINESS INTELLIGENCE
Answer 3
As the CEO of the organisation got the analysed outcomes he was concerned regarding the
assumptions which had been mentioned in the NPV model. The CEO basically focuses on
tabler-icon-diamond-filled.svg

Paraphrase This Document

Need a fresh take? Get an instant paraphrase of this document with our AI Paraphraser
Document Page
7BUSINESS INTELLIGENCE
certain uncertainties of the particular model. The CEO needs to focus on certain problems in the
model.
The distribution of the selling price is between $65 and $45.
The unit cost follows a normal distribution, which as a mean of $25 and standard
deviation is $5.
CEO requires to move forward for the launch of the software in case there was an 80%
chance that the NPV would be greater than the value of $2500000.
Based on the analysis of the Visual DSS model, the cumulative NPV with more than
80% probability is not less than $6,138,115. It can be seen that the value is much lesser
than $2500000. Thus it can be said that the software possesses the credibility to be
worthy of a market launch.
Overall Interpretation
Based on the market value as well as the assumptions and uncertainties, the product is
capable of clearing the criteria and the check points which are necessary for interpretation.
The understanding and analysis of the questions has led to the interpretation that the CEO
needs to accept the proposed production of a specific product. The main reason for this is
because the product meets all the criteria which impacts a particular decision.
Document Page
8BUSINESS INTELLIGENCE
Part B
Demonstration 1
Figure 1: Complete Car sales
The analysis of the car sales data is represented in the above figure. The analysis helps us
find whether the information is there about car models’ sales. The model clearly shows that
the image shows that highest labour cost is for the United Kingdom after which comes the
United States of America. It is clearly seen that the highest sum of the price of sales is for
United Kingdom. The highest sum of the sales price for the United Kingdom is considered to
be 15725000.
Document Page
9BUSINESS INTELLIGENCE
Figure 2: Car Sales DB9
The image above is derived from the filtering of the data in the Power BI. The
data needs to be shown for the model DB9. The value of the total spare parts the company sells is
44K. The sum of the total sales price for the United States is 3609410.
The usage of the Power BI has led to the information that has been analysed on the car
sales their models as well as spare parts. The data contains detailed information on the sales parts
irrespective of counties and years. After section of a model, the information connected to the
DB9 was derived. Using of the Power BI the information was segregated. There is also the
possibility of assumption validation.
tabler-icon-diamond-filled.svg

Secure Best Marks with AI Grader

Need help grading? Try our AI Grader for instant feedback on your assignments.
Document Page
10BUSINESS INTELLIGENCE
Demonstration 2
Figure 3: Information on Funding Recipients
The figure presents information on funding in Queensland. The top right hand
corner gives information on the funding got by the department.
Document Page
11BUSINESS INTELLIGENCE
Figure 4: Research Funding’s on Research Fellowships
The research fellowship funding is available for purpose of agriculture, forest and
fisheries along with art and recreational sectors. A total amount of 9300000 has been
committed for fellowships. The second figure analyses the information of Research funding
in Queensland. The lower left hand corner shows all the departments, though the department
has a funding for research. The filtering of the data in this case was not operationally
accurate.
Part C
How Smart, Connected Products Are Transforming Competition
Introduction
As discussed by Mohelska and Sokolova (2016), in the recent times the role of
information technology has been depicted with revolutionizing the products. “Smart, connected
products” are seen to offer several opportunities in various categories of products. Some of the
main understanding needs to be considered with the “higher product utilization, greater
reliability, new functionality and capabilities” to transcend across the traditional product
boundaries. In general, these technologies are comprised with of three core elements- “physical
components, smart components and connectivity components”. The physical components are
depicted with mechanical and electrical parts. The smart components are further referred with the
components such as “control software, engine control unit, sensors and microprocessors”. The
connectivity aspect is seen to include the protocols with the wired and wireless connections
including ports and antennae. The changing aspect of the product is depicted with the disrupting
value chains which compels the organizations to retool and innovate in their internal strategies.
In addition to this, smart, connected products allows for the application for the implementation of
the new set of strategies to capture a significant aspect of sensitive data. The different types of
the other benefits of the smart connected products has been depicted with the redefining the
Document Page
12BUSINESS INTELLIGENCE
relations with the traditional business partners and defining the role of the companies in
expanding the industry boundaries. The significant discourse of the study has aimed at
illustrating the way smart, connected products contribute to the business analytics and transform
the companies for BI (Business Intelligence) (Porter and Heppelmann 2014).
Discussion
The implementation of the business analytics may be segregated in four phases of the product
cloud. The very first phase is related to the application of the smart products in terms of the
software applications for running on the remote servers which is managed with the “monitoring,
controlling and optimizing the product functions”. The second next important rule is considered
with defining the rules between the business logic and capabilities of the big data analytics. This
is seen with populating the algorithms in terms of the product thereby revealing the insights on
the new products (Fahimnia, Sarkis and Davarzani 2015). The third important phase is
considered with the application development and execution environment which allows for the
rapid creating applications for smart, connected business applications with the use of run-time
tools data access and visualization. The fourth phase is considered with the “big data” database
which has enabled normalization of the real time data and historic product. It needs to be
understood that the combination of the four elements are seen to be based on the connection
between the cloud and product. The various aspects of the product hardware are embedded in
form of “sensors, processors, connectivity ports which supplements the electrical and traditional
mechanical components”. Moreover, the smart connected products assist in transforming the
competition by the implementation the tools responsible for “managing user authentication,
system access and secure the product connectivity”. In addition to this, application of smart,
connected products is regarded as the information taken from different types of the external
sources such as “weather, commodity, traffic, energy prices, social media and geo-mapping”. In
addition to this, smart connected products integrate the data with the core enterprise systems
such as “PLM, CRM and ERP” (Staff 2014).
The application of the concept of “smart, connected products” has an important role in
the manufacturing sectors. In various types of the other cases the heavy machinery made by
“Schindler’s”, the “PORT” technology reduces the elevator waiting times by more than 50%.
This is seen to be done by the prediction of the demand patterns in the elevator and calculating
tabler-icon-diamond-filled.svg

Paraphrase This Document

Need a fresh take? Get an instant paraphrase of this document with our AI Paraphraser
Document Page
13BUSINESS INTELLIGENCE
the fastest time to the destination and assigning of appropriate elevators to move the passengers
more swiftly. In terms of the energy sectors ABB’s smart technologies has confirmed huge
amount of real time data in terms of the distributing, generating and transforming of changes in
temperatures for secondary substations. In addition to this, the application of the “smart,
connected products” facilitates the opportunities to the companies for building new technology
infrastructure which will comprise of several layers of implementation known as “technology
stack”. These factors have further allowed the organisations to allow the companies to modify
the “software applications”, “implement network communications” and have provisions for
product (Lefeuvre et al. 2016).
The “smart, connected products” has enabled companies in forming the new relationships
with the customers in requiring the marketing practices and new set of skills. The companies
accumulating the analysis of the products are able to gain new insights in allowing “better
positioning, create value for customers and enable better positioning of the offerings by making
use of effective communication” (Chin, Tat and Sulaiman 2015).
It has been further discerned that “smart connected products” has substantially increased
the range of the potential capability of the products and features. In different cases, the low
marginal cost for adding more sensors and new software application which has large fixed cost
associated to the infrastructural development and product cloud. Organizations such as Tesla
needing repairs are able to autonomously call for the corrective software downloads and notify
the customers with an invitation for valet pick up service and delivering the vehicle to the tesla
facility (Kim et al. 2014).
The cloud system is often seen to create a competitive advantage by enabling the
companies to optimize and control the design of all the part of the systems which is seen to be
relative to one another. The company allows for maintaining the control over technology and
provide direction for the development of the product cloud. The “Babolat’s play pure drive
product system can put the sensors and connectivity network in the racket handle, which allows
the users to track, analyse ball impact locations, ball spin and ball speed” (Harwood et al. 2014).
Document Page
14BUSINESS INTELLIGENCE
Conclusion
The main learnings of the study have evaluated three core elements of the system which
is considered with “physical components, smart components and connectivity components”. The
concept of the business analytics is divided into four phases. The first phase related to product
cloud refers to product applications, the next phase is seen with the rules/analytics engine and the
third phase is considered with application platform and final stage is considered with the product
data database.
Document Page
15BUSINESS INTELLIGENCE
References
Chin, T. A., Tat, H. H. and Sulaiman, Z. (2015) ‘Green supply chain management,
environmental collaboration and sustainability performance’, in Procedia CIRP, pp. 695–699.
doi: 10.1016/j.procir.2014.07.035.
Fahimnia, B., Sarkis, J. and Davarzani, H. (2015) ‘Green supply chain management: A review
and bibliometric analysis’, International Journal of Production Economics, pp. 101–114. doi:
10.1016/j.ijpe.2015.01.003.
Harwood, J., Dooley, J. J., Scott, A. J. and Joiner, R. (2014) ‘Constantly connected - The effects
of smart-devices on mental health’, Computers in Human Behavior, 34, pp. 267–272. doi:
10.1016/j.chb.2014.02.006.
Kim, S., Hong, J. Y., Kim, S., Kim, S. H., Kim, J. H. and Chun, J. (2014) ‘Restful Design and
Implementation of Smart Appliances for Smart Home’, in Proceedings - 2014 IEEE International
Conference on Ubiquitous Intelligence and Computing, 2014 IEEE International Conference on
Autonomic and Trusted Computing, 2014 IEEE International Conference on Scalable
Computing and Communications and Associated Sy, pp. 717–722. doi: 10.1109/UIC-ATC-
ScalCom.2014.64.
Lefeuvre, K., Berger, A., Kurze, A., Totzauer, S., Storz, M. and Bischof, A. (2016) ‘Smart
Connected Sensations: Co-Creating Smart Connected Applications Through Distributed
Serendipity’, Proceedings of the 9th Nordic Conference on Human-Computer Interaction, 23–
27–Octo, p. 88:1--88:4. doi: 10.1145/2971485.2996723.
Mohelska, H. and Sokolova, M. (2016) ‘Smart, connected products change a company’s business
strategy orientation’, Applied Economics, 48(47), pp. 4502–4509. doi:
10.1080/00036846.2016.1158924.
Porter, M. E. and Heppelmann, J. E. (2014) ‘How Smart, Connected Product Are Transforming
Competition’, Harvard Business Review, (November), pp. 64–89. doi:
10.1017/CBO9781107415324.004.
tabler-icon-diamond-filled.svg

Secure Best Marks with AI Grader

Need help grading? Try our AI Grader for instant feedback on your assignments.
Document Page
16BUSINESS INTELLIGENCE
Staff, H. B. R. (2014) ‘Strategic Choices in Building the Smart, Connected Mine’,
Https://Hbr.Org/2014/11/Strategic-Choices-in-Building-the-Smart-Connected-Mine, (November
2014), pp. 1–33. Available at: https://hbr.org/2014/11/strategic-choices-in-building-the-smart-
connected-mine.
chevron_up_icon
1 out of 17
circle_padding
hide_on_mobile
zoom_out_icon
[object Object]