Business Intelligence: Adelaide Airport's Dashboard Design Proposal
VerifiedAdded on 2022/12/19
|13
|2785
|1
Report
AI Summary
This report details a dashboard design proposal for Adelaide Airport Limited, focusing on business intelligence to improve operational efficiency and financial performance. The proposal outlines the airport's sustainability strategy and the need for data-driven decision-making. It covers key priorities, dashboard questions, and data sources, including flight data and financial records. The report presents sample dashboard screenshots and potential challenges like data quality and ethical considerations. The conclusion emphasizes the importance of business intelligence systems for scientific decision-making and the future of air travel. The assignment addresses the need for streamlined decision-making based on real-time analysis, and the use of KPIs. The dashboard design aims to address challenges such as non-aeronautical revenue analysis, passenger conversion rates, and negotiations with concessionaires and airlines, and includes data on flight and airlines, safety, financial records, and time control.
Running Head: Adelaide Airport’s Dashboard Design
Proposal for Dashboard Design
Name ()
Institution Affiliation
Professor:
Date
1
Proposal for Dashboard Design
Name ()
Institution Affiliation
Professor:
Date
1
Paraphrase This Document
Need a fresh take? Get an instant paraphrase of this document with our AI Paraphraser
Adelaide Airport’s Dashboard Design
Table of contents
Executive Summary.....................................................................................................................................3
Keywords................................................................................................................................................3
Introduction.................................................................................................................................................4
Overview of selected Key Priority................................................................................................................5
Dashboard Questions..................................................................................................................................6
Data and Data sources.................................................................................................................................7
Sample Dashboard Screenshots..................................................................................................................8
Potential Challenges and Issues.................................................................................................................10
Conclusion/Summary................................................................................................................................11
References.................................................................................................................................................12
2
Adelaide Airport’s Dashboard Design
Executive Summary
Adelaide Airport Limited (AAL) approach to eco-friendly operations has continuously
advanced towards hostile business exercises, whereas safeguarding its supervisory amenability
record. As designated in the business sustainability strategy, Adelaide airport company's vision
and enduring achievement were founded on the organizational pillars (Cody 2015). These pillars
are responsible for business practice, sustainable monetary, and societal management. In
determination to achieve the corporation’s dedicated goals and objectives in the 5-year, bearable
Proposal of dashboard design for Adelaide should be scrutinized to ensure that amendment of
strategic plans has advanced in areas such as defensible expansion, water management, waste
reutilizing and energy management to name a few. The previous year indicated the efficient
accomplishment of the solitary prime flight strip intersection project in Australia. Hence, this
attracted further needs of business intelligence in conjunction with the designing of dashboards
to facilitate effective operations in the company (Devlin 2016). The whole of 450,000 square
meters of the landing field and airstrip float up lacked safety at all, environmental or communal
occurrences whereas upholding the operative standards of Adelaide Airport. The dashboard
design was to support the expansion of structures comprising waste pavement reprocessing,
castoff asphalt trials, LED airstrip light installation, and use of recycled water (Freeman 2018).
The business documented Adelaide's Airport Limited achievements in this venture and gave rise
to Adelaide Airport, which was granted the title Australian Airports Association’s Capital City
Airport. The prime impartiality of this corporate strategy for Adelaide Airport Limited (AAL) is
to categorize operative and pecuniary growth prospects to promote the Linking of transportation
department with enhancing the general paybacks of the Airport to the public (Hilary 2019). By
providing approvals and stages for execution, this dashboard design proposal intends to recover
the Airport’s monetary recital and elongated period feasibility as a benefactor of aviation
services and facilities to its users and clients. A cautious progression was employed for the
expansion of this proposal designing of a dashboard. The preliminary stages in the course
overlooked to comprehend the ability’s outline, present physiognomies, and the airdrome bazaar
zone (Matthews 2016).
Keywords: Airport; Architecture; Business Intelligence; Data mining
3
⊘ This is a preview!⊘
Do you want full access?
Subscribe today to unlock all pages.
Trusted by 1+ million students worldwide
Adelaide Airport’s Dashboard Design
Introduction
Adelaide airport brought into existence in 1921. It was an airstrip constructed over 24 hectares of
land situated at Hendon. The place competed for a mailing service among Sydney and Adelaide.
However, due to the augmented evolution in aeronautics alternative airdrome named Parafield
was constructed in 1927.
Nevertheless, by 1947, the Parafield airstrip was inept at contenting the increased request in
flight (Gilad 2015). Henceforth a place was selected for the contemporary Adelaide Aerodrome.
This was at West Beach, which was then known as West Torrens. Construction began in earnest
and flights started in 1954. Parafield Airport was then relegated to use as a military and private
aviation capability. The airstrip sustained to be elevated with the building of an incurable for
intercontinental airlifts in 1982. In 2005, a new-fangled flair was constructed to substitute the
intimidate terminuses for inland and intercontinental voyages. Tiger Airlines Australia
completed the airfield its subsequent hub in 2009 formerly shutting down maneuvers and
recommencing over in 2013. The airdrome turned out to be the second airstrip in the biosphere
and the initial Australian aerodrome to have the Google Street View technology (Neufville
2017). The continuous development of the segment has shaped financial assistances and
attractivity in interior Europe and is stimulating investment in novel technology. This draws in a
broader pool of expertise and groundbreaking tactics from other areas, thus generating possible
innovative prospects to discourse the ecological impressions from aeronautics. Nevertheless, it is
predictable that the influence of flight actions to weather alterations, noise, and air superiority
impacts are cumulative, thus upsetting the well-being and value of lifespan of European
residents.
Noteworthy possessions are being devoted to mutually the European and Participant Public level,
as well as by business, to discourse this ecological encounter (Neufville 2017). Despite the fact
perfections are being completed transversely numerous actions such as (expertise, maneuvers,
airdromes, market-based dealings), their joint result designated in this account has not reserved
pace with the current robust evolution in the request for a voyage, thus leading to a general
upsurge in the conservational impressions. Airdromes are hastening the edifice of information
systems, and business intelligence is essential of the airstrip managerial system. This scandalous
4
Paraphrase This Document
Need a fresh take? Get an instant paraphrase of this document with our AI Paraphraser
Adelaide Airport’s Dashboard Design
examines the urgent demands of airdrome business intelligence, reflects the application design of
airstrip business intelligence, and inspects the functional planning of airdrome business
intelligence structure and the critical purposes of the segments.
Overview of selected Key Priority
Premeditated critical concert gauges, perceptions, and approvals are related to data
analysis. Adelaide airport strategically validates the business influence of the suggested activities
(Gessner 2015). Although, this may be beyond the range of data analysis for some dashboards,
including the impression that will make suggested activities embrace more weight. Of course, the
content of a dashboard report will depend on the audience. Also, the designing of the dashboard
focuses on collective aspects so that recipients or the users within the organization can
straightforwardly organize and remain within the critical metrics.
The encounters of Adelaide, air transportation segment, outspread past the prerequisite to
lessen overcrowding and boost service eminence and exposure. Two predominantly crucial
requisites are the necessity to guarantee air transport system care and eco-friendly compatibility
(Tan 2013). The technologies and abilities for improving adequate air transportation within
Adelaide lie within the strategic measures of Business Intelligence analysis and adherence to the
proposed dashboard designs that aim in addressing the problematic scenarios within the
organization. The intended system has the possibility for general perfections in the wellbeing of
the environmental compatibility of the air transport; nevertheless, it must be scrutinized before
concluding that the notion is of a required outcome.
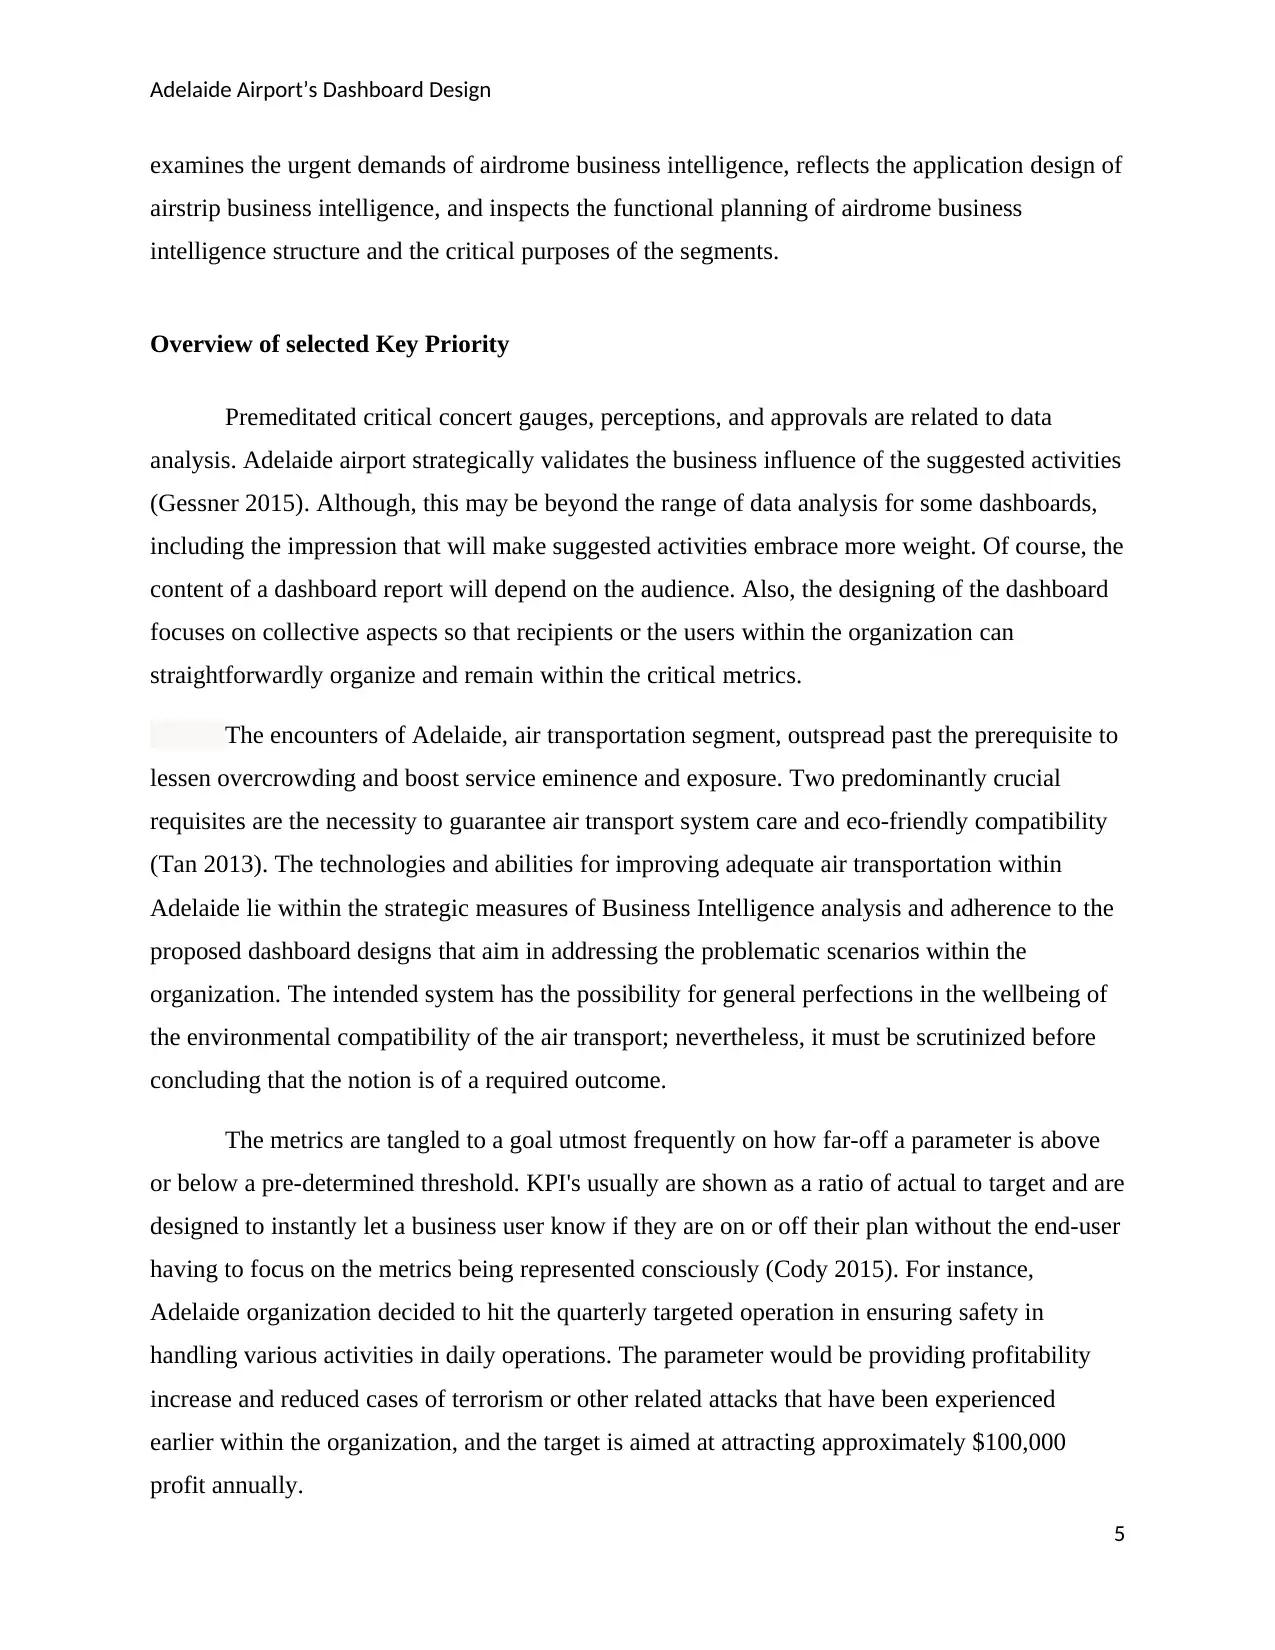
The metrics are tangled to a goal utmost frequently on how far-off a parameter is above
or below a pre-determined threshold. KPI's usually are shown as a ratio of actual to target and are
designed to instantly let a business user know if they are on or off their plan without the end-user
having to focus on the metrics being represented consciously (Cody 2015). For instance,
Adelaide organization decided to hit the quarterly targeted operation in ensuring safety in
handling various activities in daily operations. The parameter would be providing profitability
increase and reduced cases of terrorism or other related attacks that have been experienced
earlier within the organization, and the target is aimed at attracting approximately $100,000
profit annually.
5
examines the urgent demands of airdrome business intelligence, reflects the application design of
airstrip business intelligence, and inspects the functional planning of airdrome business
intelligence structure and the critical purposes of the segments.
Overview of selected Key Priority
Premeditated critical concert gauges, perceptions, and approvals are related to data
analysis. Adelaide airport strategically validates the business influence of the suggested activities
(Gessner 2015). Although, this may be beyond the range of data analysis for some dashboards,
including the impression that will make suggested activities embrace more weight. Of course, the
content of a dashboard report will depend on the audience. Also, the designing of the dashboard
focuses on collective aspects so that recipients or the users within the organization can
straightforwardly organize and remain within the critical metrics.
The encounters of Adelaide, air transportation segment, outspread past the prerequisite to
lessen overcrowding and boost service eminence and exposure. Two predominantly crucial
requisites are the necessity to guarantee air transport system care and eco-friendly compatibility
(Tan 2013). The technologies and abilities for improving adequate air transportation within
Adelaide lie within the strategic measures of Business Intelligence analysis and adherence to the
proposed dashboard designs that aim in addressing the problematic scenarios within the
organization. The intended system has the possibility for general perfections in the wellbeing of
the environmental compatibility of the air transport; nevertheless, it must be scrutinized before
concluding that the notion is of a required outcome.
The metrics are tangled to a goal utmost frequently on how far-off a parameter is above
or below a pre-determined threshold. KPI's usually are shown as a ratio of actual to target and are
designed to instantly let a business user know if they are on or off their plan without the end-user
having to focus on the metrics being represented consciously (Cody 2015). For instance,
Adelaide organization decided to hit the quarterly targeted operation in ensuring safety in
handling various activities in daily operations. The parameter would be providing profitability
increase and reduced cases of terrorism or other related attacks that have been experienced
earlier within the organization, and the target is aimed at attracting approximately $100,000
profit annually.
5
Adelaide Airport’s Dashboard Design
However, another problematic situation that should be addressed to ensure the successful
operation of Adelaide Airport is to monitor the performance of its traffic management system,
data collected on flight delays through its operation networks. Similarly, the flight’s record
analysis of aircraft delayed for 15 minutes or more concerning their planned flight times after the
departure or arrival time should also be taken into consideration. Delays are recorded for arrival,
departure, and the route of operations. Such information related to challenges faced by Adelaide
Airport attracted the strategic planning approaches under business intelligence to ensure
eradication of issues hindering the effectiveness of the services.
Dashboard Questions
Upcoming approaches for attractively structured measures to encounter increasing flight
demand are expected to focus on the amputation of lingering tailbacks in the flight transportation
structures, which would be realized through beleaguered enhancements in aerodrome set-up, air
traffic flow control and addressing the dashboard questions (Neufville 2017). Therefore, the
dashboard design tries to answer questions that have been hindering the normal functioning of
Adelaide airport for the past years. Some of the challenges that have been facing the airdrome
are:
How to Relate non-aeronautical returns per Traveler compared to the directions, airlines, product
groups, and more.
Techniques on assessing sales and incomes by product grouping, concessionaire conversion, day
of the week, period, terminal and an extensive range of other valuable metrics (Davenport 2017)
Measures on how to advance on a better understanding of airdrome retail and travelers’
tendency.
Approaches on how to classify conversion tariffs of commuters on any given direction
Tactics of improving negotiation elements with concessionaires and airlines inside and outside
the country
The strategy of streamlining the decision-making course based on real-time analysis and the
daily operations within the airport (Darius 2017).
6
⊘ This is a preview!⊘
Do you want full access?
Subscribe today to unlock all pages.
Trusted by 1+ million students worldwide
Adelaide Airport’s Dashboard Design
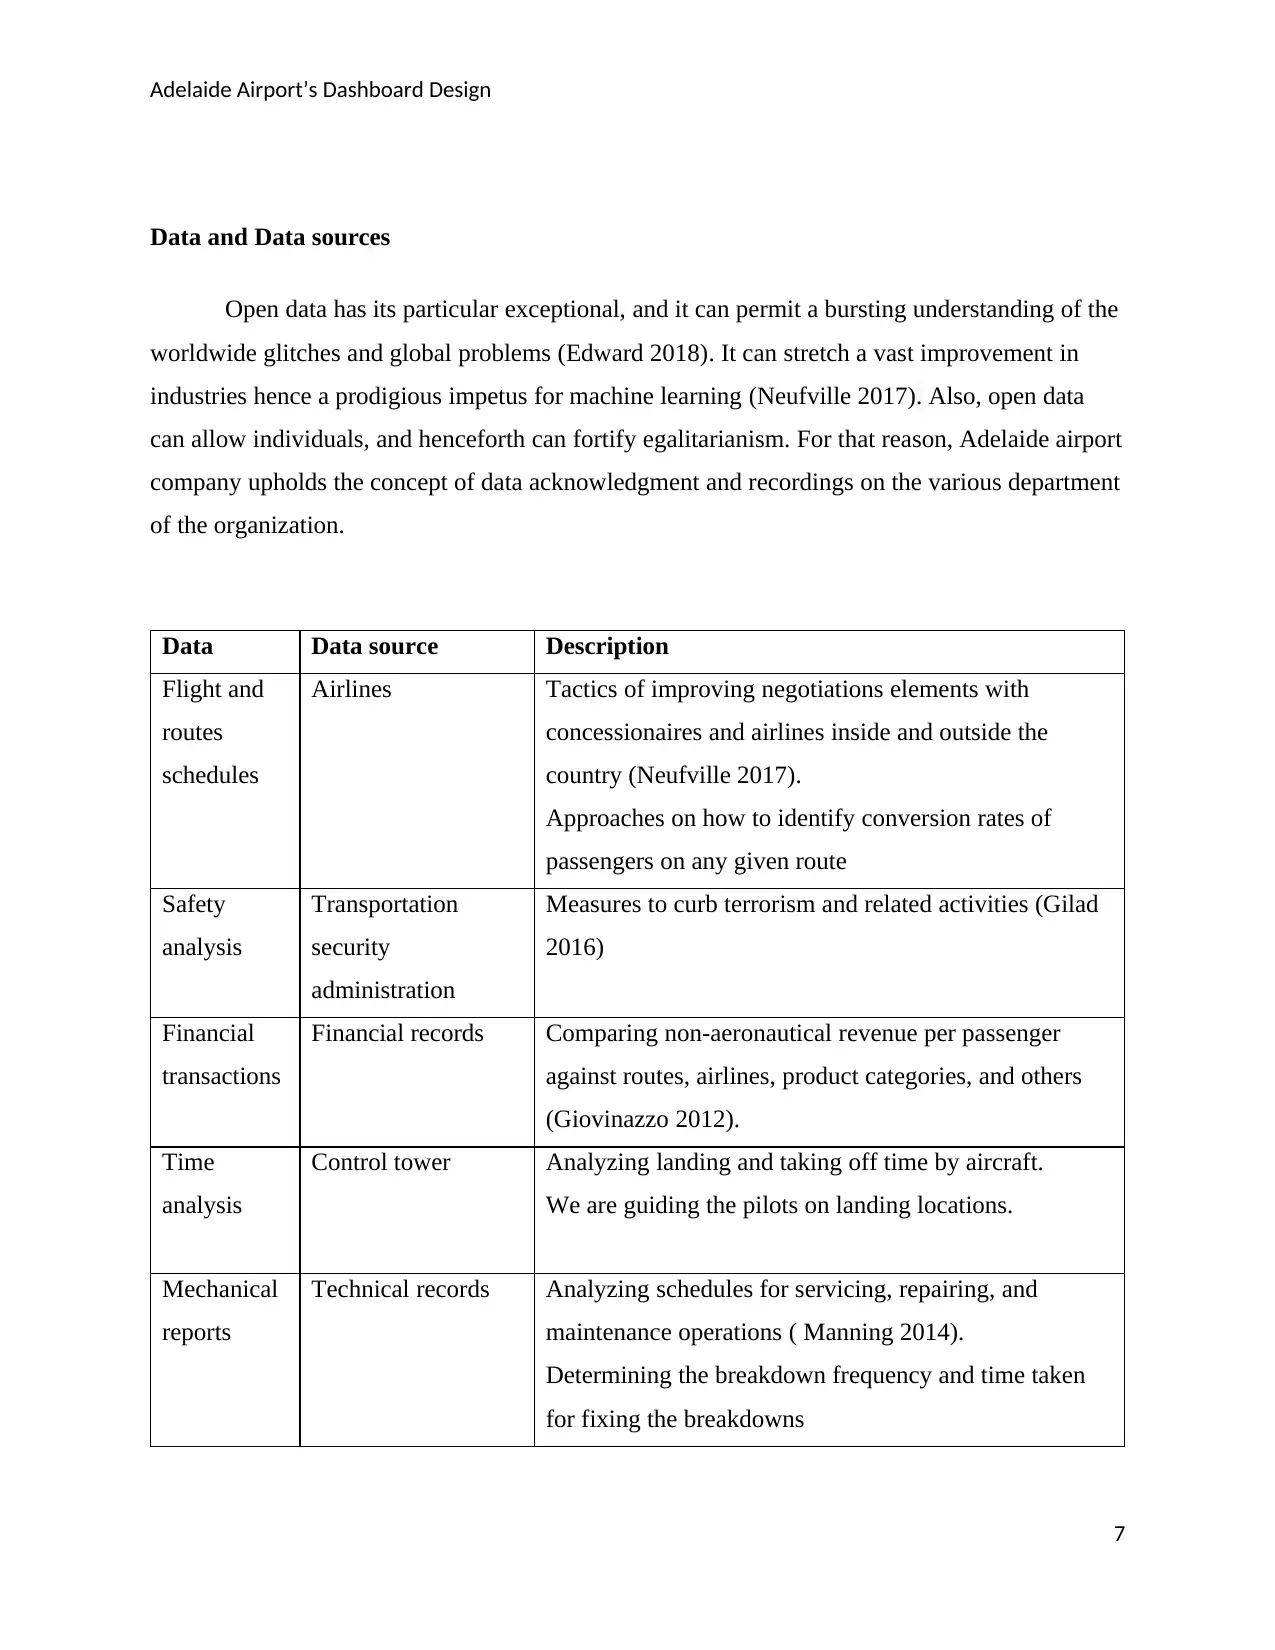
Data and Data sources
Open data has its particular exceptional, and it can permit a bursting understanding of the
worldwide glitches and global problems (Edward 2018). It can stretch a vast improvement in
industries hence a prodigious impetus for machine learning (Neufville 2017). Also, open data
can allow individuals, and henceforth can fortify egalitarianism. For that reason, Adelaide airport
company upholds the concept of data acknowledgment and recordings on the various department
of the organization.
Data Data source Description
Flight and
routes
schedules
Airlines Tactics of improving negotiations elements with
concessionaires and airlines inside and outside the
country (Neufville 2017).
Approaches on how to identify conversion rates of
passengers on any given route
Safety
analysis
Transportation
security
administration
Measures to curb terrorism and related activities (Gilad
2016)
Financial
transactions
Financial records Comparing non-aeronautical revenue per passenger
against routes, airlines, product categories, and others
(Giovinazzo 2012).
Time
analysis
Control tower Analyzing landing and taking off time by aircraft.
We are guiding the pilots on landing locations.
Mechanical
reports
Technical records Analyzing schedules for servicing, repairing, and
maintenance operations ( Manning 2014).
Determining the breakdown frequency and time taken
for fixing the breakdowns
7
Paraphrase This Document
Need a fresh take? Get an instant paraphrase of this document with our AI Paraphraser
Adelaide Airport’s Dashboard Design
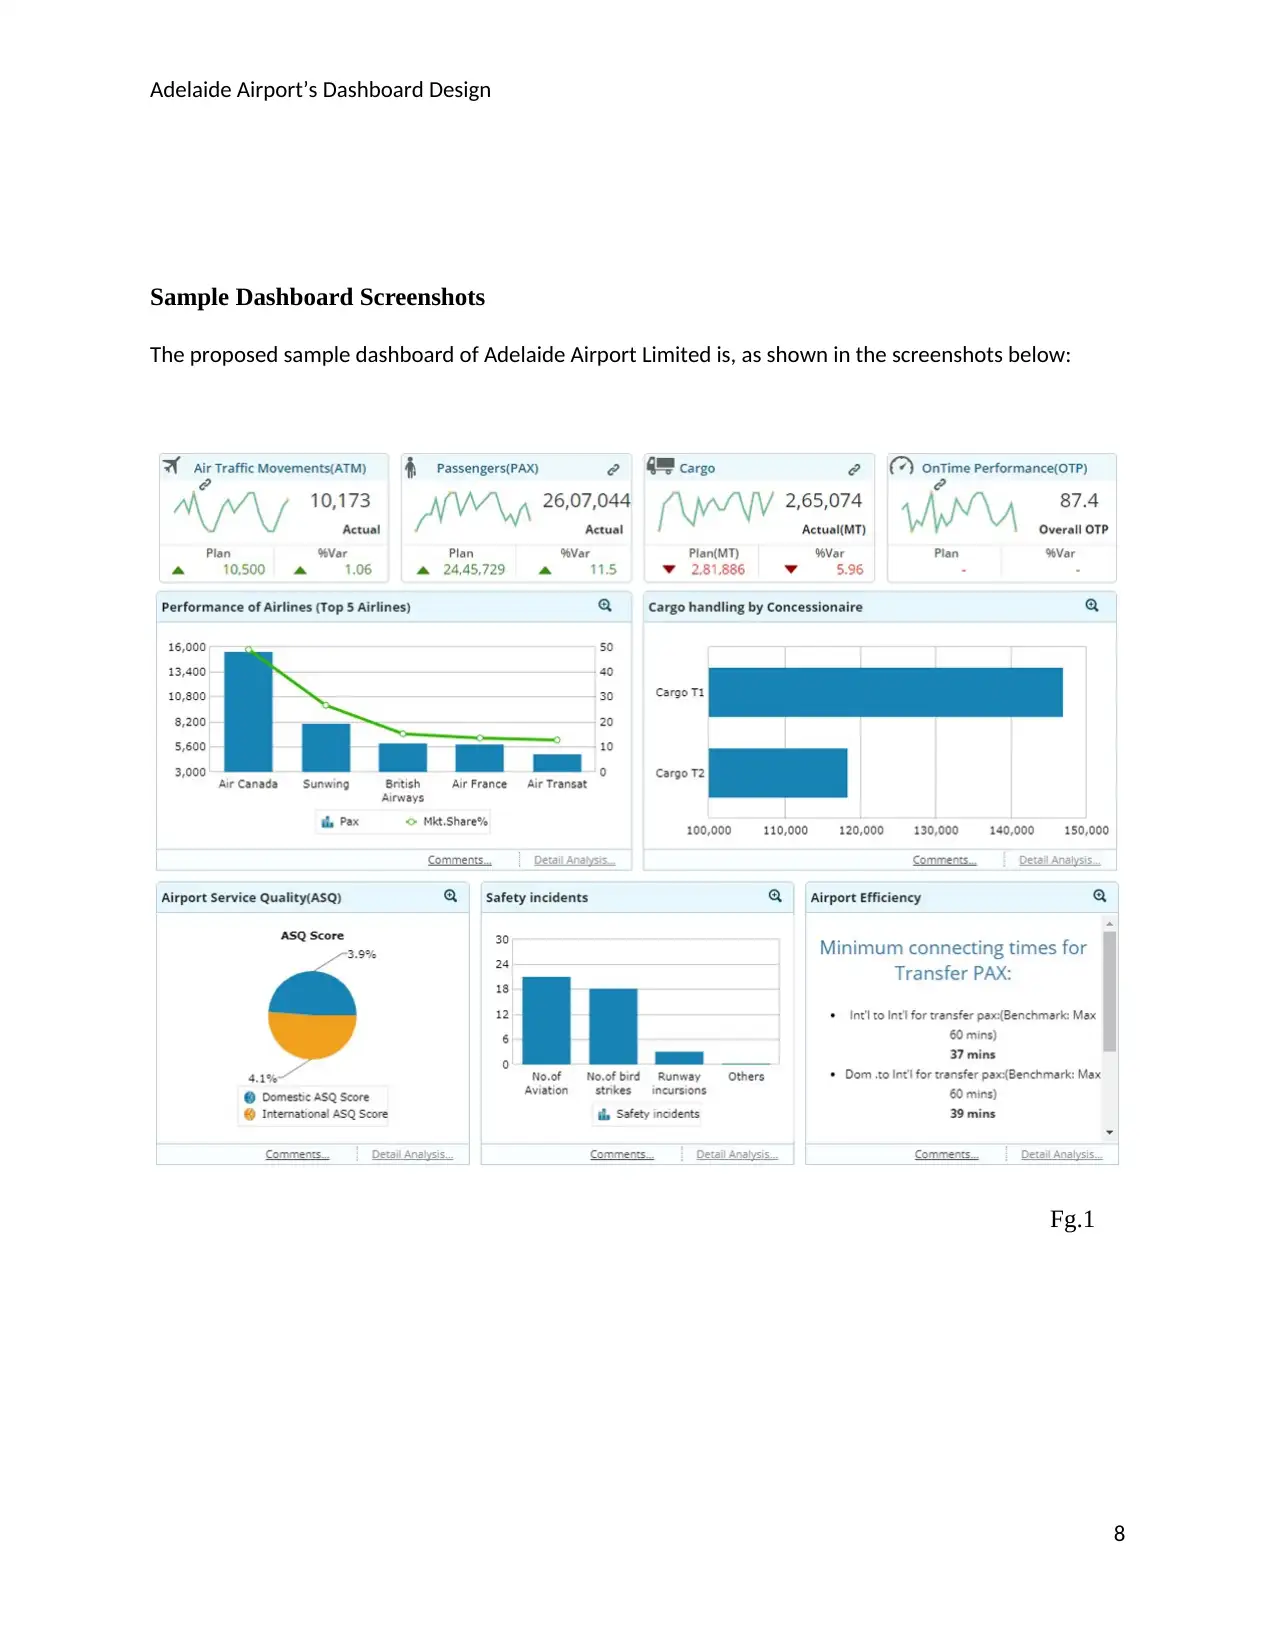
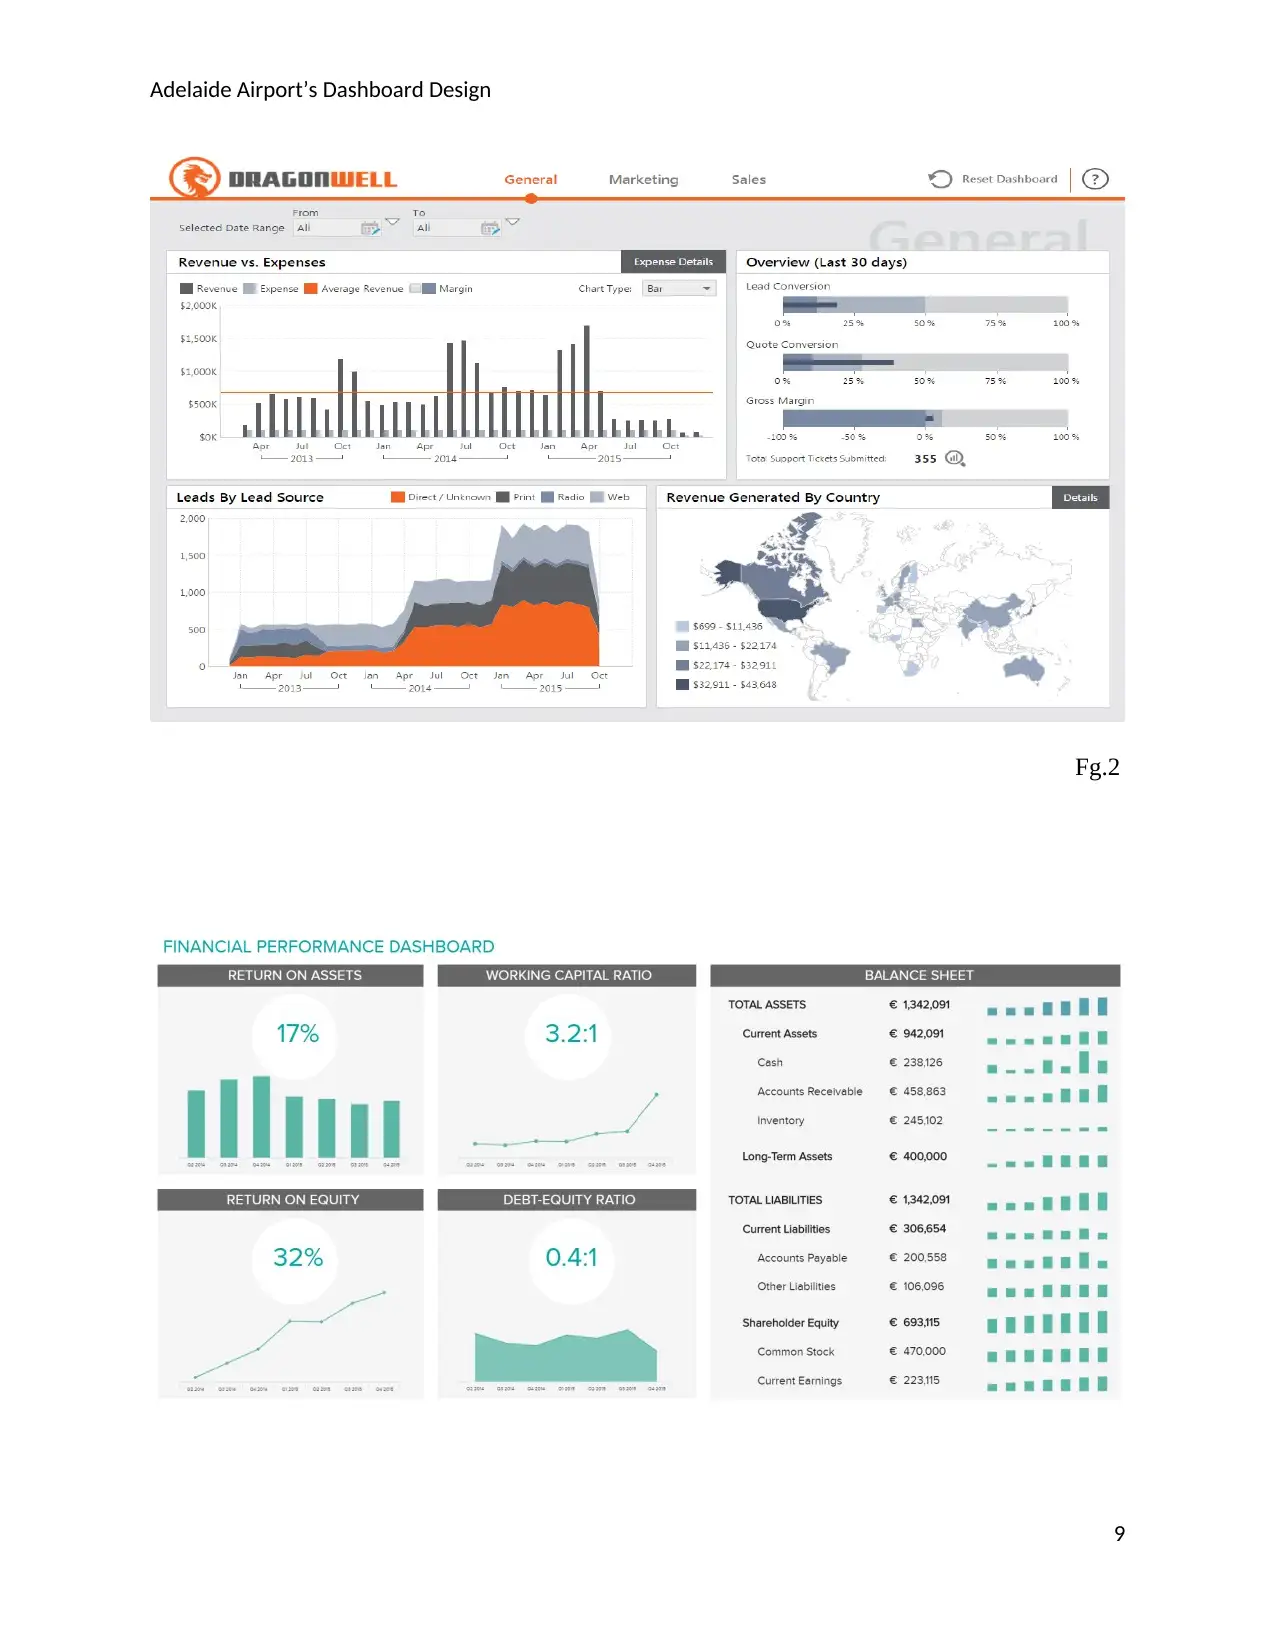
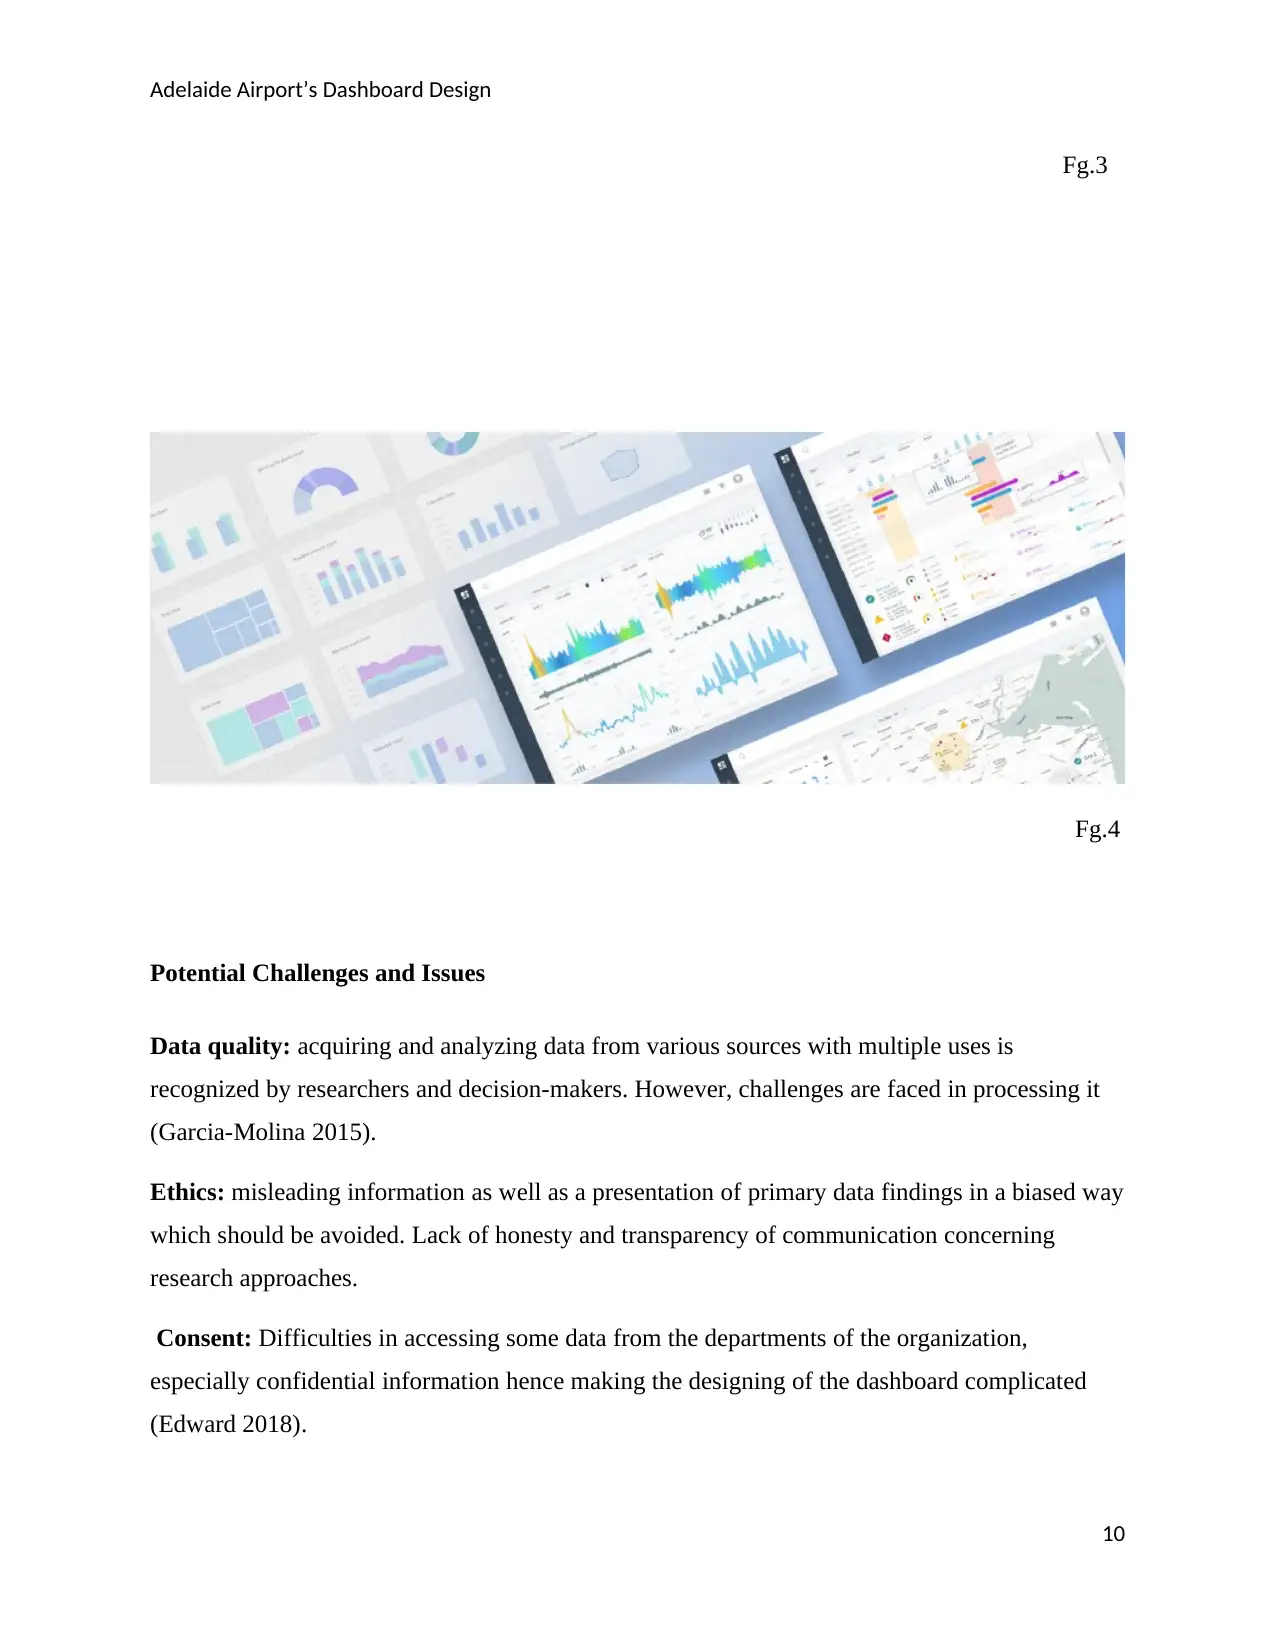
Sample Dashboard Screenshots
The proposed sample dashboard of Adelaide Airport Limited is, as shown in the screenshots below:
Fg.1
8
Sample Dashboard Screenshots
The proposed sample dashboard of Adelaide Airport Limited is, as shown in the screenshots below:
Fg.1
8
Adelaide Airport’s Dashboard Design
Fg.2
9
Fg.2
9
⊘ This is a preview!⊘
Do you want full access?
Subscribe today to unlock all pages.
Trusted by 1+ million students worldwide
Adelaide Airport’s Dashboard Design
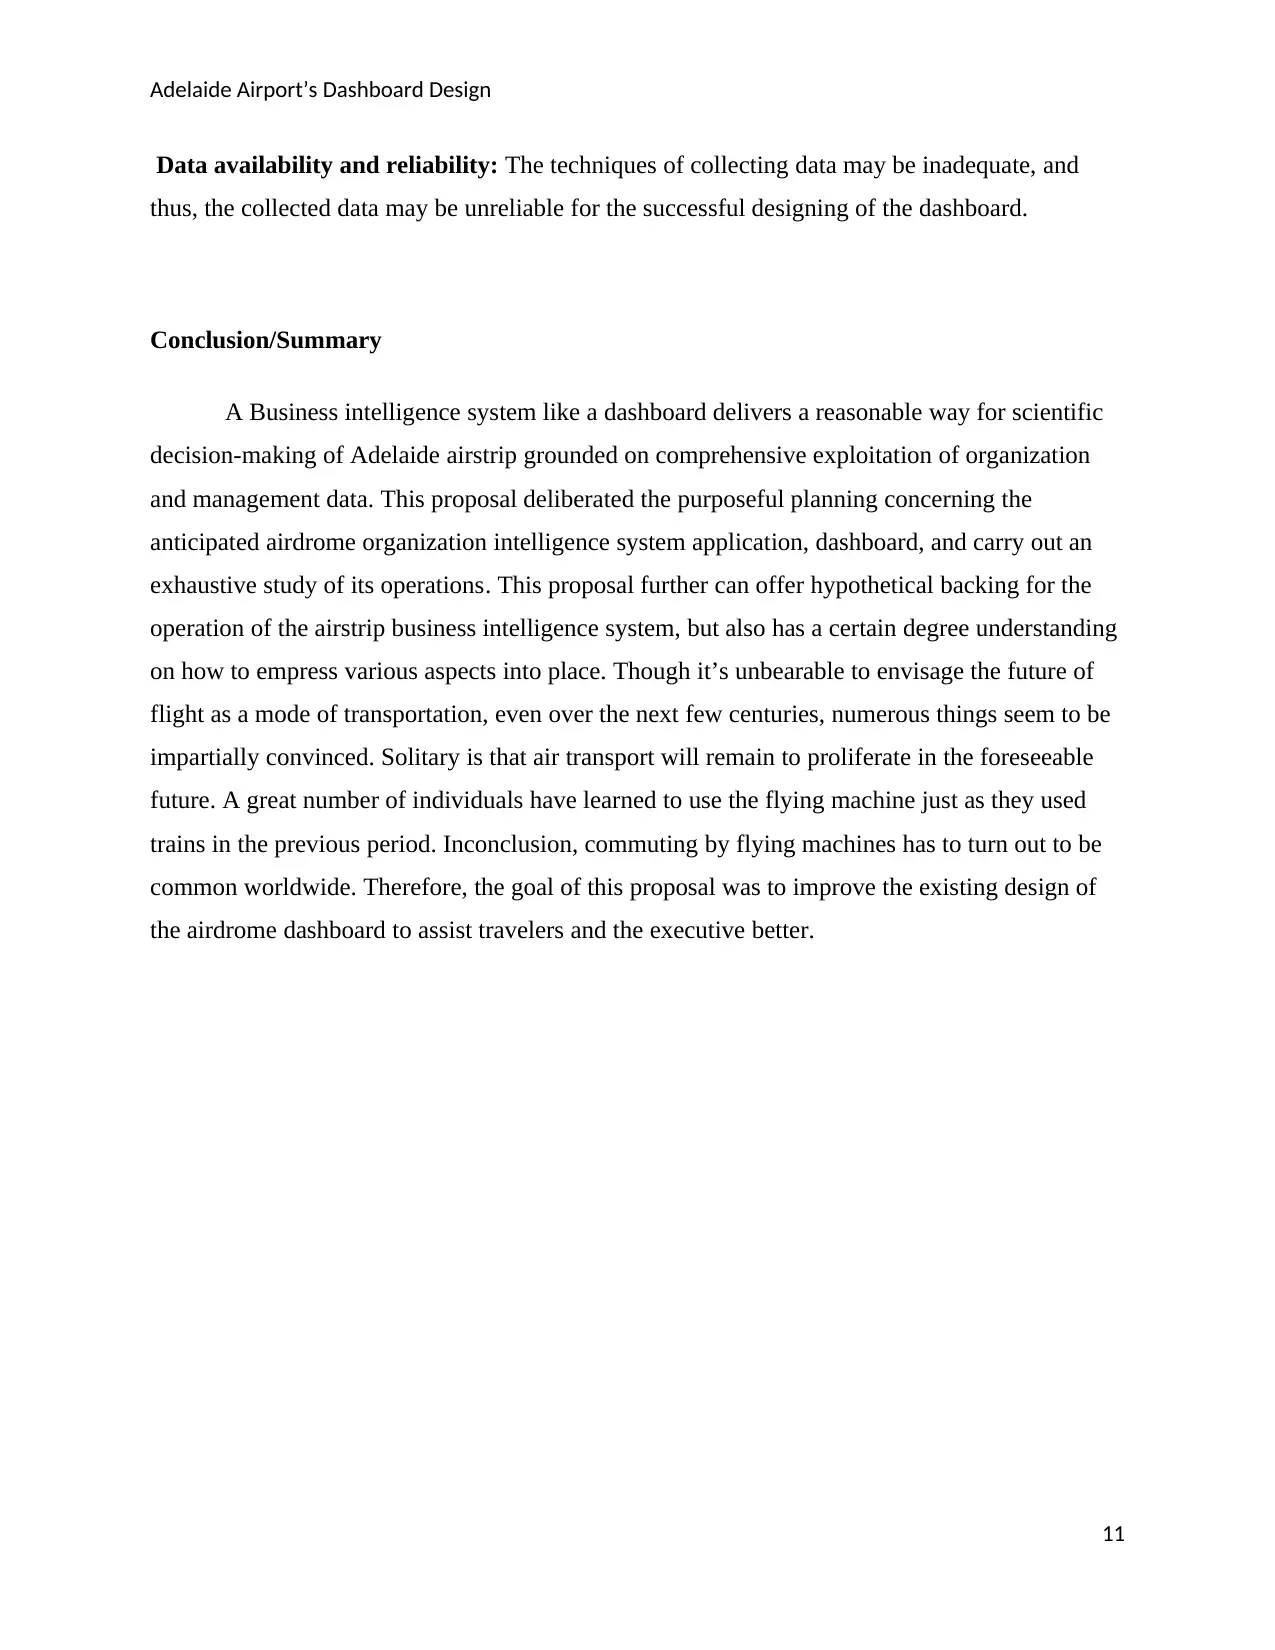
Fg.3
Fg.4
Potential Challenges and Issues
Data quality: acquiring and analyzing data from various sources with multiple uses is
recognized by researchers and decision-makers. However, challenges are faced in processing it
(Garcia-Molina 2015).
Ethics: misleading information as well as a presentation of primary data findings in a biased way
which should be avoided. Lack of honesty and transparency of communication concerning
research approaches.
Consent: Difficulties in accessing some data from the departments of the organization,
especially confidential information hence making the designing of the dashboard complicated
(Edward 2018).
10
Paraphrase This Document
Need a fresh take? Get an instant paraphrase of this document with our AI Paraphraser
Adelaide Airport’s Dashboard Design
Data availability and reliability: The techniques of collecting data may be inadequate, and
thus, the collected data may be unreliable for the successful designing of the dashboard.
Conclusion/Summary
A Business intelligence system like a dashboard delivers a reasonable way for scientific
decision-making of Adelaide airstrip grounded on comprehensive exploitation of organization
and management data. This proposal deliberated the purposeful planning concerning the
anticipated airdrome organization intelligence system application, dashboard, and carry out an
exhaustive study of its operations. This proposal further can offer hypothetical backing for the
operation of the airstrip business intelligence system, but also has a certain degree understanding
on how to empress various aspects into place. Though it’s unbearable to envisage the future of
flight as a mode of transportation, even over the next few centuries, numerous things seem to be
impartially convinced. Solitary is that air transport will remain to proliferate in the foreseeable
future. A great number of individuals have learned to use the flying machine just as they used
trains in the previous period. Inconclusion, commuting by flying machines has to turn out to be
common worldwide. Therefore, the goal of this proposal was to improve the existing design of
the airdrome dashboard to assist travelers and the executive better.
11
Adelaide Airport’s Dashboard Design
References
Cody, W 2015 “The Integration of Business Intelligence and Knowledge Management," IBM
Systems Journal, (41) 4.
Darius, Hedgebeth, 2017. Articles. Data-driven decision making for the enterprise: an overview
of business intelligence applications, the journal of information and knowledge management
systems, 37(4), 414-420.[19]
Davenport, T 2017. Competing on Analytics, Harvard Business Review.[20]
Devlin, B 2016. Data Warehouse: From Architecture Implementation. Boston: Addison-Wesley
Professional.[22]
Dhar, V., Stein, R 2016. Seven Methods for Transforming Corporate Data into Business
Intelligence, Prentice-Hall.[23]
Eckerson Wayne, W 2015. Performance dashboards: Measuring, monitoring, and managing
your business, Wiley.[24]
Edwards, B 2018. The modern airport terminal: new approaches to airport architecture. Third
Edition. Oxon April 2018.
Freeman, O., 2018. Competitor intelligence: information or knowledge. Business Information
Review, 16 (2), 71-77.[25]
Gaber, M.M 2017, Scientific Data Mining and Knowledge Discovery — Principles and
Foundations, Springer, New York.
Garcia-Molina, H., Ullman, J.D., and Widom, J 2015, Database Systems: The Complete Book
Second Edition, Prentice-Hall, Upper Saddle River, NJ.
Gessner, Guy H., Volonino, Linda, 2015. Quick Response Improves Returns on business
intelligence Investments, Information Systems Management, 22(3), 66 -74.[29]
12
⊘ This is a preview!⊘
Do you want full access?
Subscribe today to unlock all pages.
Trusted by 1+ million students worldwide
1 out of 13
Your All-in-One AI-Powered Toolkit for Academic Success.
+13062052269
info@desklib.com
Available 24*7 on WhatsApp / Email
![[object Object]](/_next/static/media/star-bottom.7253800d.svg)
Unlock your academic potential
Copyright © 2020–2026 A2Z Services. All Rights Reserved. Developed and managed by ZUCOL.