Comprehensive Report: Data Handling and Business Intelligence
VerifiedAdded on 2023/06/11
|17
|2932
|260
Report
AI Summary
This report delves into data handling and business intelligence, presenting a comprehensive analysis of data using tools like Microsoft Excel and SPSS. The first part of the report focuses on data management techniques, emphasizing the use of Excel for data modification, estimation, and graphical representation to analyze crime rates over a 10-year period. It discusses statistical insights such as mean, median, and mode, along with the application of VLOOKUP for data confirmation. The second part analyzes survey data related to student preferences, employing statistical analysis to derive meaningful outcomes and consequences. It also presents a comparative analysis of SPSS and Excel, highlighting their respective merits and demerits in data analysis scenarios. The report concludes by summarizing key findings and referencing relevant academic sources.

Data handling and
Business intelligence
Business intelligence
Paraphrase This Document
Need a fresh take? Get an instant paraphrase of this document with our AI Paraphraser
Table of Contents
PART 1............................................................................................................................................3
INTRODUCTION...........................................................................................................................3
Main Body.......................................................................................................................................3
Use of excel for the further analysis of the data.....................................................................3
Estimating of the Data fixed:..................................................................................................3
Signal of the data with the contribution of excel resolution:..................................................4
Graphical Display of the data penetrating suitable graphs:....................................................4
CONCLUSION................................................................................................................................6
REFERENCES................................................................................................................................7
PART 2............................................................................................................................................8
INTRODUCTION...........................................................................................................................8
Main Body.......................................................................................................................................8
Data enquiry...........................................................................................................................8
Outcomes and consequences................................................................................................11
Argument..............................................................................................................................11
Merits and Demerits of using SPSS.....................................................................................12
Merits and Demerits of Excel...............................................................................................12
Conclusion.....................................................................................................................................12
References......................................................................................................................................13
Appendix........................................................................................................................................14
PART 1
INTRODUCTION
The case study explains about the data management which combines the collection of data
and also confirms details information provided by it. It helps in protecting the value and return of
the company and administration of the organisation by defining the aims and objectives of the
business. Efficiency and effectiveness of the company plays very vital role in the management to
achieve the objective laid down by the management. The data is related to last 10 years of the
which has been modified using VLOOKUP, Count if, etc. These modifications are done to
accomplish a relation among the data which defines the purpose of the report. This helps in
securing data from duration and entries on a huge scale (Cheng and et.al., 2018).
Main Body
Use of excel for the further analysis of the data.
Microsoft excel helps organisation in finding outcomes of results with the help of functions
of Excel. It does not confirm that all the findings can be derived from the Microsoft Excel. Data
with advance adjustments can be handled with the advance features of the Microsoft Advanced
Excel. The provided data is related with last 10 years and concerned with the increase in the level
of crime in the past period. There are various factors which will effected on the basis of stage
diverges are expenses, southern area, education stage, etc.
Estimating of the Data fixed:
In the given information, it has performed expressing insights which involve mean, median
and mode etc. on the information given in the successful bookkeeping sheet. The bad behavior
rate has averaged 102.80%, often indicating serious wrongdoing in the current year, and the 10-
year average is the same (Harrison and Johnson, 2019). Wrongdoing is estimated to reach
102.07%, indicating that the wrongdoing value will be monitored for up to 10 years. It mainly
shows that respect for wrongdoing is supported. Such variables in country or domain
information, costs incurred, size of the country, etc., all exaggerate the extent of wrongdoing.
Expressive insight makes creative thinking about information humbler and simple, with the goal
that the results can be discussed later in a 10-year period. Few factors can also affect the level of
⊘ This is a preview!⊘
Do you want full access?
Subscribe today to unlock all pages.
Trusted by 1+ million students worldwide
respect for wrongdoing by isolating the level of respect for wrongdoing from the level of the
populace.
Outset of Data:
Under information creative thinking, the presentation of information has been arranged
graphically through different charts, guides and diagrams etc. These devices provide an
attainable way to shape and understand the subtleties of turns, anomalies, and game plans where
information is fixed or given. In the formation of massive amounts of information, information
conception tools play an important role in discovering goals that information-centric decision-
making can prepare for in advance, in order to discover great value in detail. In the fixed given
information, the information has been conceptualized with the help of the reasons for success,
which are performed on the given information, i.e. turntable and focus. Carousel helps organize
information or details to simplify business (Huang and et.al., 2020).
Signal of the data with the contribution of excel resolution:
Confirmation has been approved out with the contribution of V look up drive
(Concealed in Excel spreadsheet)
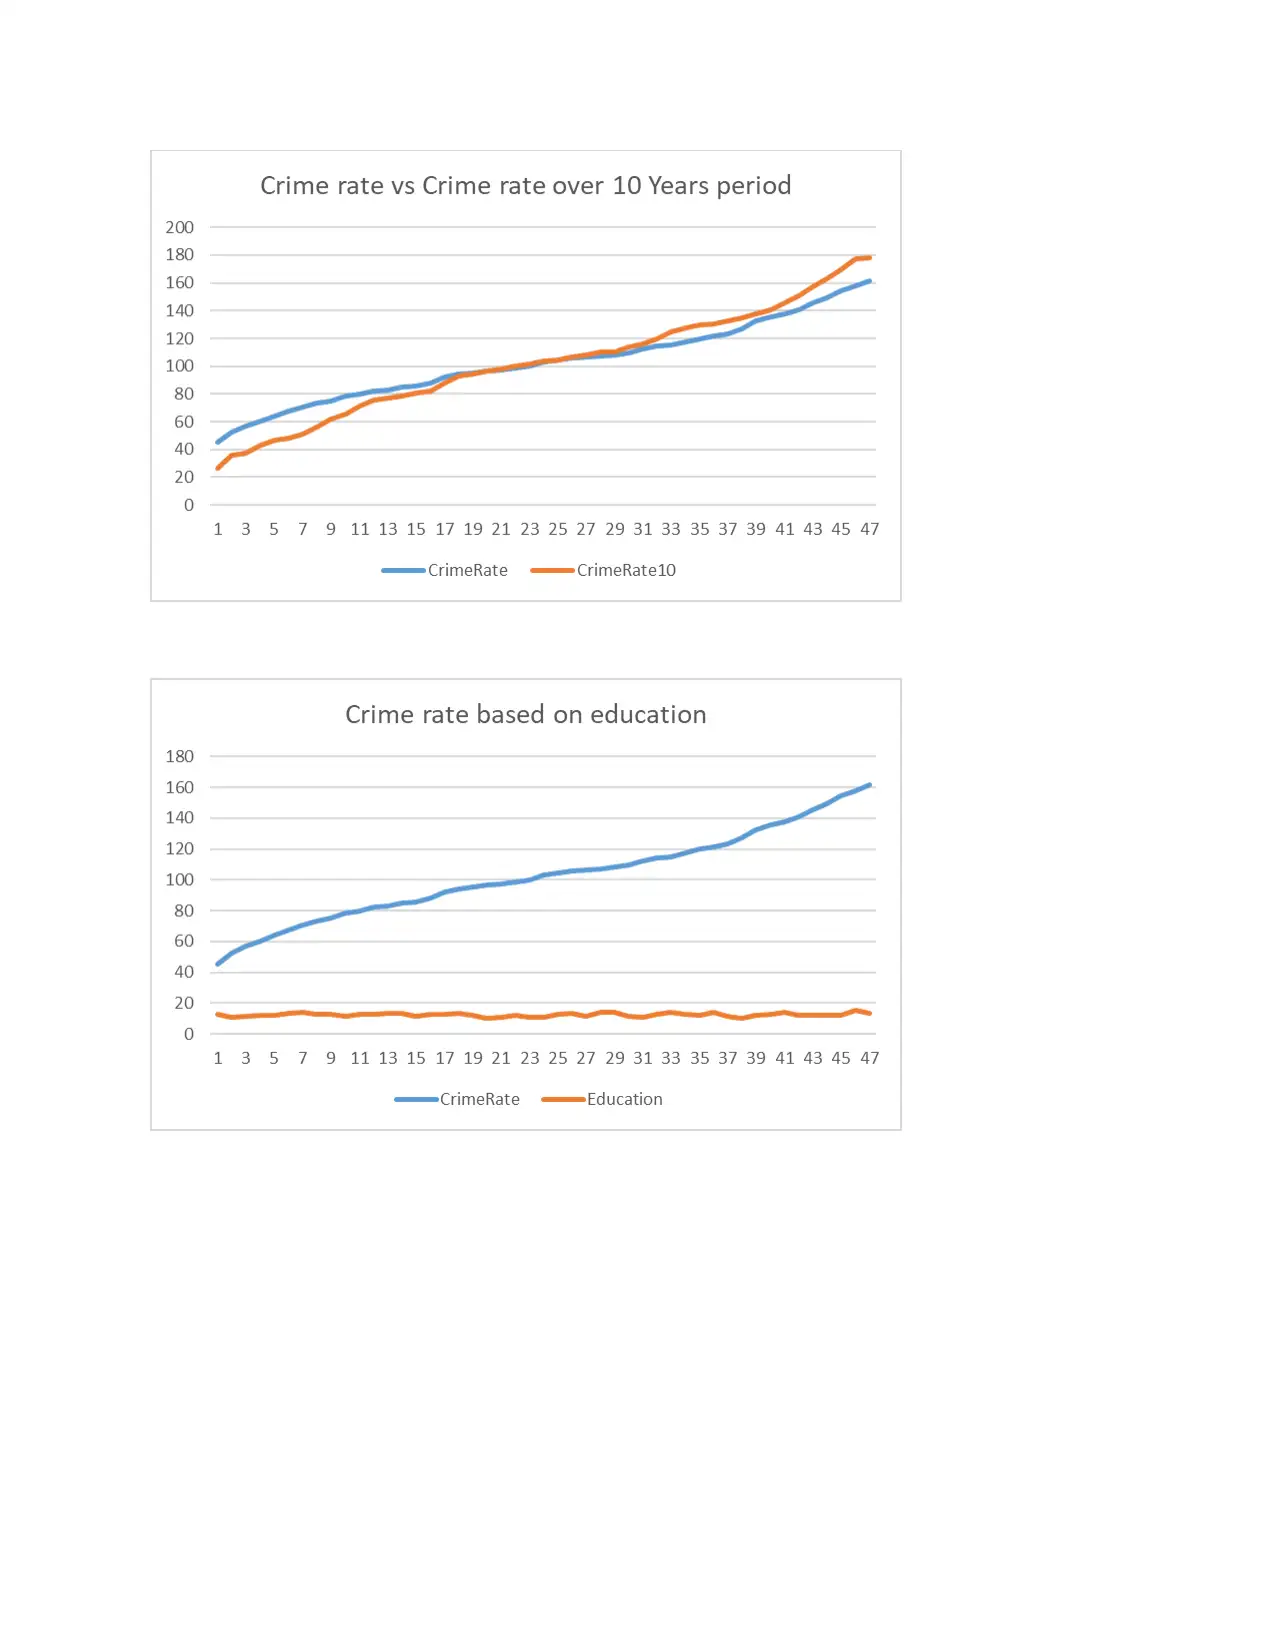
Graphical Display of the data penetrating suitable graphs:
The graph shows the general finding of information that has been put into the success
calculation table that sent the wrongdoing in a particular year, and thus concatenates the
information over a 10-year period. Both insights are tested in subsequent graphs that show that
both gain more of equal value over time. The redundant graphs given represent the effects of
wrongful conduct, relying on information arranged in the country, as the level of training
occupies an urgent part of the wrongful conduct value in that country. As if the professional
frame is not properly arranged, then the degree of error is higher (Leimeister, 2019).
populace.
Outset of Data:
Under information creative thinking, the presentation of information has been arranged
graphically through different charts, guides and diagrams etc. These devices provide an
attainable way to shape and understand the subtleties of turns, anomalies, and game plans where
information is fixed or given. In the formation of massive amounts of information, information
conception tools play an important role in discovering goals that information-centric decision-
making can prepare for in advance, in order to discover great value in detail. In the fixed given
information, the information has been conceptualized with the help of the reasons for success,
which are performed on the given information, i.e. turntable and focus. Carousel helps organize
information or details to simplify business (Huang and et.al., 2020).
Signal of the data with the contribution of excel resolution:
Confirmation has been approved out with the contribution of V look up drive
(Concealed in Excel spreadsheet)
Graphical Display of the data penetrating suitable graphs:
The graph shows the general finding of information that has been put into the success
calculation table that sent the wrongdoing in a particular year, and thus concatenates the
information over a 10-year period. Both insights are tested in subsequent graphs that show that
both gain more of equal value over time. The redundant graphs given represent the effects of
wrongful conduct, relying on information arranged in the country, as the level of training
occupies an urgent part of the wrongful conduct value in that country. As if the professional
frame is not properly arranged, then the degree of error is higher (Leimeister, 2019).
Paraphrase This Document
Need a fresh take? Get an instant paraphrase of this document with our AI Paraphraser
CONCLUSION
As it is concluded from the above report that information restoration is related to the level
of wrongdoing over a 10-year period. The reason is that appropriate information is found when
using Express Insights, various pre-tools used in the success calculation table are also applied,
including viewing, calculating reasons, etc., to help the organization establish a productive way
to obtain information, in addition, the organization of all Users can effortlessly use details that fit
and support them. In the above case, the opinion expressed has been recognized in the successful
bookkeeping sheet, expressing a full understanding of the wrongdoing. On such information, it
has performed a successful fixation direction, so it is possible to describe the meaning of the
reason for the organization.
⊘ This is a preview!⊘
Do you want full access?
Subscribe today to unlock all pages.
Trusted by 1+ million students worldwide
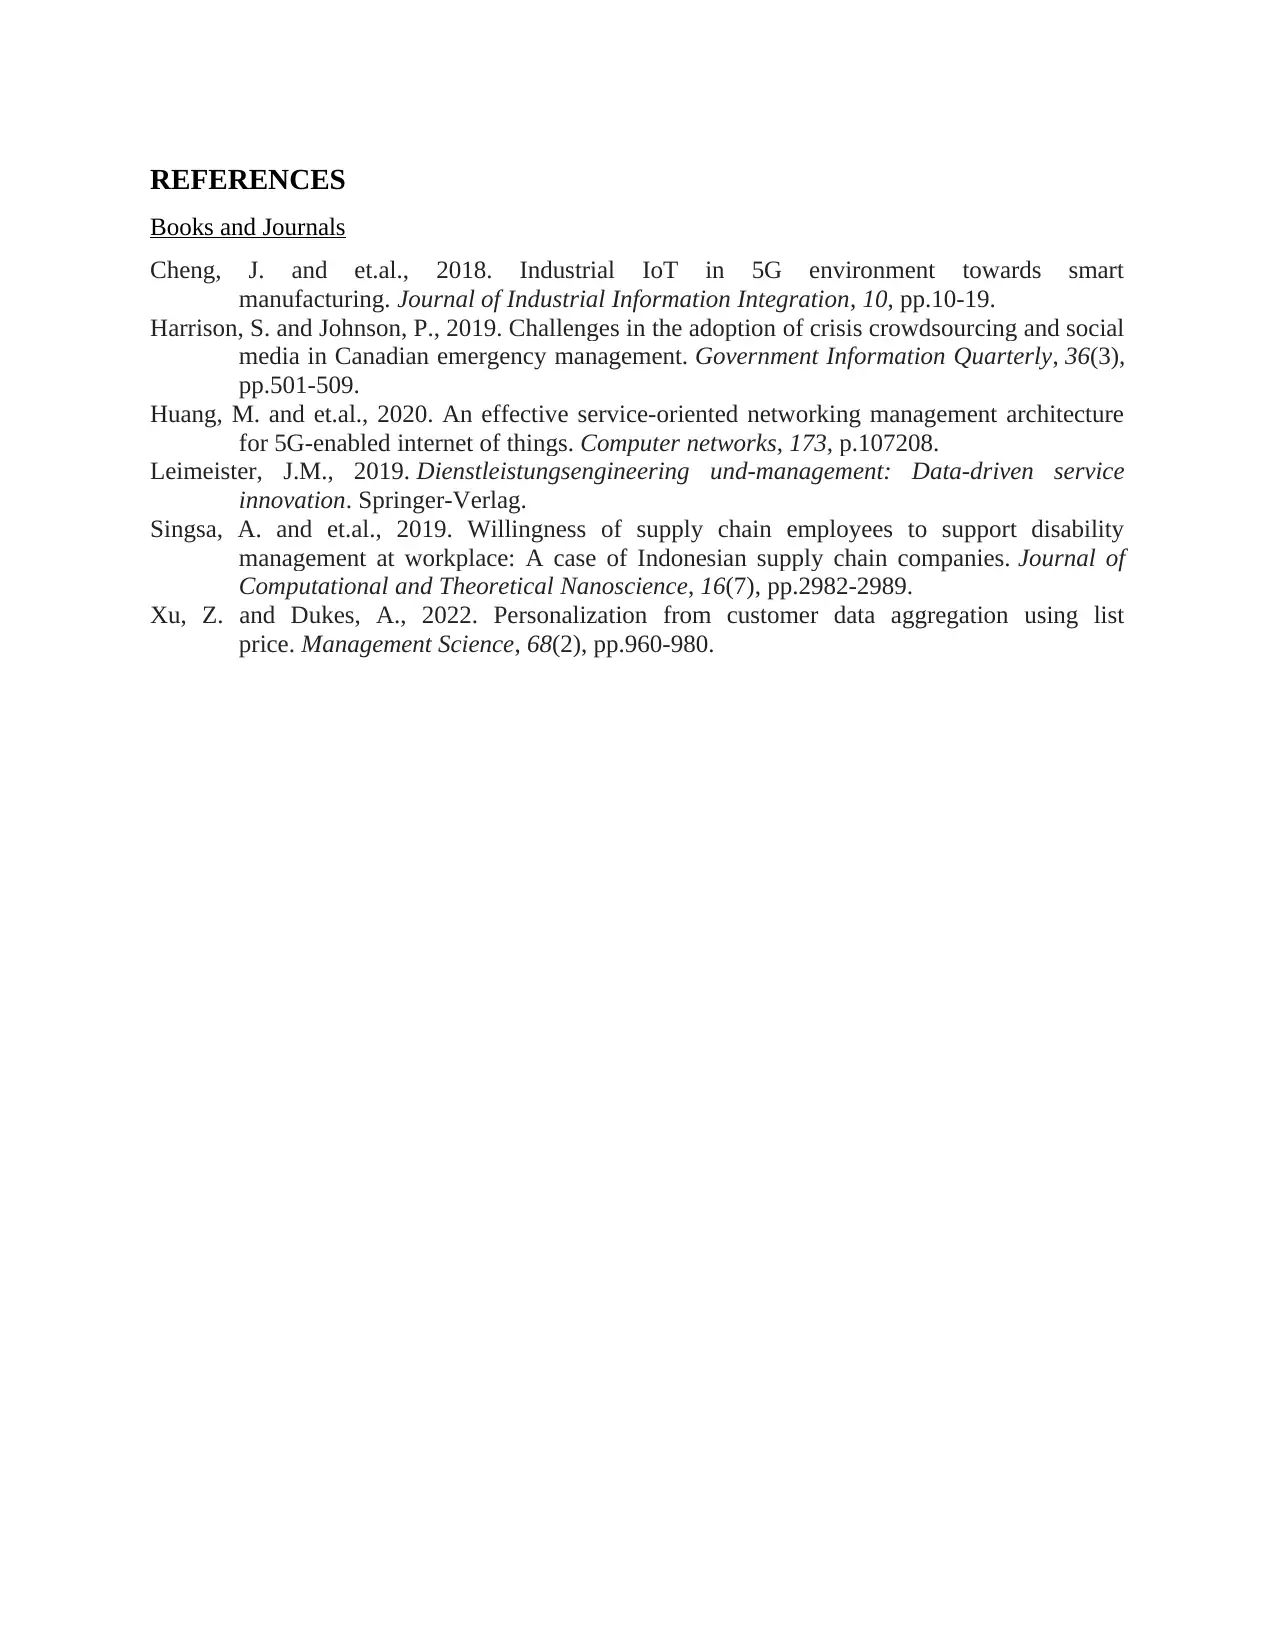
REFERENCES
Books and Journals
Cheng, J. and et.al., 2018. Industrial IoT in 5G environment towards smart
manufacturing. Journal of Industrial Information Integration, 10, pp.10-19.
Harrison, S. and Johnson, P., 2019. Challenges in the adoption of crisis crowdsourcing and social
media in Canadian emergency management. Government Information Quarterly, 36(3),
pp.501-509.
Huang, M. and et.al., 2020. An effective service-oriented networking management architecture
for 5G-enabled internet of things. Computer networks, 173, p.107208.
Leimeister, J.M., 2019. Dienstleistungsengineering und-management: Data-driven service
innovation. Springer-Verlag.
Singsa, A. and et.al., 2019. Willingness of supply chain employees to support disability
management at workplace: A case of Indonesian supply chain companies. Journal of
Computational and Theoretical Nanoscience, 16(7), pp.2982-2989.
Xu, Z. and Dukes, A., 2022. Personalization from customer data aggregation using list
price. Management Science, 68(2), pp.960-980.
Paraphrase This Document
Need a fresh take? Get an instant paraphrase of this document with our AI Paraphraser
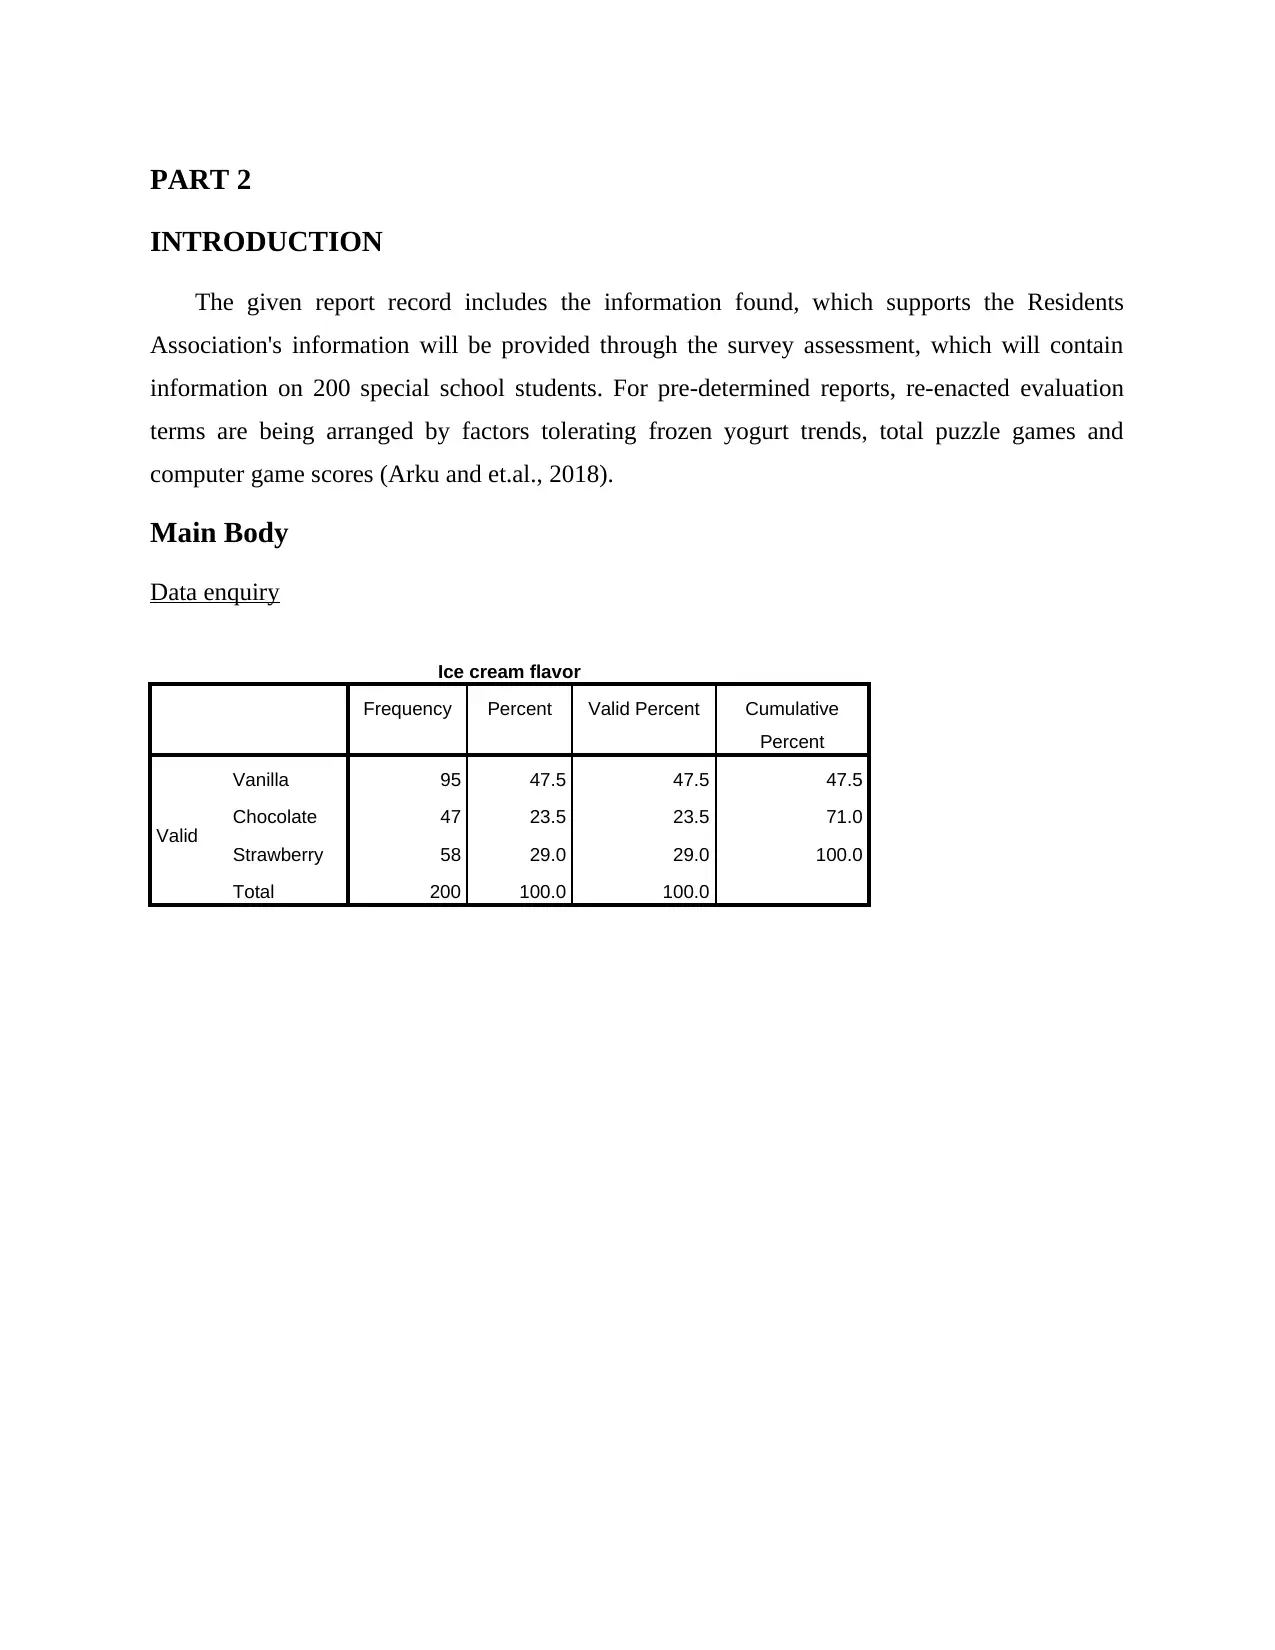
PART 2
INTRODUCTION
The given report record includes the information found, which supports the Residents
Association's information will be provided through the survey assessment, which will contain
information on 200 special school students. For pre-determined reports, re-enacted evaluation
terms are being arranged by factors tolerating frozen yogurt trends, total puzzle games and
computer game scores (Arku and et.al., 2018).
Main Body
Data enquiry
Ice cream flavor
Frequency Percent Valid Percent Cumulative
Percent
Valid
Vanilla 95 47.5 47.5 47.5
Chocolate 47 23.5 23.5 71.0
Strawberry 58 29.0 29.0 100.0
Total 200 100.0 100.0
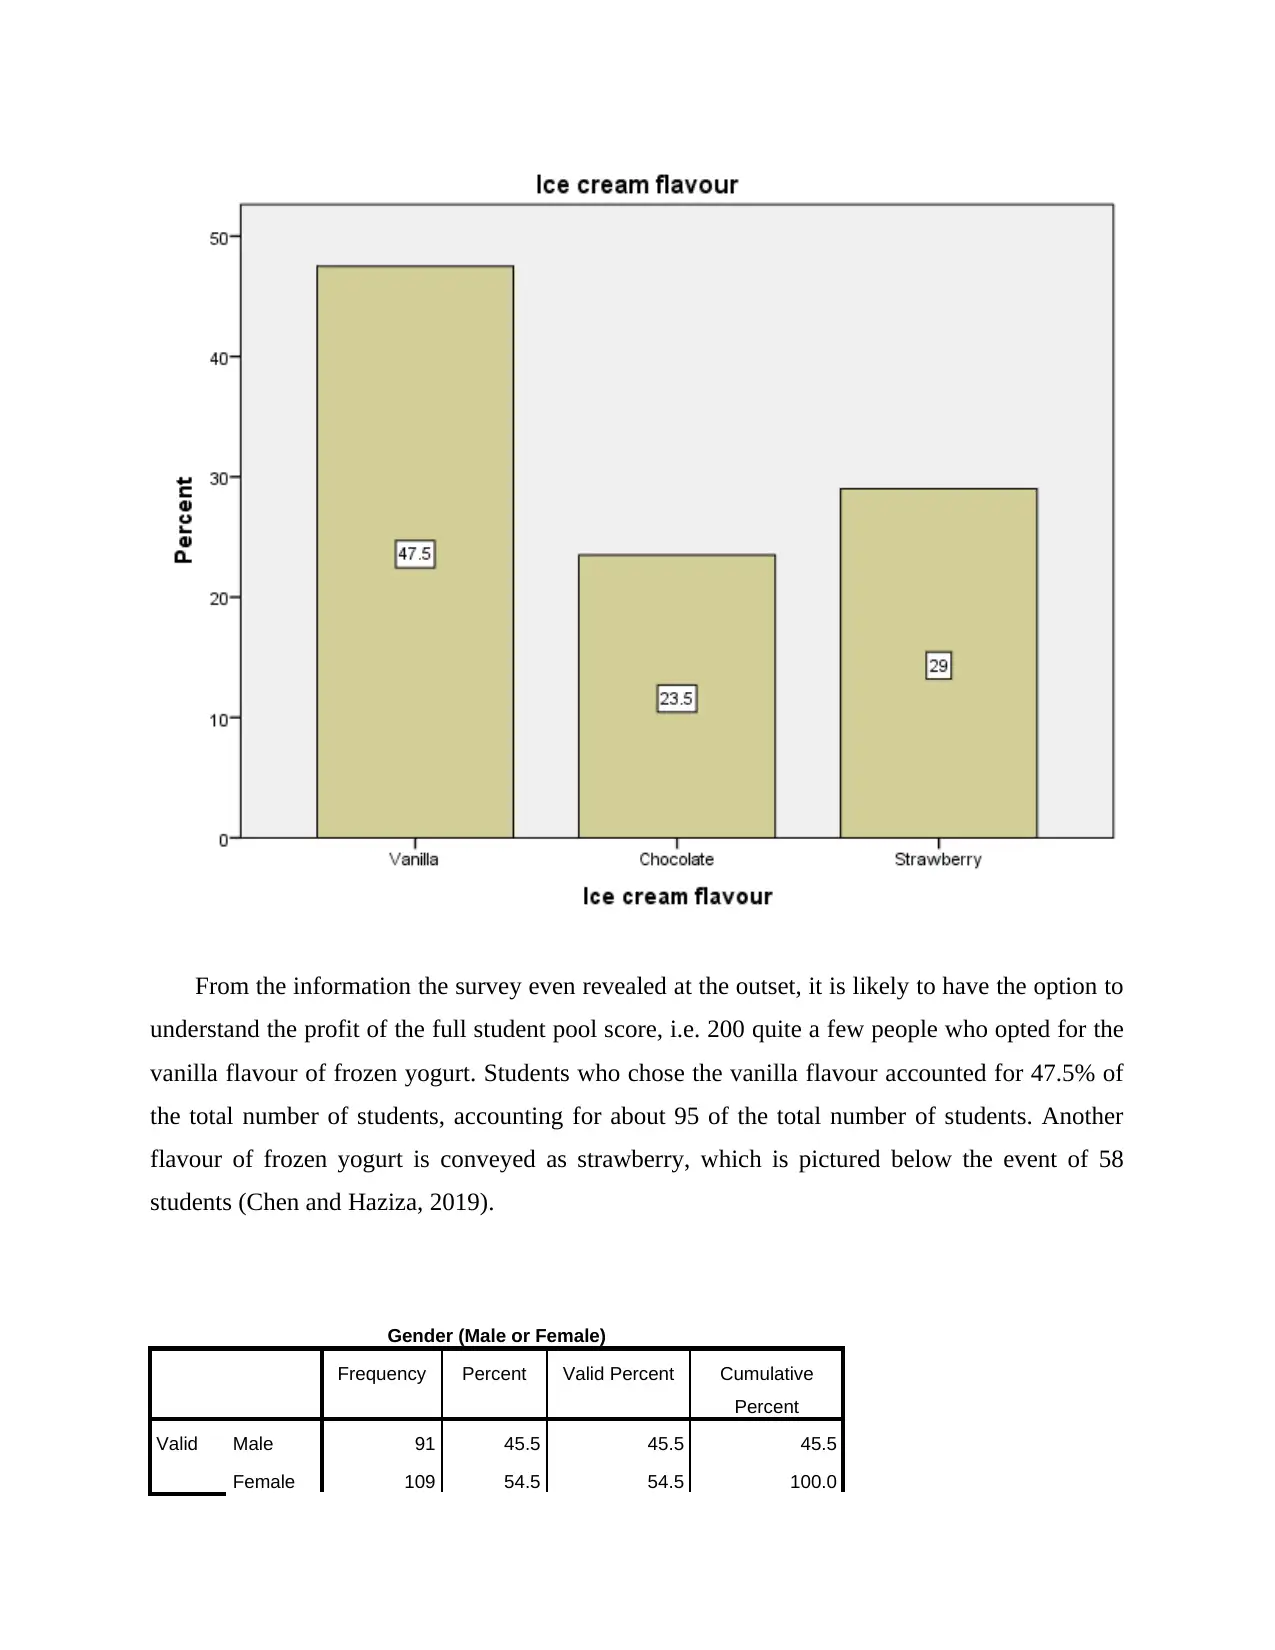
From the information the survey even revealed at the outset, it is likely to have the option to
understand the profit of the full student pool score, i.e. 200 quite a few people who opted for the
vanilla flavour of frozen yogurt. Students who chose the vanilla flavour accounted for 47.5% of
the total number of students, accounting for about 95 of the total number of students. Another
flavour of frozen yogurt is conveyed as strawberry, which is pictured below the event of 58
students (Chen and Haziza, 2019).
Gender (Male or Female)
Frequency Percent Valid Percent Cumulative
Percent
Valid Male 91 45.5 45.5 45.5
Female 109 54.5 54.5 100.0
⊘ This is a preview!⊘
Do you want full access?
Subscribe today to unlock all pages.
Trusted by 1+ million students worldwide
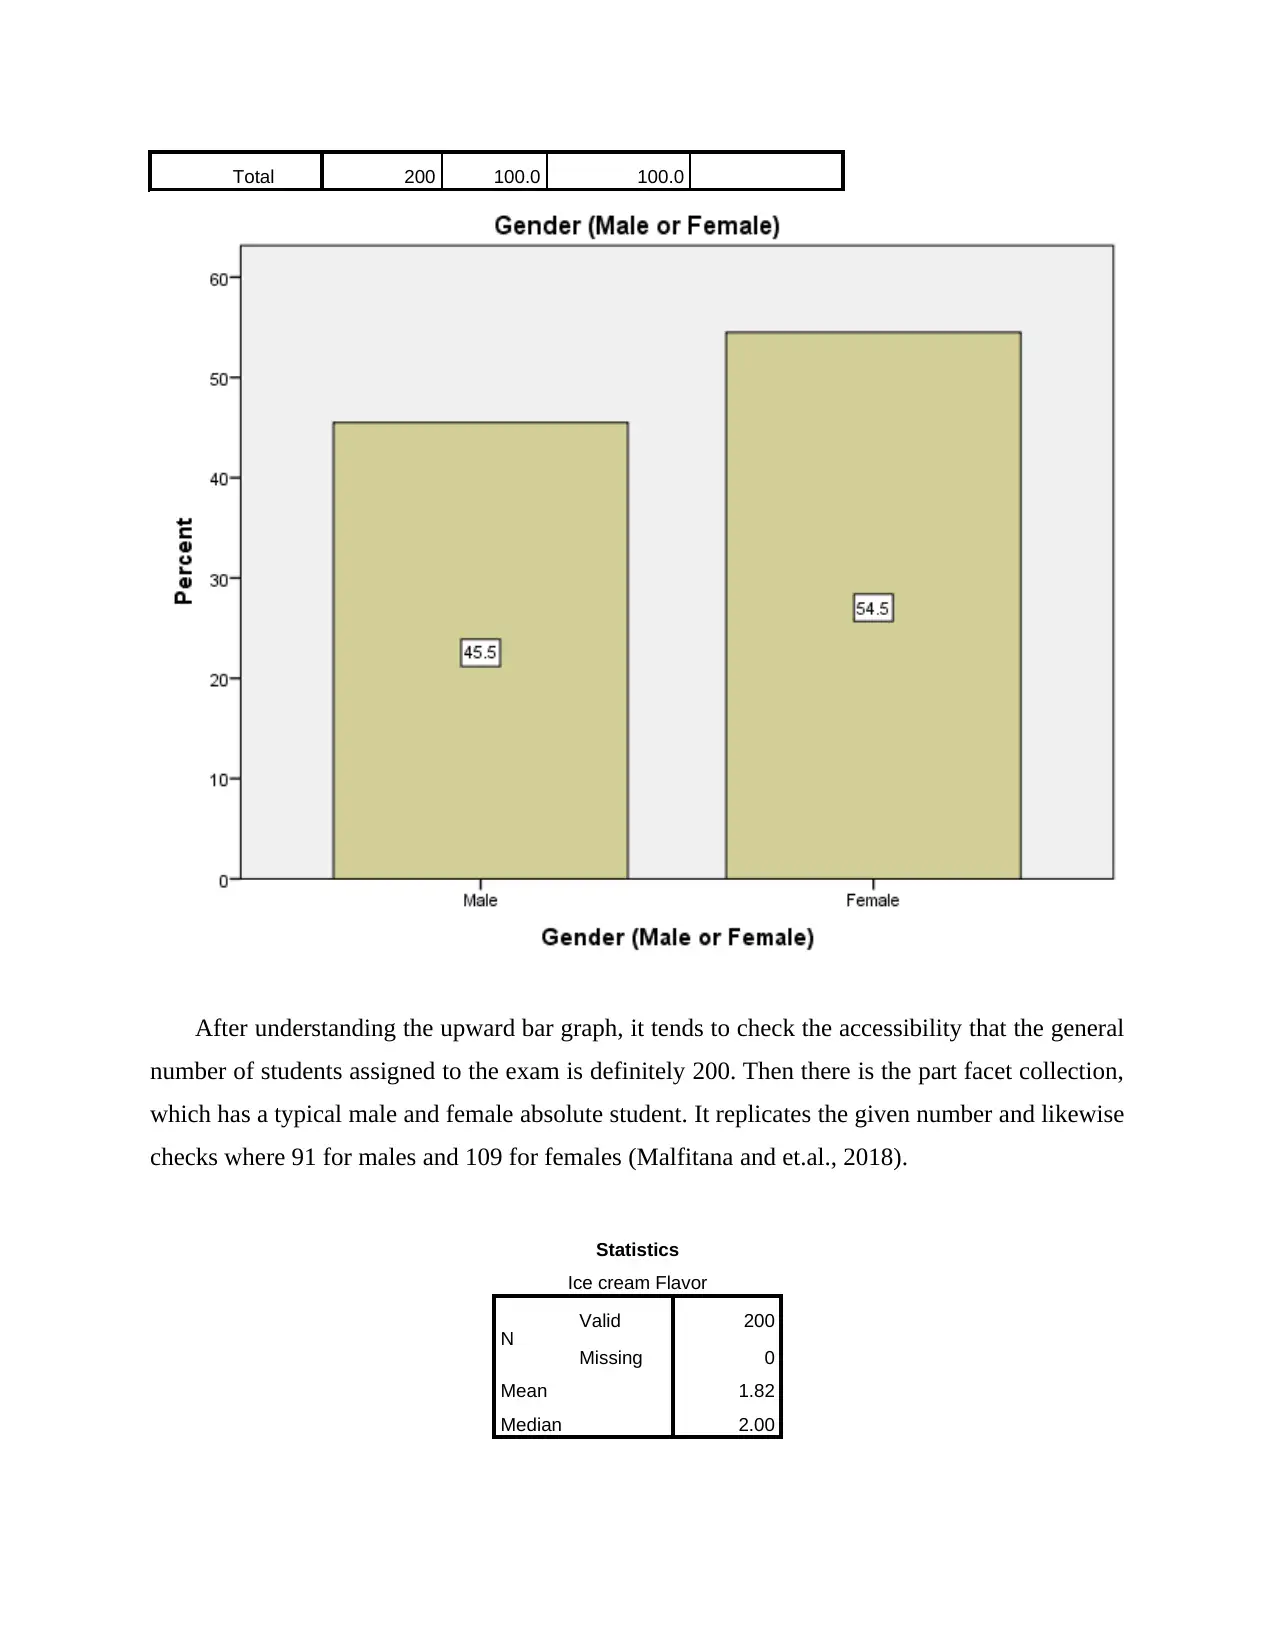
Total 200 100.0 100.0
After understanding the upward bar graph, it tends to check the accessibility that the general
number of students assigned to the exam is definitely 200. Then there is the part facet collection,
which has a typical male and female absolute student. It replicates the given number and likewise
checks where 91 for males and 109 for females (Malfitana and et.al., 2018).
Statistics
Ice cream Flavor
N Valid 200
Missing 0
Mean 1.82
Median 2.00
Paraphrase This Document
Need a fresh take? Get an instant paraphrase of this document with our AI Paraphraser
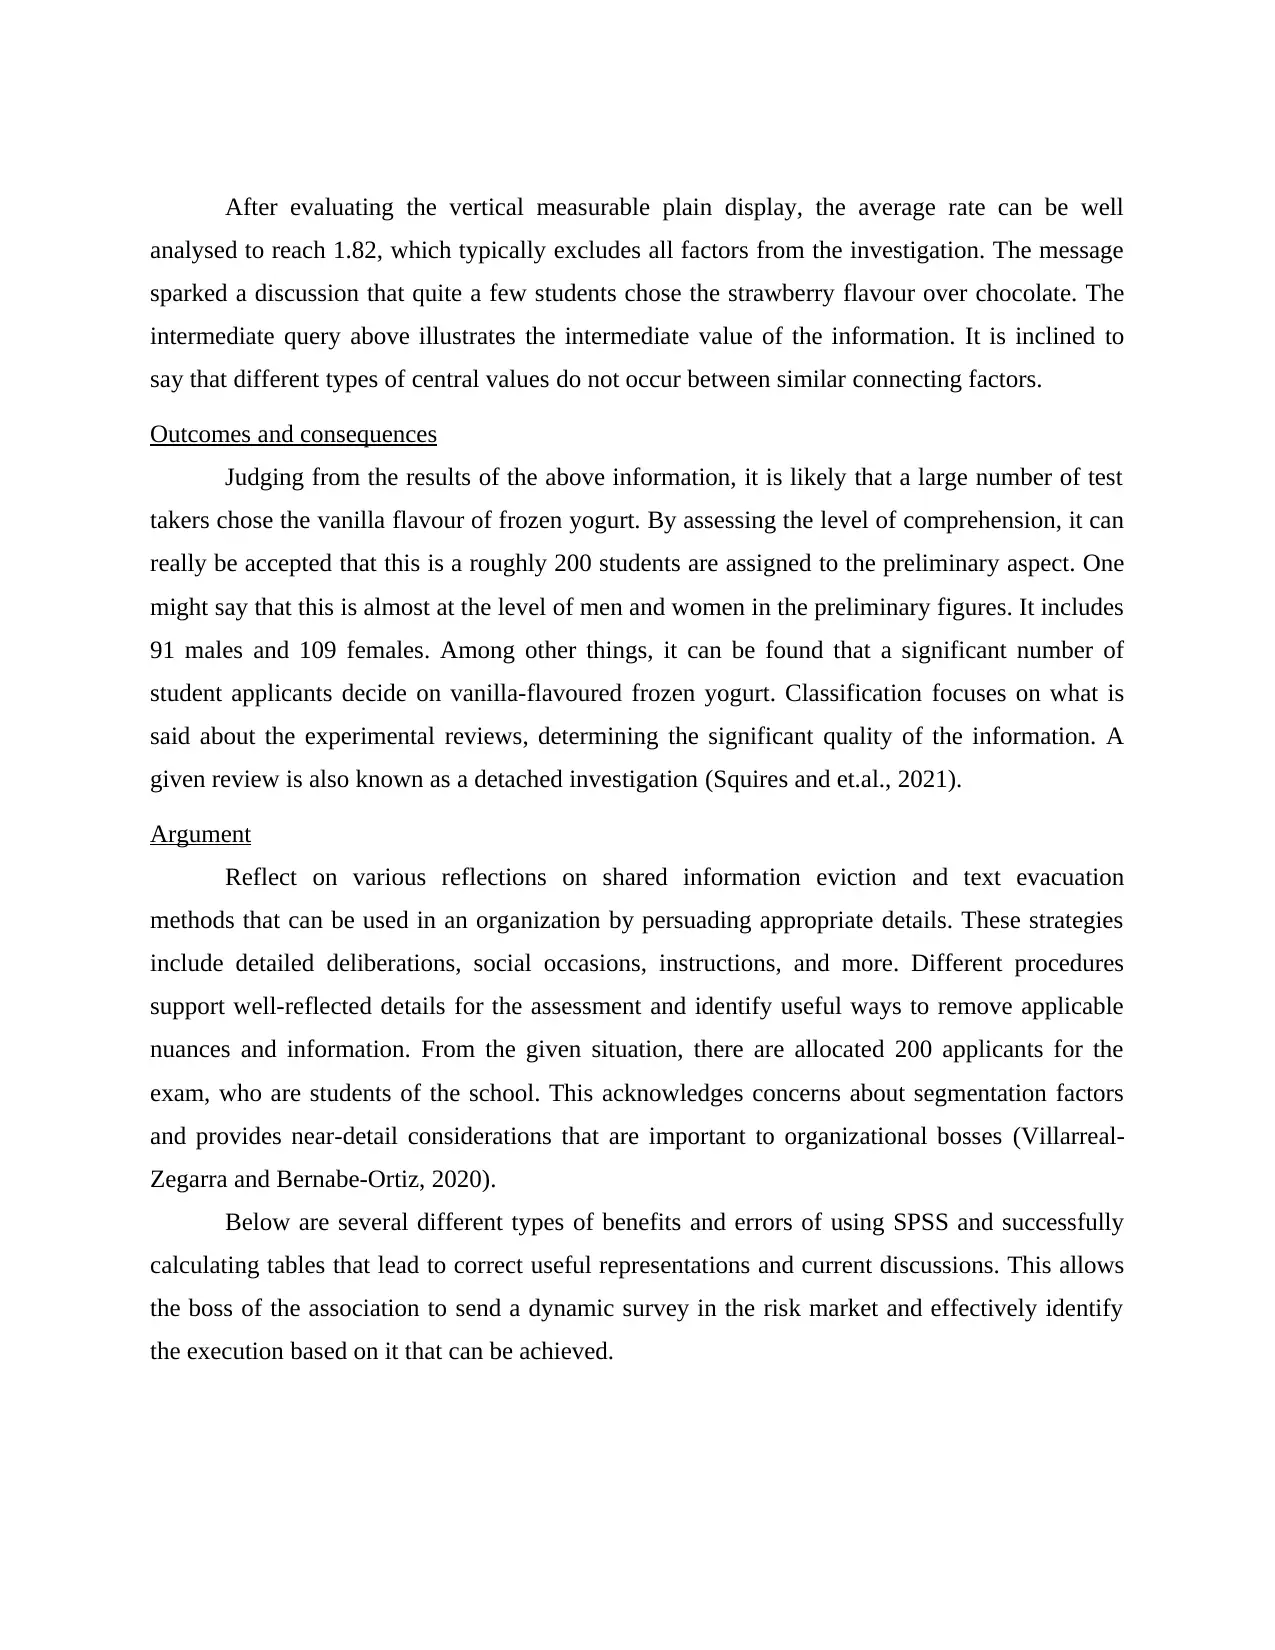
After evaluating the vertical measurable plain display, the average rate can be well
analysed to reach 1.82, which typically excludes all factors from the investigation. The message
sparked a discussion that quite a few students chose the strawberry flavour over chocolate. The
intermediate query above illustrates the intermediate value of the information. It is inclined to
say that different types of central values do not occur between similar connecting factors.
Outcomes and consequences
Judging from the results of the above information, it is likely that a large number of test
takers chose the vanilla flavour of frozen yogurt. By assessing the level of comprehension, it can
really be accepted that this is a roughly 200 students are assigned to the preliminary aspect. One
might say that this is almost at the level of men and women in the preliminary figures. It includes
91 males and 109 females. Among other things, it can be found that a significant number of
student applicants decide on vanilla-flavoured frozen yogurt. Classification focuses on what is
said about the experimental reviews, determining the significant quality of the information. A
given review is also known as a detached investigation (Squires and et.al., 2021).
Argument
Reflect on various reflections on shared information eviction and text evacuation
methods that can be used in an organization by persuading appropriate details. These strategies
include detailed deliberations, social occasions, instructions, and more. Different procedures
support well-reflected details for the assessment and identify useful ways to remove applicable
nuances and information. From the given situation, there are allocated 200 applicants for the
exam, who are students of the school. This acknowledges concerns about segmentation factors
and provides near-detail considerations that are important to organizational bosses (Villarreal‐
Zegarra and Bernabe‐Ortiz, 2020).
Below are several different types of benefits and errors of using SPSS and successfully
calculating tables that lead to correct useful representations and current discussions. This allows
the boss of the association to send a dynamic survey in the risk market and effectively identify
the execution based on it that can be achieved.

Merits and Demerits of using SPSS
Merits Demerits
The changes in inputs capacity can be
accomplished by utilizing SPSS.
SPSS instrument can't execute all possible
measurable interaction.
The record of information and forming
capacities are different advantage for the
utilization of SPSS.
The safe default for SPSS records is
programming points, so it's not ready to
transfer to someone who doesn't write
calculation tables.
Merits and Demerits of Excel
Merits Demerits
The definition of equations and object is
presence organized done utilization of Excel.
Nonappearance of control and wellbeing stops
in a difficult situation for utilizing Excel.
The clear testing of data and material kept by
using succeed is presence permitted by using
succeed (Wade and DeMaster, 2021).
The bookkeeping sheet programming of
succeed is vulnerable against misrepresentation
or contemptibility which is disguised beneath
one more fault for utilizing succeed.
Conclusion
As it is concluded from the above report that it Investigate there was individual
significance in choosing the flavour of frozen yogurt by understudies of the school who take
partake in the assessment was really dissect. This likewise includes in tracking down the suitable
information with regard to grasping the outcomes.
Merits Demerits
The changes in inputs capacity can be
accomplished by utilizing SPSS.
SPSS instrument can't execute all possible
measurable interaction.
The record of information and forming
capacities are different advantage for the
utilization of SPSS.
The safe default for SPSS records is
programming points, so it's not ready to
transfer to someone who doesn't write
calculation tables.
Merits and Demerits of Excel
Merits Demerits
The definition of equations and object is
presence organized done utilization of Excel.
Nonappearance of control and wellbeing stops
in a difficult situation for utilizing Excel.
The clear testing of data and material kept by
using succeed is presence permitted by using
succeed (Wade and DeMaster, 2021).
The bookkeeping sheet programming of
succeed is vulnerable against misrepresentation
or contemptibility which is disguised beneath
one more fault for utilizing succeed.
Conclusion
As it is concluded from the above report that it Investigate there was individual
significance in choosing the flavour of frozen yogurt by understudies of the school who take
partake in the assessment was really dissect. This likewise includes in tracking down the suitable
information with regard to grasping the outcomes.
⊘ This is a preview!⊘
Do you want full access?
Subscribe today to unlock all pages.
Trusted by 1+ million students worldwide
1 out of 17
Related Documents


Your All-in-One AI-Powered Toolkit for Academic Success.
+13062052269
info@desklib.com
Available 24*7 on WhatsApp / Email
![[object Object]](/_next/static/media/star-bottom.7253800d.svg)
Unlock your academic potential
Copyright © 2020–2026 A2Z Services. All Rights Reserved. Developed and managed by ZUCOL.