CIS8008 Business Intelligence: House Price Analysis using RapidMiner

Verified

Added on  2024/05/21

|17
|1986
|281
Report
AI Summary
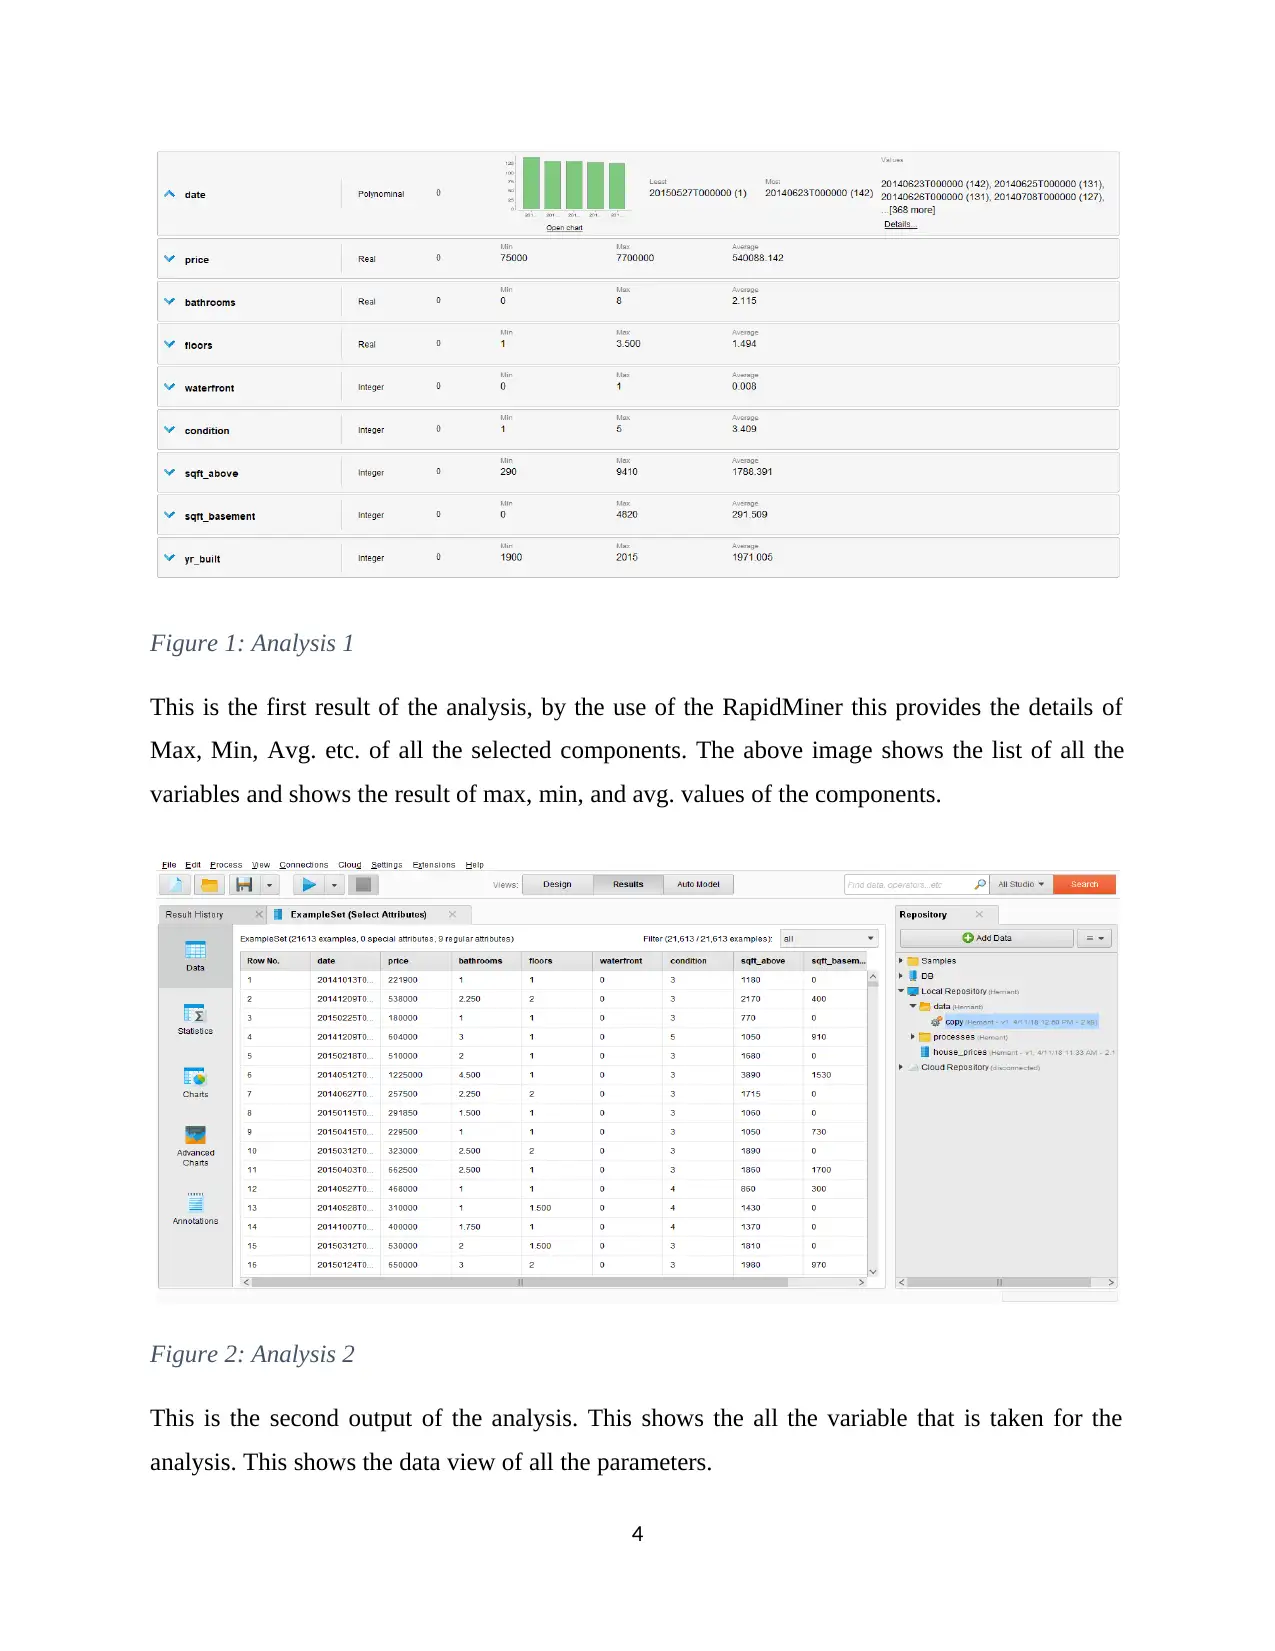
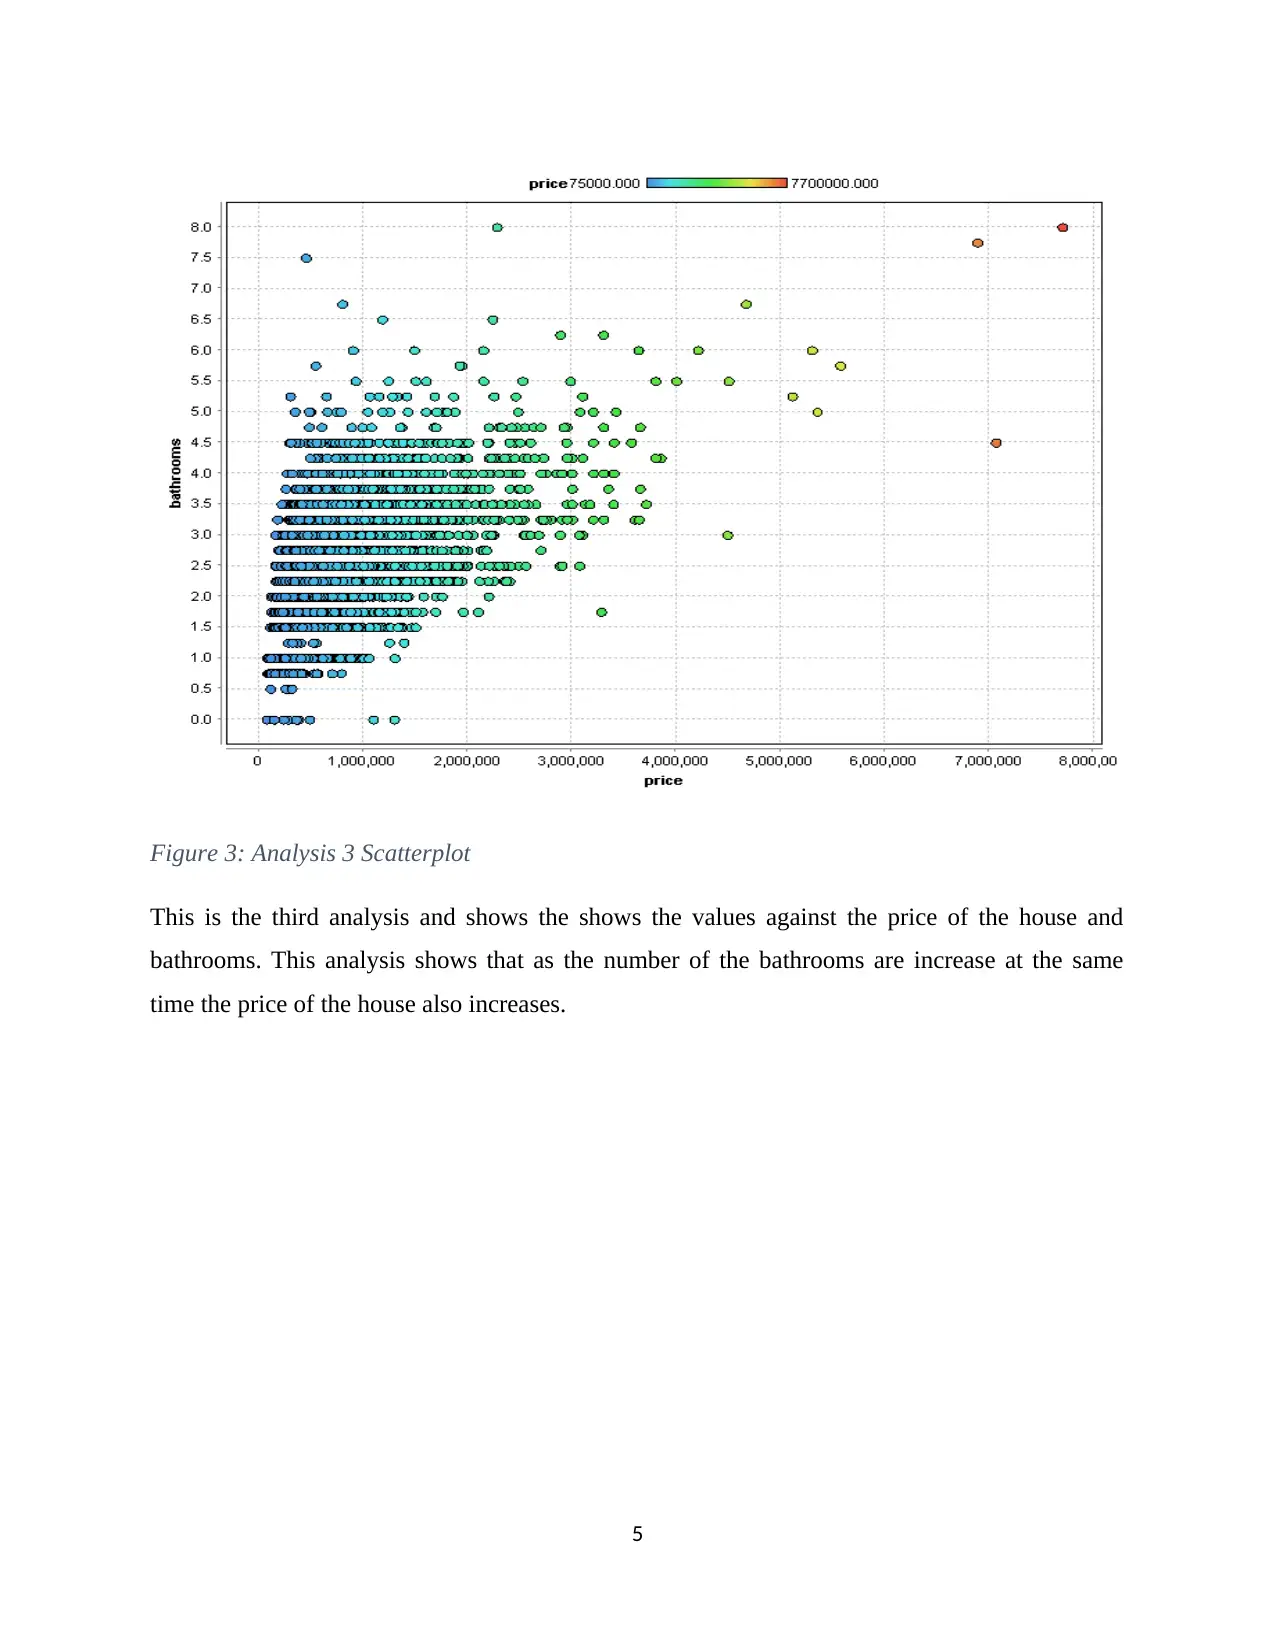
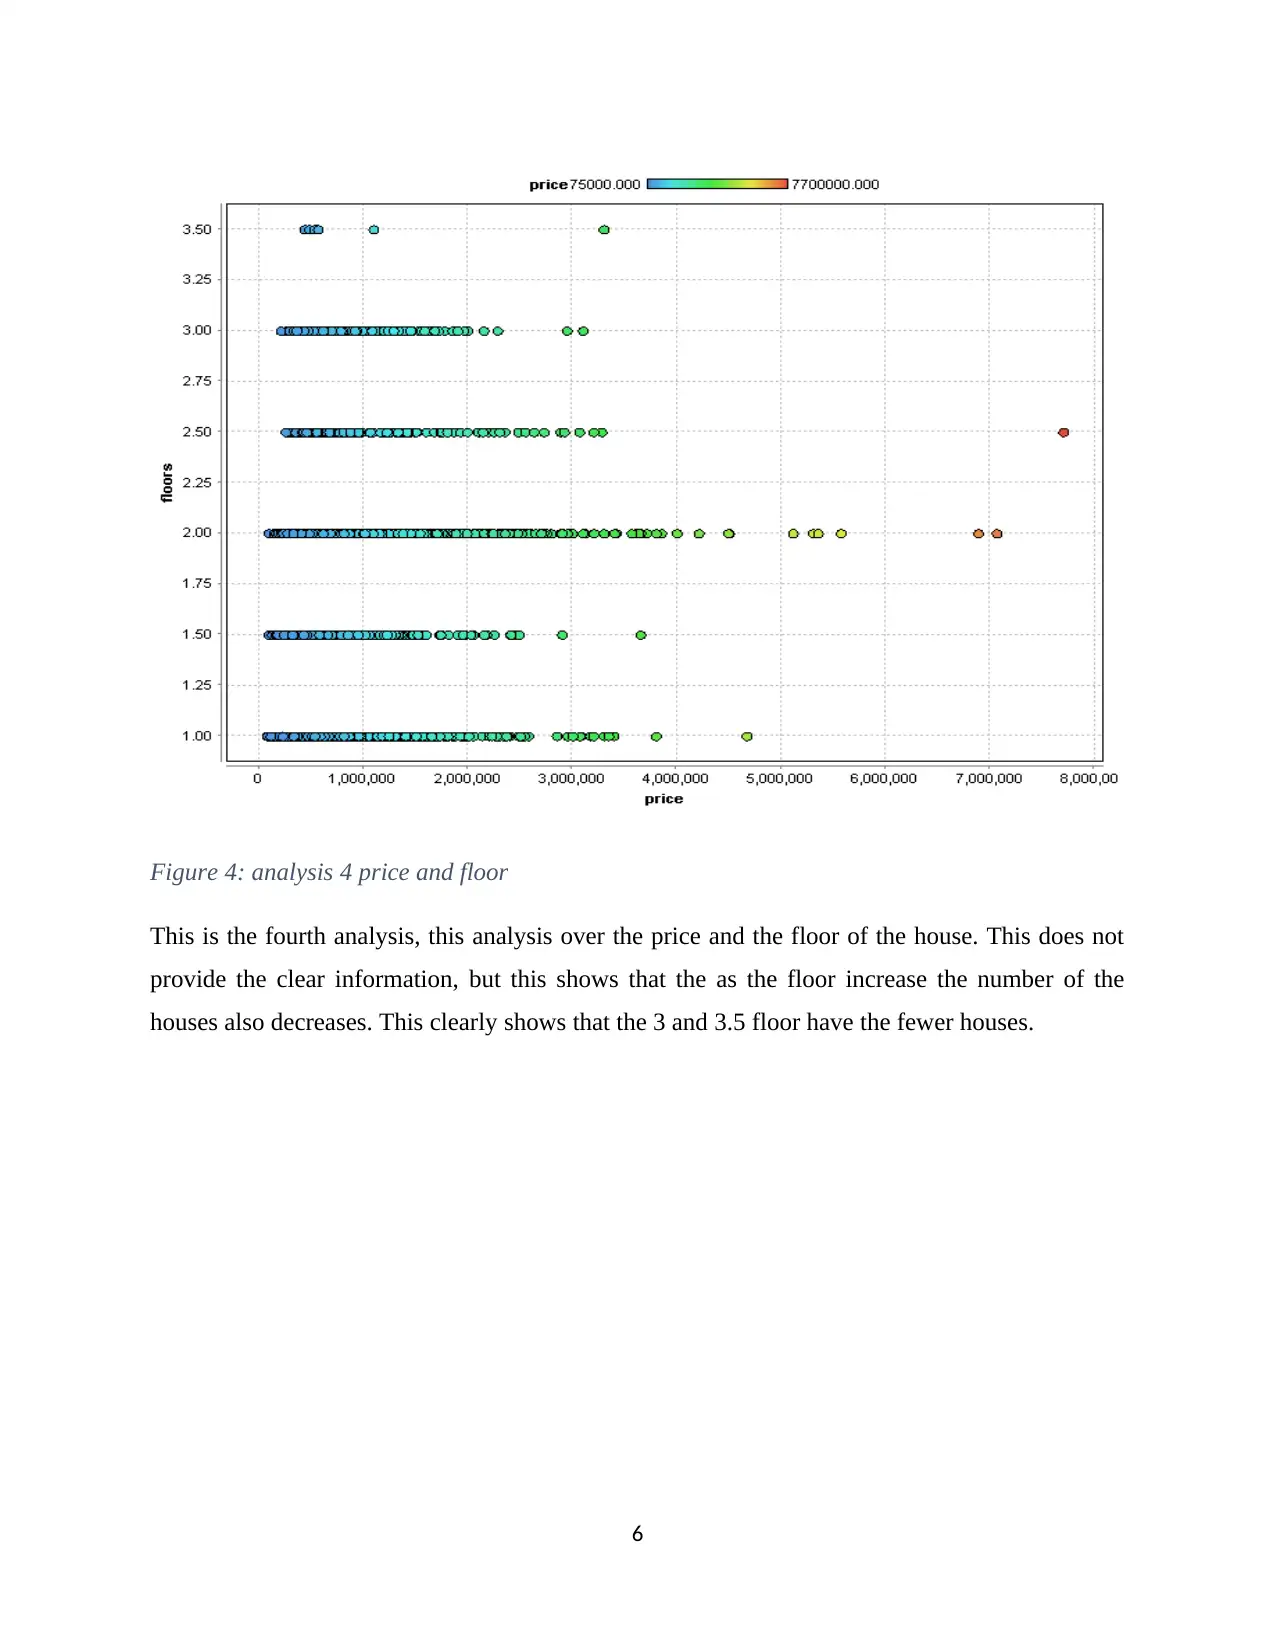
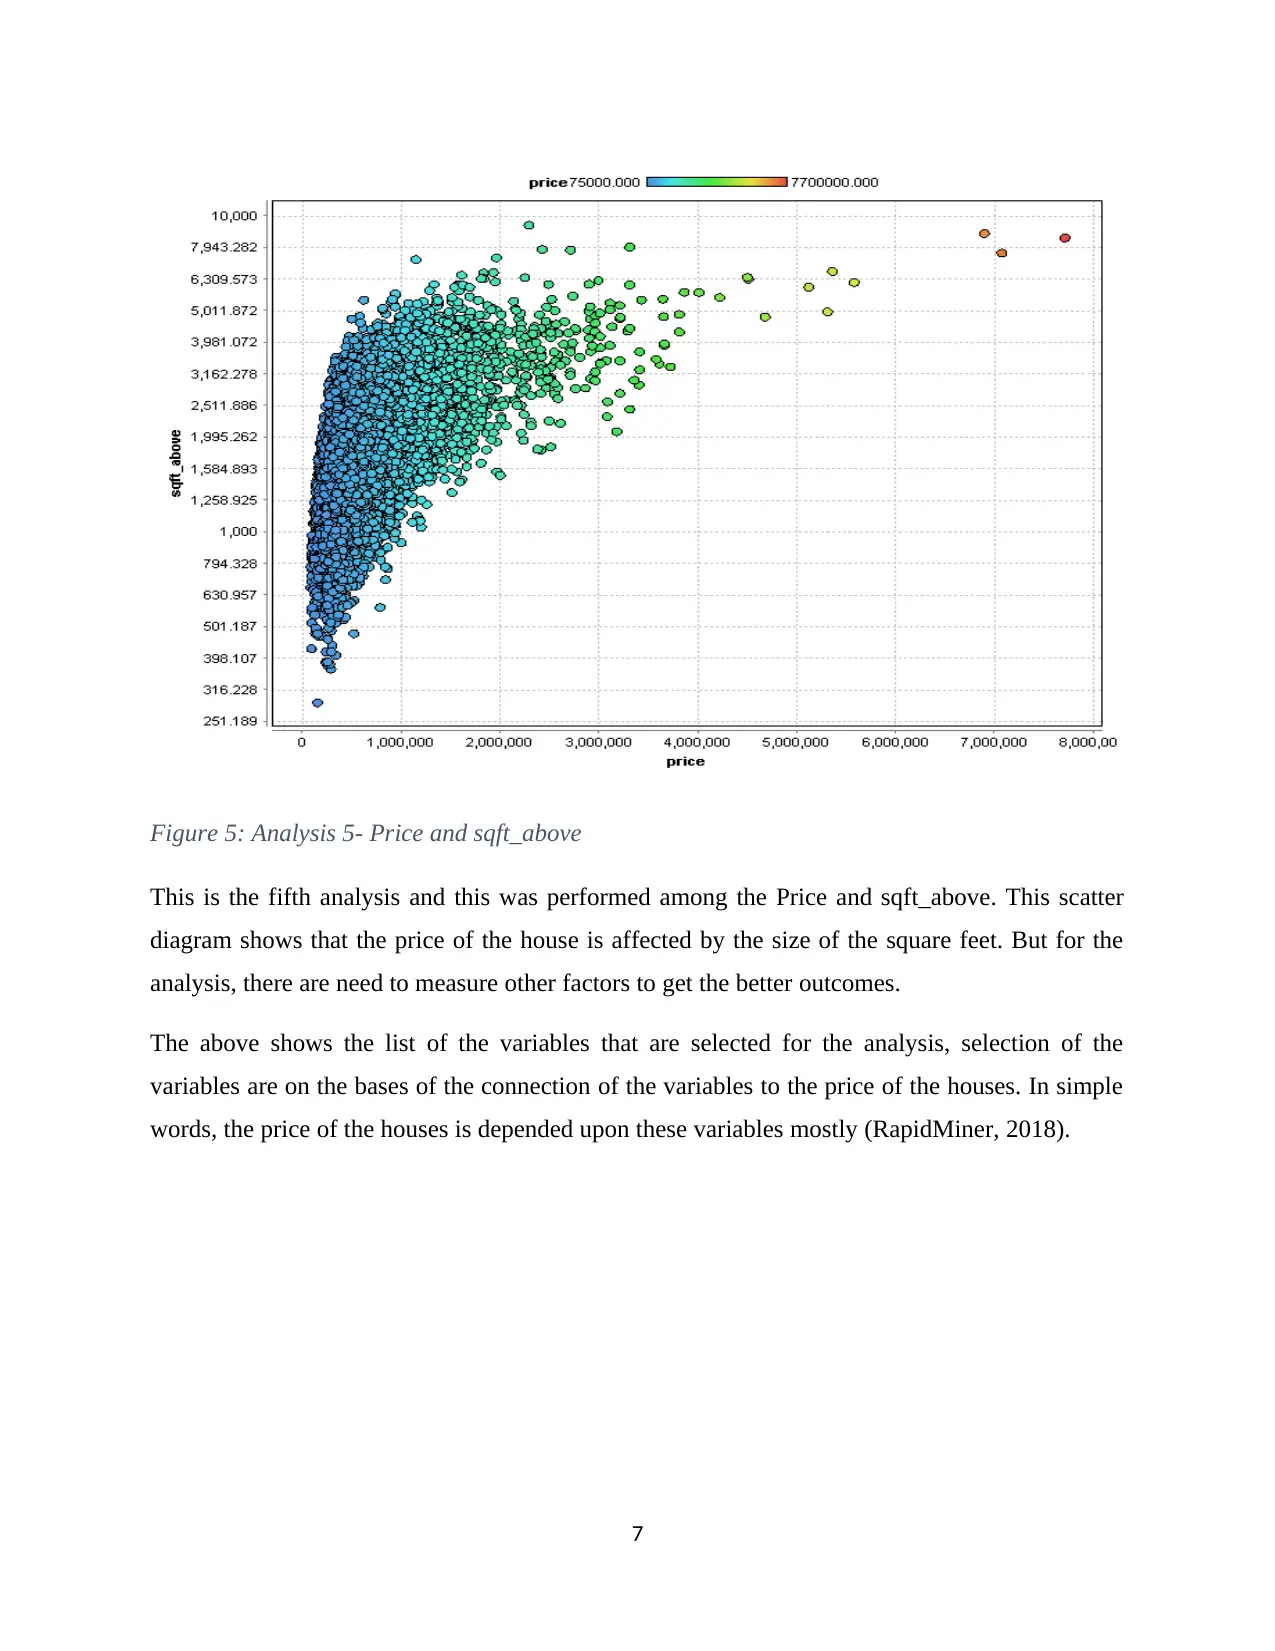
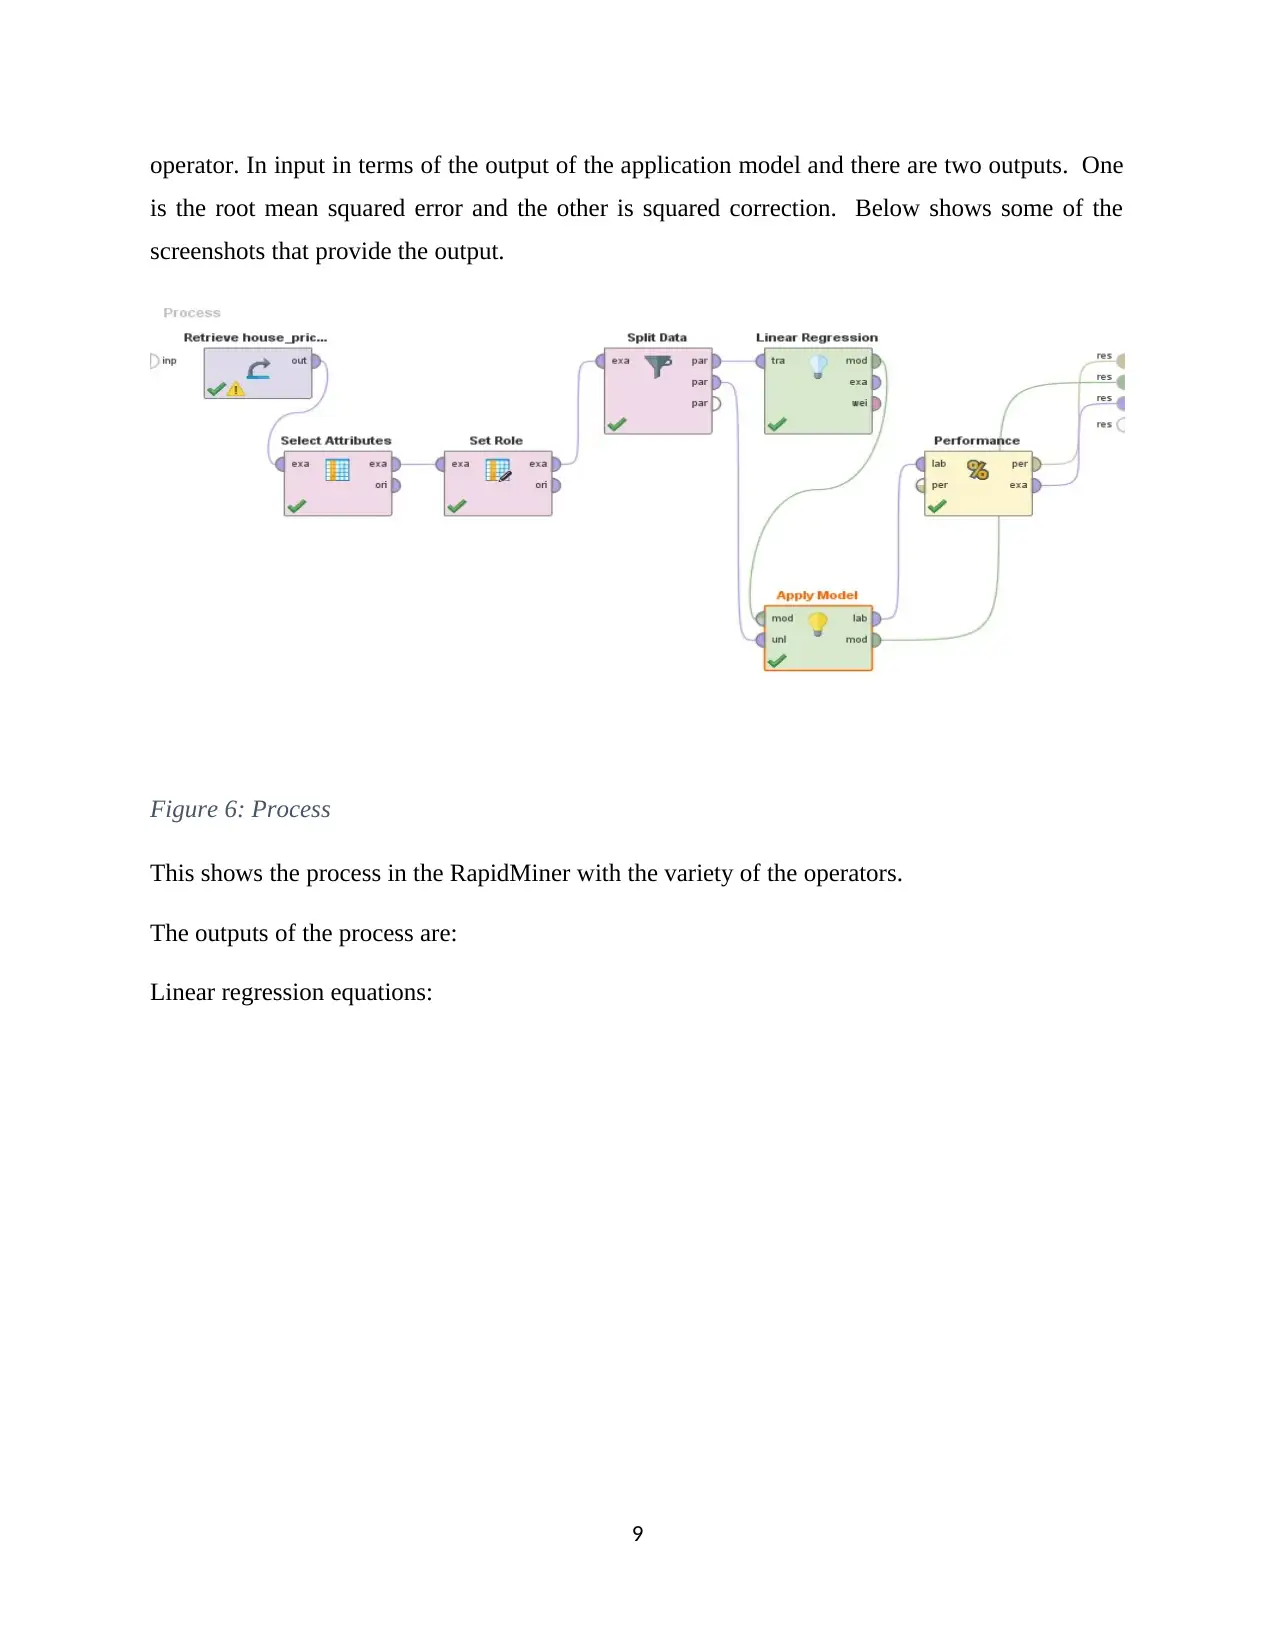
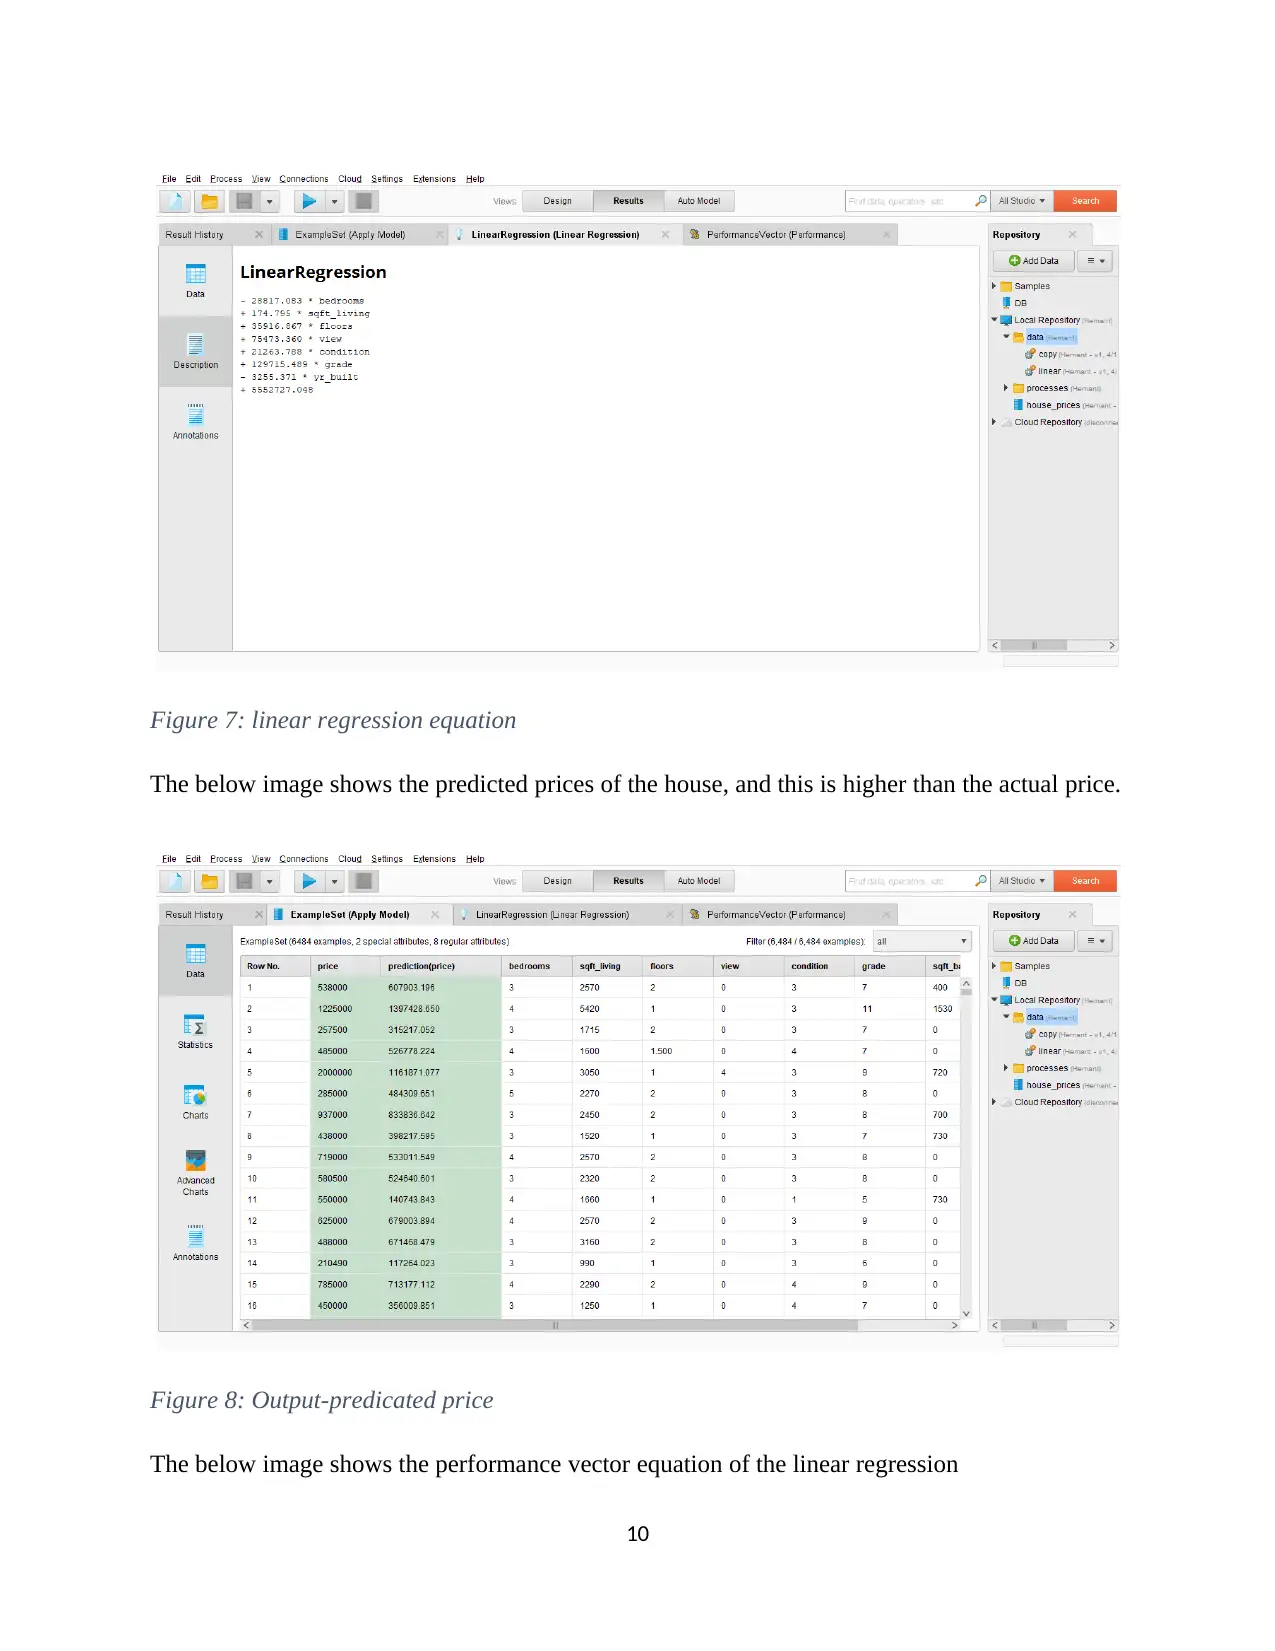
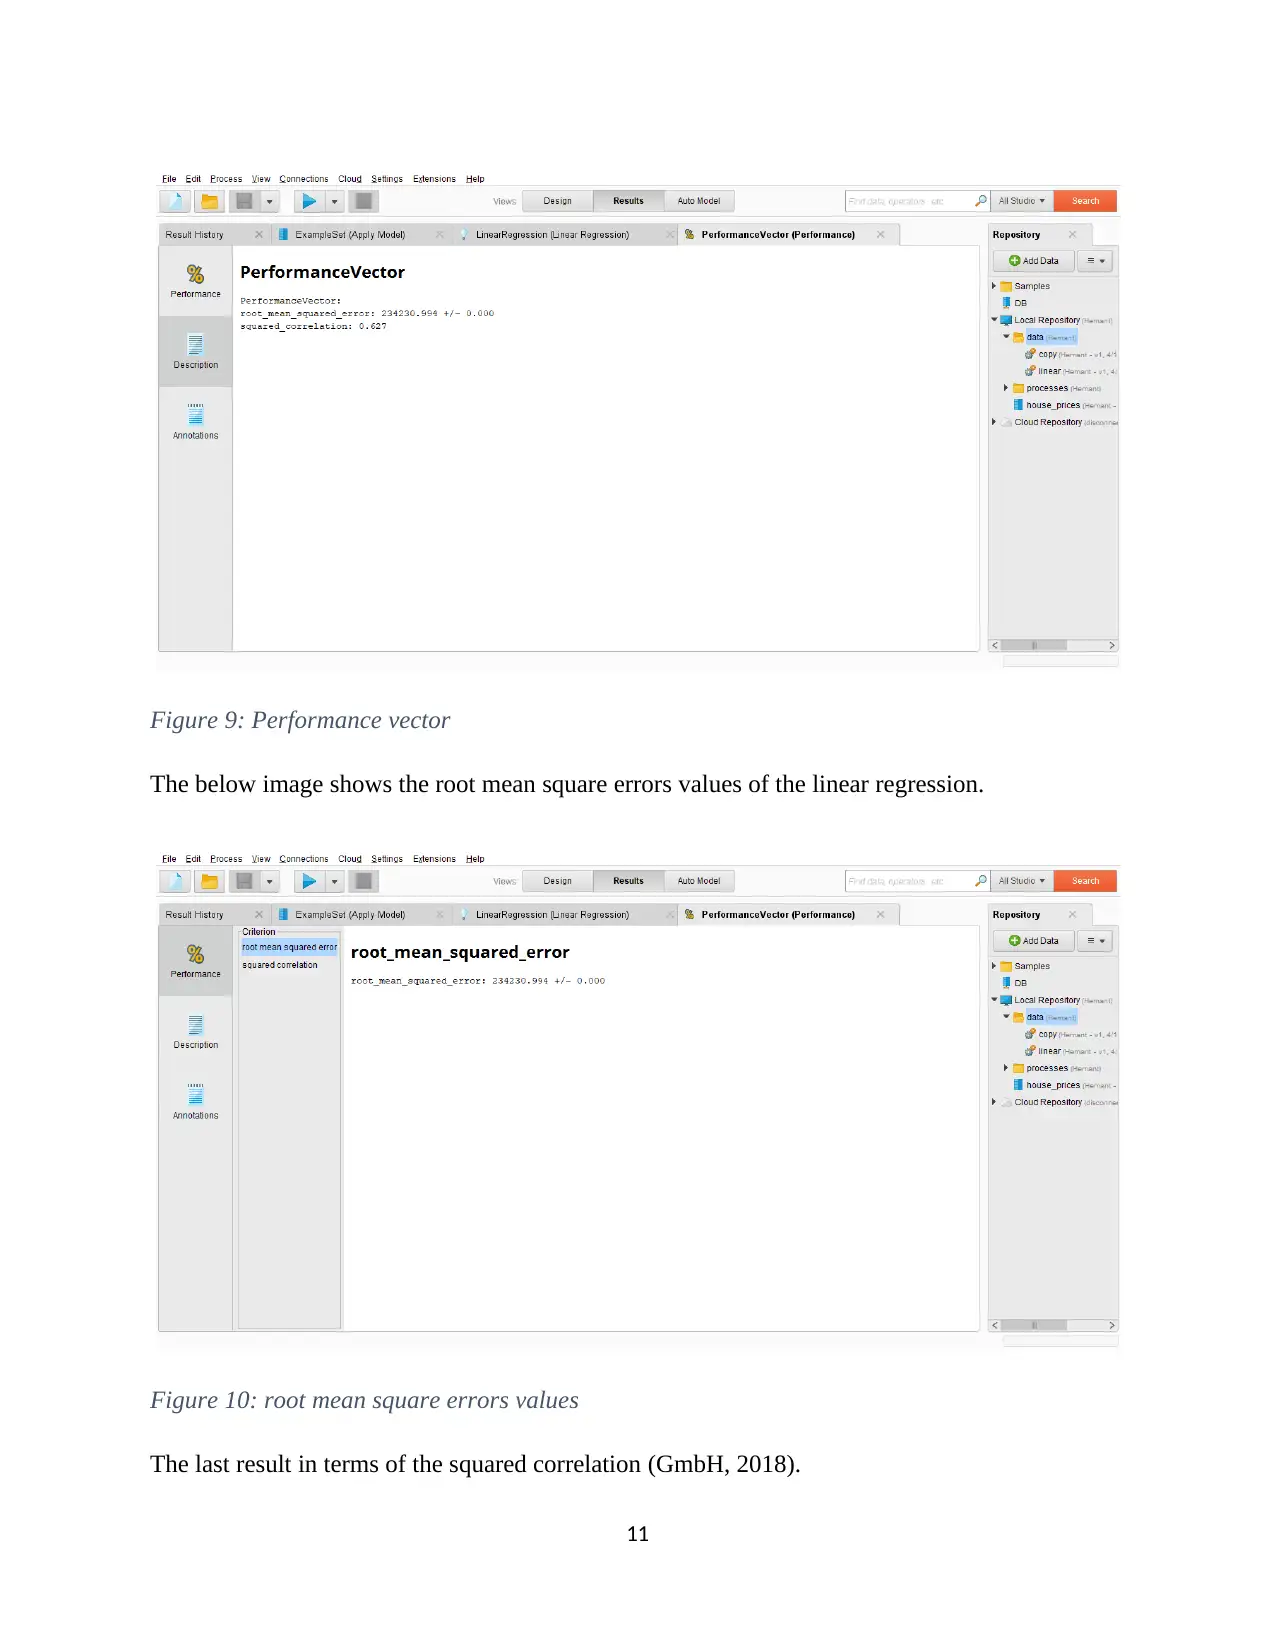
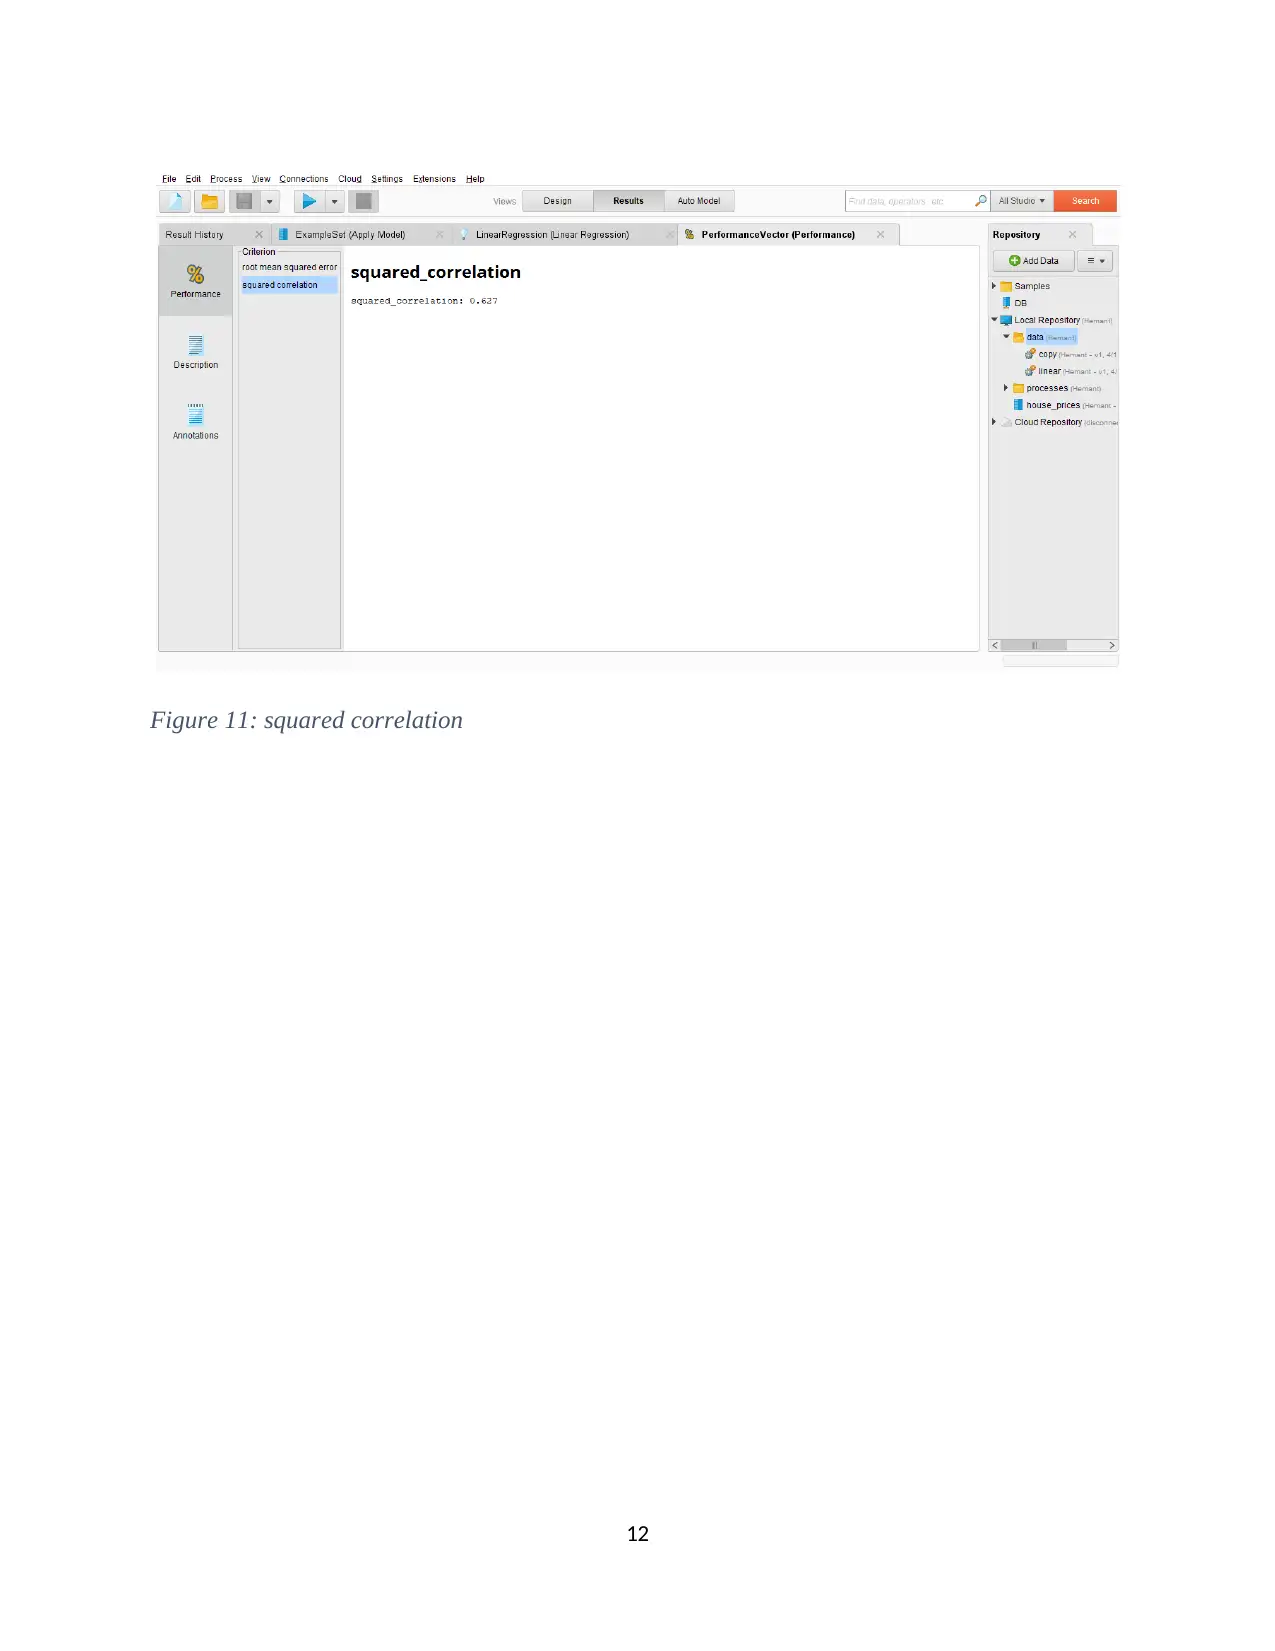
This report presents an analysis of house prices using Business Intelligence tools. It begins with Exploratory Data Analysis (EDA) using RapidMiner, focusing on key variables like price, bathrooms, floors, and location to understand their impact on house prices. Linear regression is then applied using RapidMiner to model the relationship between these variables and house prices, including steps for data import, attribute selection, model training, and performance evaluation, with a discussion of the resulting regression equations and error metrics. Finally, the report uses Tableau to visualize house prices, mapping them geographically and analyzing their trends based on factors like condition and square footage. The analysis utilizes .csv data, and the report explains the process of data preparation and geographical mapping within Tableau to provide insights into house price variations across different locations.
Document Page
CIS8008
Business Intelligence
Assessment 2
Student Name:
Student ID:
1
tabler-icon-diamond-filled.svg

Paraphrase This Document

Need a fresh take? Get an instant paraphrase of this document with our AI Paraphraser
Document Page
Contents
Task 1 Exploratory Data Analysis and Linear Regression Analysis...............................................3
Task 1.1........................................................................................................................................3
Task 1.2:.......................................................................................................................................8
Task 2 Tableau Desktop View of House Prices 2014 to 2015......................................................13
Task 2.1......................................................................................................................................13
Task 2.2......................................................................................................................................14
References......................................................................................................................................16
Appendices....................................................................................................................................17
2
Document Page
Task 1 Exploratory Data Analysis and Linear Regression Analysis
Task 1.1
This task is all about the RapidMiner and provides the information about the use of the
RapidMiner for the analysis of the data and performs the EDA process. For analysis the process,
the data is taken off the house-prices.csv. this provides the various information about the house
prices over the various conditions and also have the different options for the outcomes (Statpoint,
2018). There are around 20 variables and have the different connection to the house price. All are
the major factors of the system and all have the different impact on the price of the product. EDA
analysis is performed over the data set and there are a lot of the outcomes of the system. by the
help of the analysis, it is easy to understand the factors that will affect the price of the house
(Statistics, 2018).
For the analysis, among all the parameter of the cost and the price of the house, there are only a
few are selected and all have the direct impact on the house price. The some of the selected
variables are:
Price.
Bathrooms.
Floors.
Waterfront.
Sqft_basement.
Yr_build.
Long.
By the help of all these parameters, it is easy to analyse the price of the house. Below shows the
some of the screenshots of the analysis.
3
Document Page
Figure 1: Analysis 1
This is the first result of the analysis, by the use of the RapidMiner this provides the details of
Max, Min, Avg. etc. of all the selected components. The above image shows the list of all the
variables and shows the result of max, min, and avg. values of the components.
Figure 2: Analysis 2
This is the second output of the analysis. This shows the all the variable that is taken for the
analysis. This shows the data view of all the parameters.
4
tabler-icon-diamond-filled.svg

Paraphrase This Document

Need a fresh take? Get an instant paraphrase of this document with our AI Paraphraser
Document Page
Figure 3: Analysis 3 Scatterplot
This is the third analysis and shows the shows the values against the price of the house and
bathrooms. This analysis shows that as the number of the bathrooms are increase at the same
time the price of the house also increases.
5
Document Page
Figure 4: analysis 4 price and floor
This is the fourth analysis, this analysis over the price and the floor of the house. This does not
provide the clear information, but this shows that the as the floor increase the number of the
houses also decreases. This clearly shows that the 3 and 3.5 floor have the fewer houses.
6
Document Page
Figure 5: Analysis 5- Price and sqft_above
This is the fifth analysis and this was performed among the Price and sqft_above. This scatter
diagram shows that the price of the house is affected by the size of the square feet. But for the
analysis, there are need to measure other factors to get the better outcomes.
The above shows the list of the variables that are selected for the analysis, selection of the
variables are on the bases of the connection of the variables to the price of the houses. In simple
words, the price of the houses is depended upon these variables mostly (RapidMiner, 2018).
7
tabler-icon-diamond-filled.svg

Paraphrase This Document

Need a fresh take? Get an instant paraphrase of this document with our AI Paraphraser
Document Page
Task 1.2:
Refers to the linear regression, then this is the linear approach of the system, that defines the
relationship among different scalar dependent variables lets takes y on the explanatory variables
that are x. In other words, this shows the relationship between the two variables. For this case,
the linear regression process is done with the help of the RapidMiner. There are a lot of steps are
performed for the analysis, below list down the steps for the linear regression (Statistics, 2018).
Import the data into the design sheet of the RapidMiner by the help of double click, or by the
help of drop down. After the import of the data, there is one port into the system if that
connected to the output then the output shows full data. so, for that, some of the operations are
applied to them. The first operation is select attributes. This is applied to filter the attributes from
the list and select only the required variables that are directly related to the price of the house. By
the use of the select operator, there are some of the variables are selecting from the list.
Bedrooms
Conditions
Floors
Grade
Price.
Sqft_basement.
Sqft_living
View
Yr_build.
After that selecting the use of the other operation set role. This is used to decide the dependent
variables among all the other variables. In this case, the dependent variables are prices among all
the variables. After that use of the other operation that is known as the split data. by the use of
the split data, it is easy to partition the data into different subsets. For this case, the ratio is 7:3.
For this case using the shuffled sampling of the data. after that use of the linear regression
operator into the system. Into this, 70% of data is going into the linear regression. After that, to
test, the model of the 30% data use the different operator that is applied the model. In this one is
the output of the linear regression, and one is the output of the 30% of split data. in the end, there
is one more operator is added into the process that is to measure the performance regression
8
Document Page
operator. In input in terms of the output of the application model and there are two outputs. One
is the root mean squared error and the other is squared correction. Below shows some of the
screenshots that provide the output.
Figure 6: Process
This shows the process in the RapidMiner with the variety of the operators.
The outputs of the process are:
Linear regression equations:
9
Document Page
Figure 7: linear regression equation
The below image shows the predicted prices of the house, and this is higher than the actual price.
Figure 8: Output-predicated price
The below image shows the performance vector equation of the linear regression
10
tabler-icon-diamond-filled.svg

Paraphrase This Document

Need a fresh take? Get an instant paraphrase of this document with our AI Paraphraser
Document Page
Figure 9: Performance vector
The below image shows the root mean square errors values of the linear regression.
Figure 10: root mean square errors values
The last result in terms of the squared correlation (GmbH, 2018).
11
Document Page
Figure 11: squared correlation
12
chevron_up_icon
1 out of 17
circle_padding
hide_on_mobile
zoom_out_icon
[object Object]