Data Warehouse and Business Analytics Report on Environmental Issues
VerifiedAdded on 2023/06/07
|24
|4170
|275
Report
AI Summary
This report examines environmental problems through the lens of business intelligence and data warehousing, utilizing descriptive and prescriptive analysis techniques. It focuses on energy consumption, CO2 emissions, and their impacts, employing dashboards for visualization and analysis. The report provides an overview of environmental problems, CO2's effect on the environment, and different strategies for mitigating the impact of energy consumption. Descriptive analysis includes dashboard examples and SAP analysis of CO2 emissions, while prescriptive analysis explores solutions and recommendations. The report also covers the design of a mobile application and provides a justification for using BI reporting solutions to address environmental issues. The findings highlight the importance of data-driven insights in understanding and addressing environmental challenges, with a focus on creating innovative analytics solutions for a sustainable future.
DATA WAREHOUSE AND
BUSINESS ANALYTICS
Student Name:
Student ID:
BUSINESS ANALYTICS
Student Name:
Student ID:
Paraphrase This Document
Need a fresh take? Get an instant paraphrase of this document with our AI Paraphraser
Executive Summary
The aim of this report is to separate the problems related to environment with
the help of business Intelligence discernment device. Dashboard is considered as
the best example for this. On the other hand, this report coordinates with one of the
analysis such as, Descriptive and Prescriptive analysis. This is business
investigation that generates creative analysis arrangements. A primary thought of the
researcher is to guide the students to speak out their abilities as far as advancement
and innovations for the SAP Business Object or Predictive Analytics application,
which needs outlining the responses of advantageous perception for demonstrating
prescient models, so that it can recognize the systematic problems. Here, the
investigation corresponds with the problems of environment, using the Dashboard.
Then, this report’s target is to decide how high vitality utilization can cause
environmental contamination. In connection with assurance, the clear analysis and
the point of view for investigation is divided in this report, with the help of dashboard.
Therefore, the dashboard’s assistance helps to identify the primary execution
markers.
1
Table of Contents
Introduction........................................................................................................................................2
Problem Statement...........................................................................................................................4
Environment and related Issues...................................................................................................4
Impact of CO2 Use on Environment.............................................................................................5
BI Reporting Solution using Analytics........................................................................................6
1.1 Descriptive Analysis........................................................................................................6
1.1.1 Dashboard..................................................................................................................7
1.1.2 SAP Analysis..............................................................................................................9
1.2 Prescriptive Analysis.....................................................................................................10
1.2.1 Dashboard................................................................................................................11
1.2.2 SAP Analysis............................................................................................................12
1.3 Dash board Prototype....................................................................................................13
Design Mobile Application...........................................................................................................14
Justification of BI Reporting Solutionto deduct Environmental issues in Organizations
.............................................................................................................................................................15
Conclusion.......................................................................................................................................17
References.......................................................................................................................................18
2
⊘ This is a preview!⊘
Do you want full access?
Subscribe today to unlock all pages.
Trusted by 1+ million students worldwide
Introduction
The aim of this report is to separate the problems related to environment with the
help of business Intelligence discernment device. Here, dashboard is referred as the
best example. There is coordination with various analyses such as, Descriptive
analysis and Prescriptive analysis, in this report. It contains investigation of business
that generates creative arrangements for the analysis. This report’s primary idea
refers to provide instructions for the students to express the capabilities they have as
far as advancement and innovation of SAP Business Object or Predictive Analytics
application, there is a need of outlining the responses of advantageous perception
for demonstrating the prescient models. This helps in recognizing the systematic
problems. This report investigates the corresponded of the environmental issues, by
using the Dashboard. Furthermore, this report requests to execute the explanatory
instruments to create imaginative analysis perception arrangements and prescient
models to find the problems.
In this report, the problems which are serious includes, energy utilization.
Different environmental problems exists such as the following- decreasing water,
depletion of ozone, substance emanation, environmental change, vitality use,
contamination etc. The key environmental problems include, contamination,
Biodiversity loss, dangerous atmospheric deviation, Climatic Change, Deforestation,
excess population, Disposal of waste, Acid Rain, Depletion of environmental
resource, Depletion in the Ozone Layer, Acidification of Ocean, contamination in the
water, general medical problems and so on.
Today, there is change in earth’s environment and this fact cannot be refused.
According to the earth’s adjustments, it is important to stop the associated problems.
3
Paraphrase This Document
Need a fresh take? Get an instant paraphrase of this document with our AI Paraphraser
Different climatic changes occur due to global warming and cooling periods. This has
adverse impact like uncertain disasters. Thus, there must be some awareness made
related to the environmental risks that earth is confronting.
This report’s target refers to deciding how high the energy utilization could
results in environmental contamination. In connection with assurance, clear analysis
and the view point of the investigation will be subdivided, by using the dashboard.
The primary execution markers will be recognized by utilizing the dashboard.
Project Problem
As specified in the presentation, the given topic relates to environmental
problems, these problems relates as the foundation for environmental problems that
aren’t distinguished. It is carbon dioxide which causes the real problem in terms of
contaminating earth’s surroundings. Such an examination needs thorough
investigation, to decide how much high use of carbon dioxide could result in
environmental contamination. The connection among energy utilization as well as
the environmental problems should be spoken to enhance the environment of earth.
Generally, examination is complicated to be viewed in the business Intelligence
device. Thus, a Dashboard is suggested to have clear information ("15 Current
Environmental Problems That Our World is Facing - Conserve Energy Future",
2018).
Problems related to Environment
4
As the Global warming increases, the current environment has a serious
threat. In worldwide the examining the problems of environment are viewed by each
individual, at least once in a day, where energy utilization is one such problem.
Specific problems are small that could scarcely impact on the environmental system.
However, there are some environmental problems that can definitely transform the
nature. Thus, our Earth is at risks of various environmental calamities. The current
environmental issues build the vulnerabilities to calamities and tragedy. If such
problems aren’t taken care, earth will definitely see serious natural disasters. Earth’s
general population are busy in their lives and it is time for them to future of their next
generations. In light of the fact that their little imprudence can prompt difficult issue.
Because these serious environmental problems can harm the future generation.
Here, the vital point to be noted is that, it is difficult to physically end the harms which
are being caused to the ozone layer. However, different techniques are present that
could be taken care. For instance, expanding the awareness among the
neighbourhood networks and among the families who can show some commitment
to help the nature. Subsequently, when just some people hold on hands this can turn
into a substantial gathering and extensive commitment. Thus, it will surely have a
good place for human survival ("6 Best Practices for Creating Effective Dashboards",
2018).
CO2’s effect on the Environment
Their complicated natural impacts can particularly impact the society,
business, the organic frameworks, and the government hopes to ease the assets it
has with broad bearings. As the associations have straightforwardly delivered carbon
5
⊘ This is a preview!⊘
Do you want full access?
Subscribe today to unlock all pages.
Trusted by 1+ million students worldwide
dioxide, but it will logically identify that those outpouring contains high cost, both
related to cash as well as socially. With such lines, the organization which continue
standing on the side-lines would be gravely debilitated in concern of those who right
now are detailing with the techniques to diminish the risks and discover the high level
in a warming and in the world which is carbon-obliged.
Different strategies are available for diminishing the natural effects of energy
utilization. A portion of the strategies are recorded below ("Big Data Analytics:
Descriptive vs. Prescriptive - InformationWeek", 2018):
The energy consumption must be saved.
Transform to sources such as cleaner energy.
Cleanenergyrefers to energy proficiency, sustainable energy sources,
effective combined heat and power. Accompanying concentration should be
remembered while viewing the perfect energy, as follows:
It supports in decreasing the contamination of air.
It adds to decline the depleting substance in the ozone.
It decreases the energy consumption that likewise diminish the power
bills.
It enhances the energy framework's unwavering quality and security.
The clean energy will upgrade the financial improvement of state or the
neighbourhood with expanding work openings.
Analytics helping BI Reporting Solution
6
Paraphrase This Document
Need a fresh take? Get an instant paraphrase of this document with our AI Paraphraser
1.1 Descriptive Analysis
Descriptive Analytics is a strategy which sees the experiences that occurred
previously ("Business Intelligence Dashboard Examples and Templates", 2018). This
examination is indicated as the measurement investigation. Because, it clarifies
crude information and effortlessly helps in information translation. Benefits of such
an approach provides clarity and the understanding ability. The reasonable
information could without much of a stretch help to separate, over a wide span of
time, which causes the analysis to effectively finish up the of the information
examination’s consequences. The investigation indicates "A moment" time that is
crossed as past, for instance, "A year." Such an examination comprises of different
points of interest which assist the clients with learning vital subtle elements, when
contrasted and the past conduct. Likewise, it successfully appreciates the
explanation of how it impacts the future ("Business Intelligence | Microsoft", 2018).
1.1.1 Overview of Dashboard
The following clarification refers to dashboard:
Bar diagram is presented for information analyse.
Alternative of information examining is available, wherever the filtration is
completed based on the city, nation, date and the state.
Location of site is seen, which demonstrates the name, type, nation, address
and the area's territory (in square feet).
The dashboard represents the energy utilization.
It explains the diagram which demonstrates the benchmarks, previous
month’s usage, current month's usage and normal temperature.
In the dashboard, calendar’s accessibility is present.
7
Area’s climate status is mentioned.
Energy consumption is represented in terms of Kilowatt hour i.e., Kwh.
Main markers can be selected ("Business Intelligence | Reporting | Dashboard
| Cynosure Solutions", 2018).
In the dashboard, the climate conditions can be viewed as and when needed.
It provides the real time revealing.
The dashboard receives continuous data of the selected website, by making
use of internet browser.
The data needed is shared with any device such as versatile or a work area.
8
⊘ This is a preview!⊘
Do you want full access?
Subscribe today to unlock all pages.
Trusted by 1+ million students worldwide
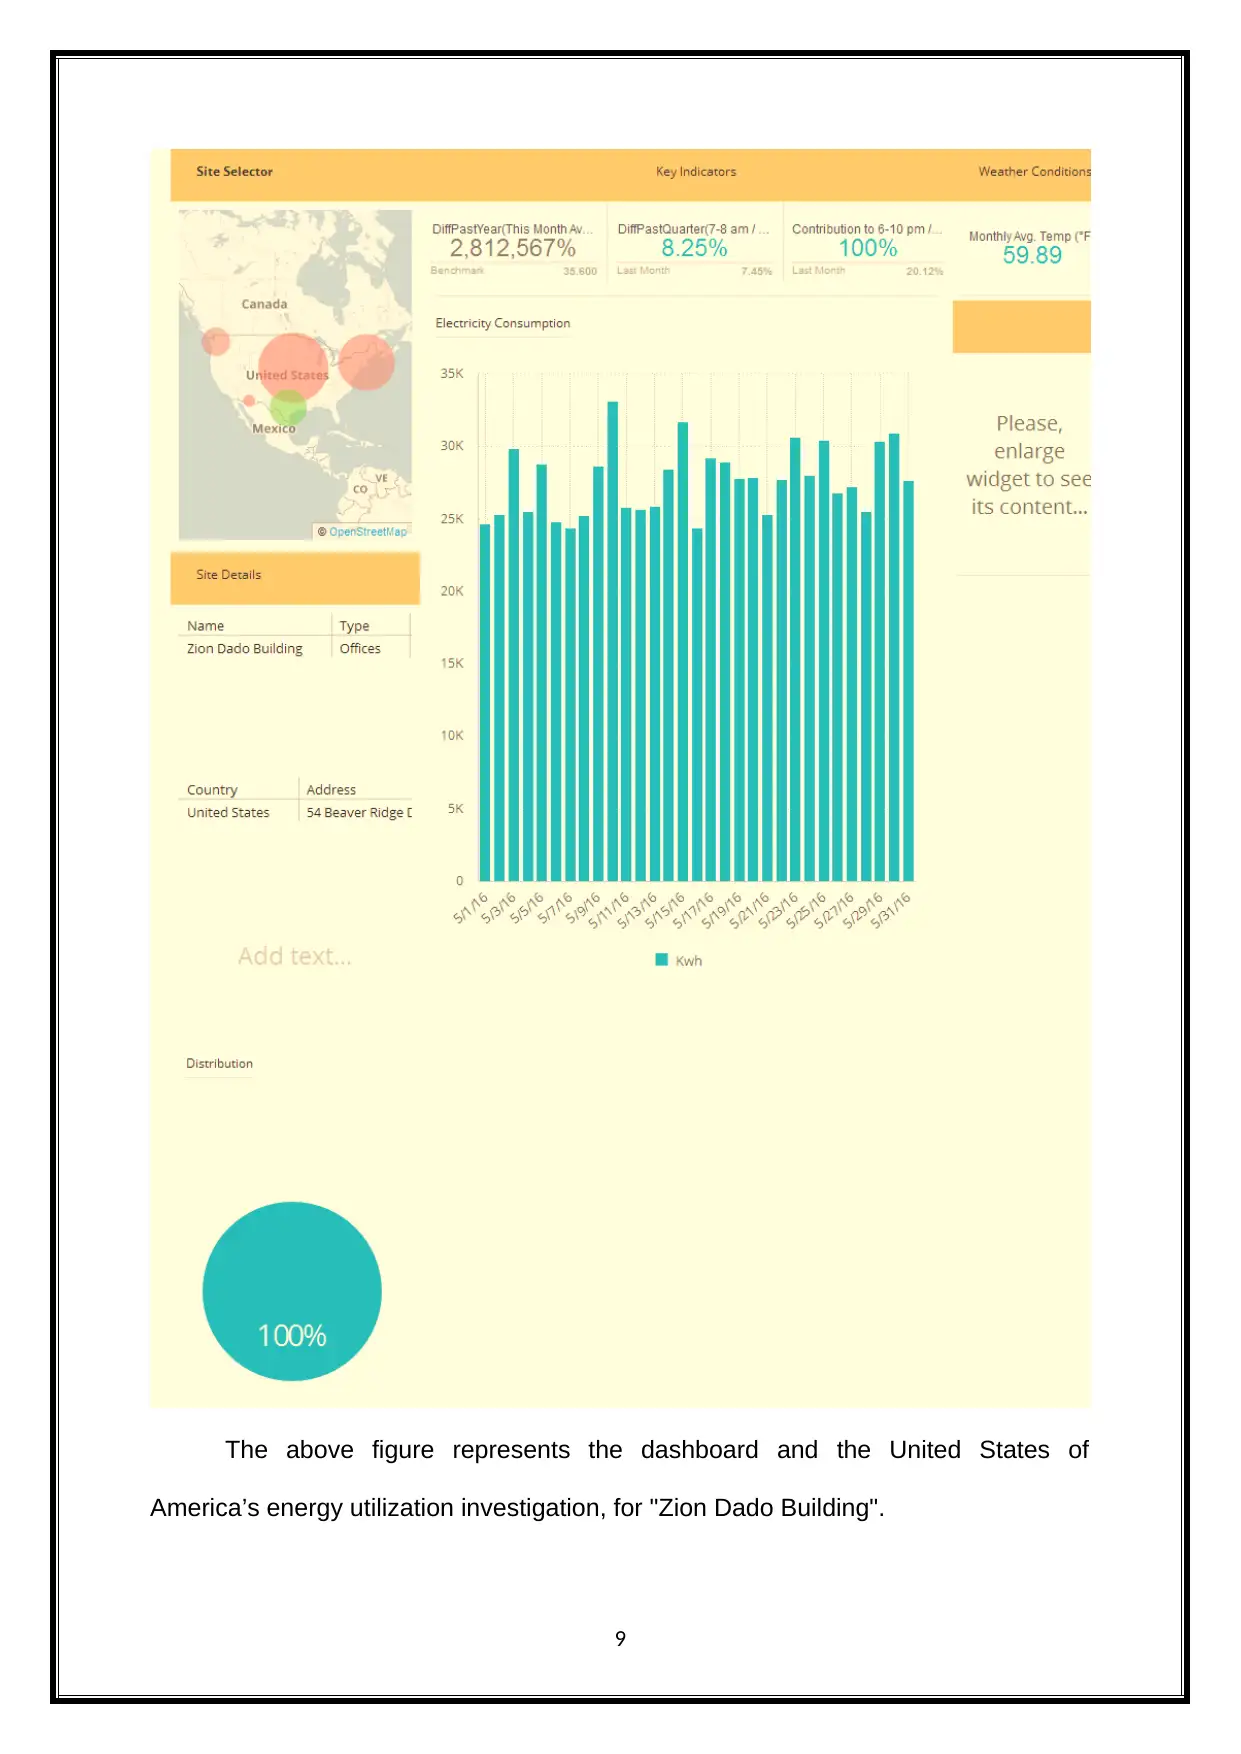
The above figure represents the dashboard and the United States of
America’s energy utilization investigation, for "Zion Dado Building".
9
America’s energy utilization investigation, for "Zion Dado Building".
9
Paraphrase This Document
Need a fresh take? Get an instant paraphrase of this document with our AI Paraphraser
In dashboard, the benchmarking denotes 35.600, however it has achieved 2,
812, 5675. A month ago the energy utilization was 7.45% between 7 to 8 am, and
during 6 to 10 pm the energy utilization was 20.12% ("Causes and Effects of
Environmental Pollution", 2018). While, the present qualities for 7 to 8 am indicates
8.25% and for 6 to 10 pm it demonstrates 100%. The month-to-month normal
temperature is appeared as 59.89 0F.
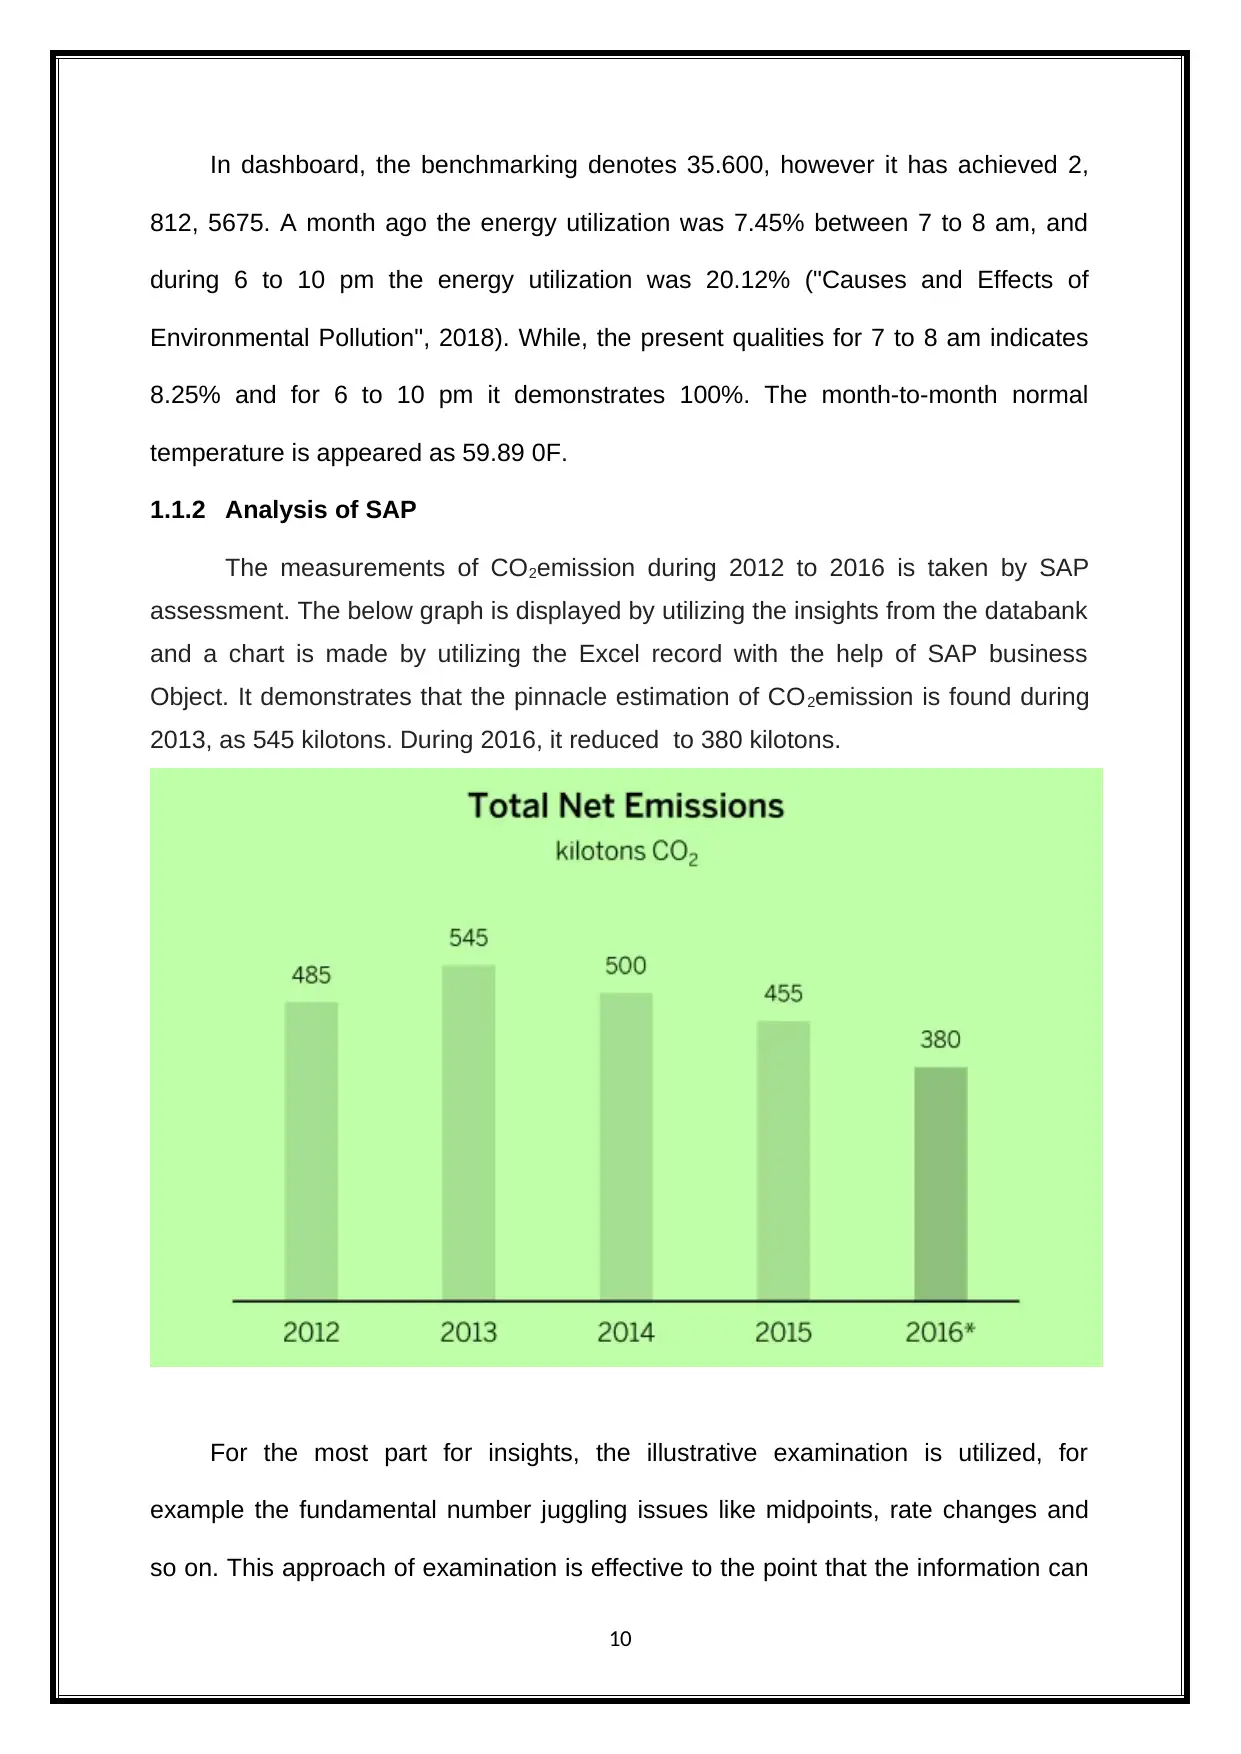
1.1.2 Analysis of SAP
The measurements of CO2emission during 2012 to 2016 is taken by SAP
assessment. The below graph is displayed by utilizing the insights from the databank
and a chart is made by utilizing the Excel record with the help of SAP business
Object. It demonstrates that the pinnacle estimation of CO2emission is found during
2013, as 545 kilotons. During 2016, it reduced to 380 kilotons.
For the most part for insights, the illustrative examination is utilized, for
example the fundamental number juggling issues like midpoints, rate changes and
so on. This approach of examination is effective to the point that the information can
10
812, 5675. A month ago the energy utilization was 7.45% between 7 to 8 am, and
during 6 to 10 pm the energy utilization was 20.12% ("Causes and Effects of
Environmental Pollution", 2018). While, the present qualities for 7 to 8 am indicates
8.25% and for 6 to 10 pm it demonstrates 100%. The month-to-month normal
temperature is appeared as 59.89 0F.
1.1.2 Analysis of SAP
The measurements of CO2emission during 2012 to 2016 is taken by SAP
assessment. The below graph is displayed by utilizing the insights from the databank
and a chart is made by utilizing the Excel record with the help of SAP business
Object. It demonstrates that the pinnacle estimation of CO2emission is found during
2013, as 545 kilotons. During 2016, it reduced to 380 kilotons.
For the most part for insights, the illustrative examination is utilized, for
example the fundamental number juggling issues like midpoints, rate changes and
so on. This approach of examination is effective to the point that the information can
10
be separated as far as segments and can be totalled. Along these lines, comparative
count can be effectively done utilizing the elucidating investigation. It additionally
backings to demonstrate the aggregate stock present in the stock, alongside client
points of interest like normal sum spent on each and every client, contingent upon
multi month or a year. The deals and benefit can be related effectively. The
announcing arrangement of unmistakable examination features the chronicled bits of
knowledge relying upon any association's financials condition, their activities,
creation, stock, deals and clients.
1.2 Prescriptive Analysis
The prescriptive Analytics utilizes the calculation like restructuring and rebuilding, to
give successful appeal on the outcomes. The investigation finds the required
solutions like what must be done further. The conceivable activities are recognised
by this investigation. The provided prescriptions fill as direction, which prompts the
correct arrangement. The benefits of this examination are powerful and reasonable.
Further, it helps in the basic leadership. Despite the fact that it can't foresee what
may occur in the future, however without any doubt it decides why it happened and
recommends some gainful proposals("Causes and Effects of Environmental Pollution
- Conserve Energy Future", 2018). The proposals are great and can settle the issue.
1.2.1 Dashboard
The Business Intelligence dashboard changes the conventional reports of
business knowledge and displays a prescient execution metric. The business insight
dashboard detailing utilizes perceptive implementation announcing framework. Since
it can track the data, as the detailing framework checks the process reliability for
delivering the response. If there should be an occurrence of preparing control, the
11
⊘ This is a preview!⊘
Do you want full access?
Subscribe today to unlock all pages.
Trusted by 1+ million students worldwide
1 out of 24
Related Documents


Your All-in-One AI-Powered Toolkit for Academic Success.
+13062052269
info@desklib.com
Available 24*7 on WhatsApp / Email
![[object Object]](/_next/static/media/star-bottom.7253800d.svg)
Unlock your academic potential
Copyright © 2020–2026 A2Z Services. All Rights Reserved. Developed and managed by ZUCOL.