Analysis of Football Club Performance Using BI and Analytics Systems
VerifiedAdded on  2020/07/22
|20
|2345
|124
Report
AI Summary
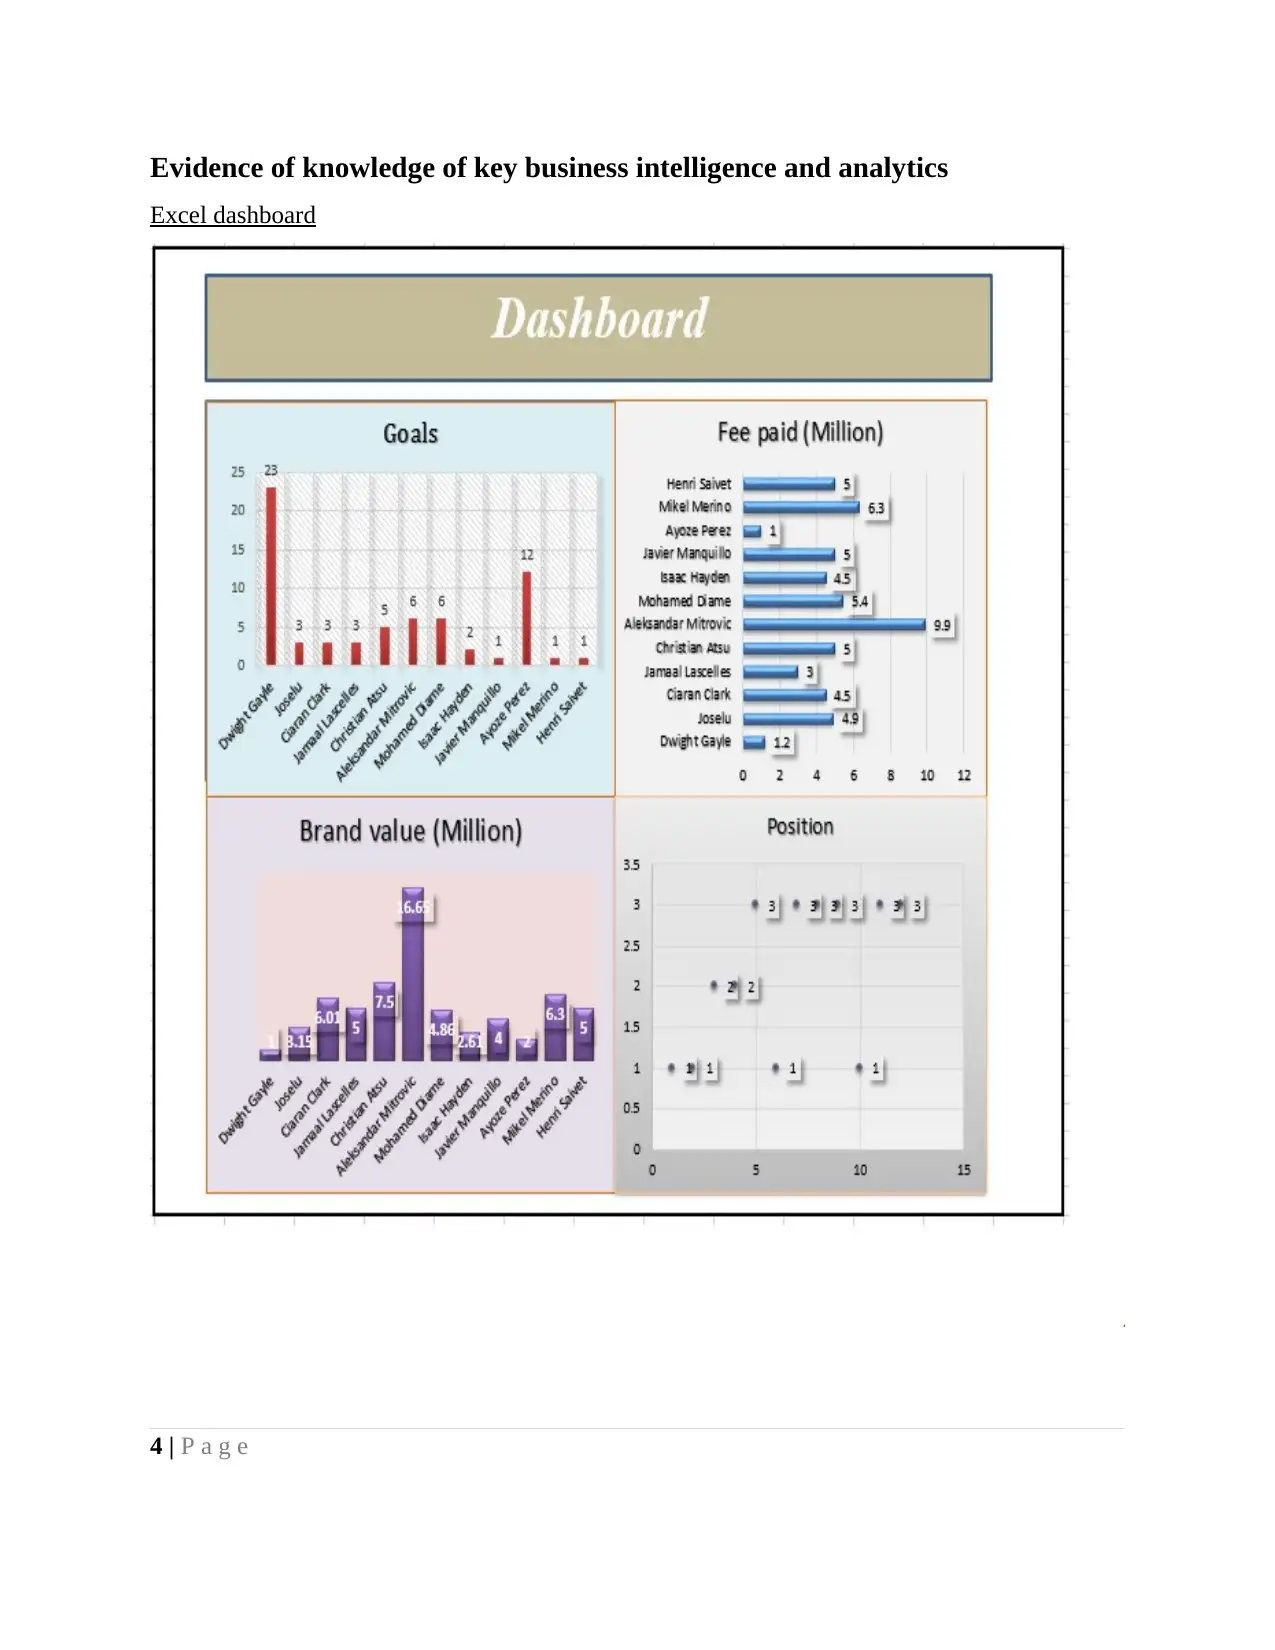
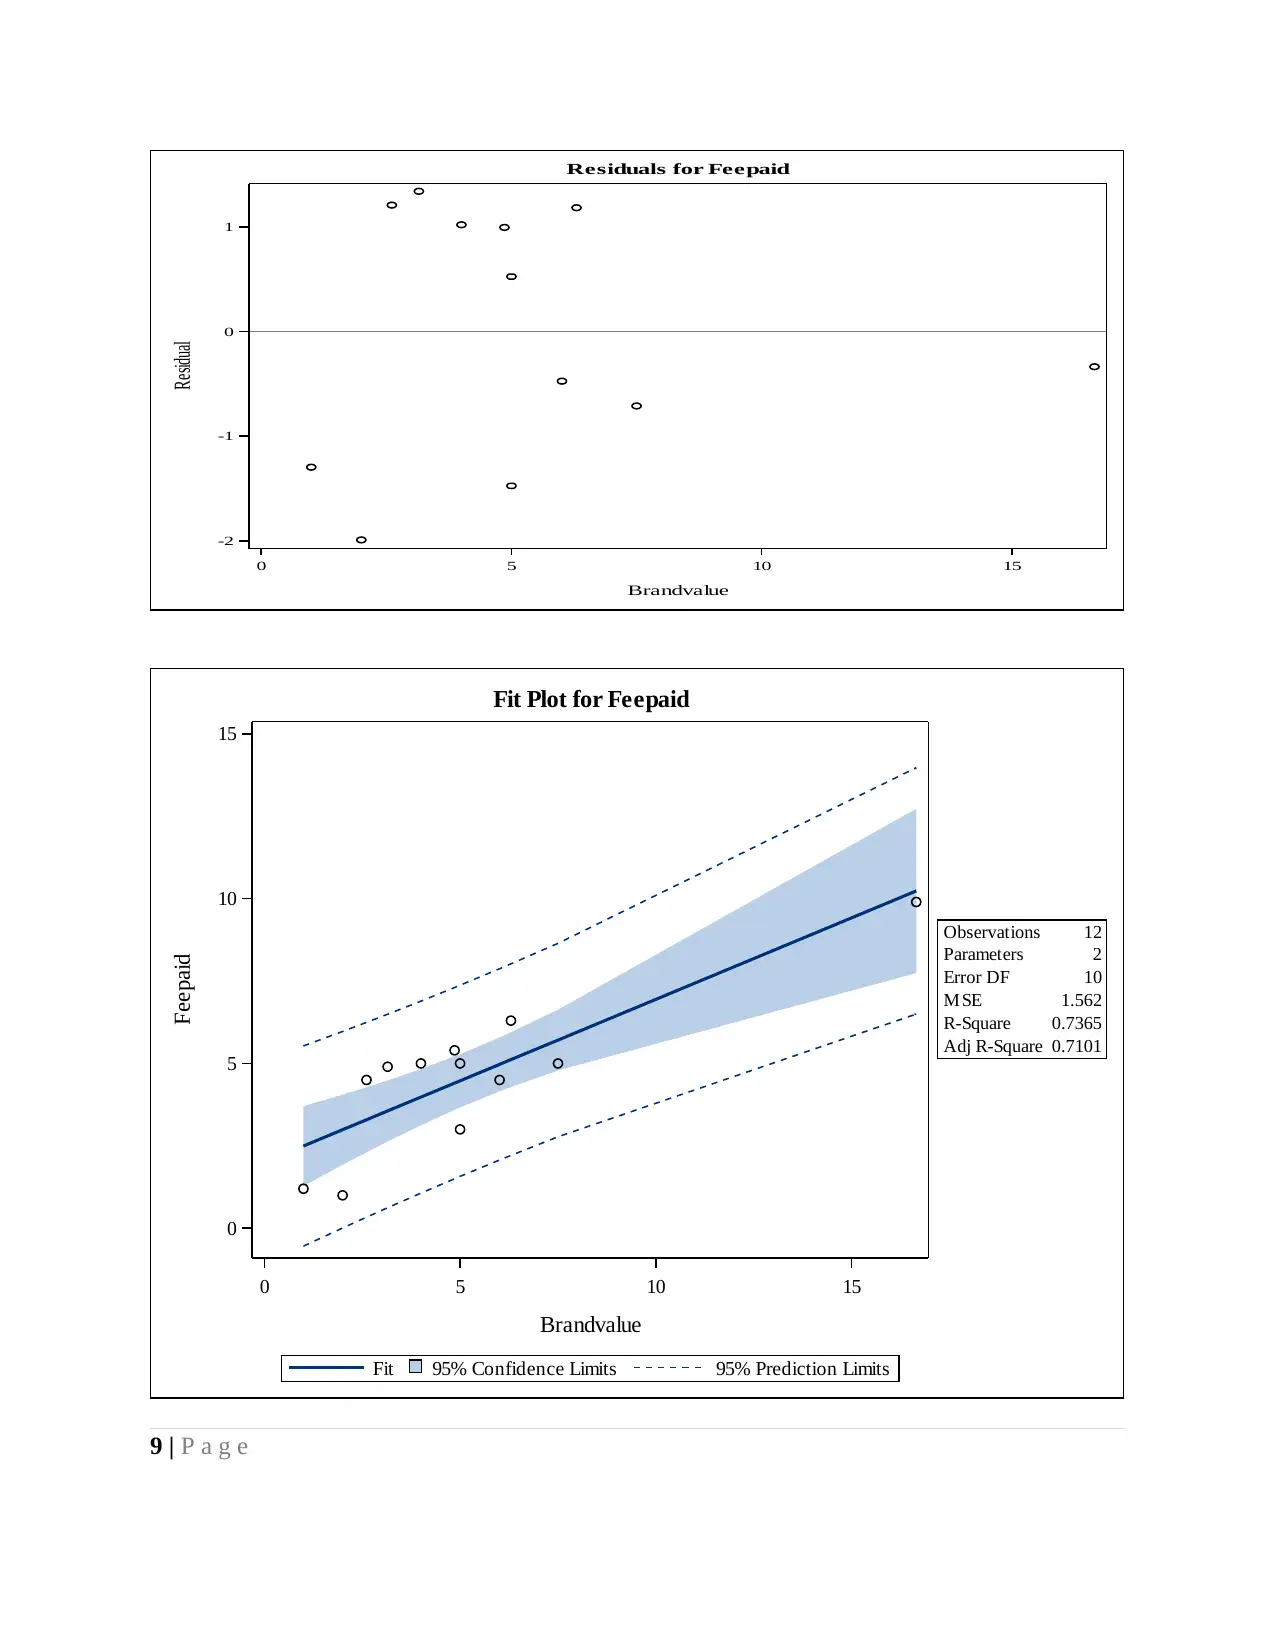
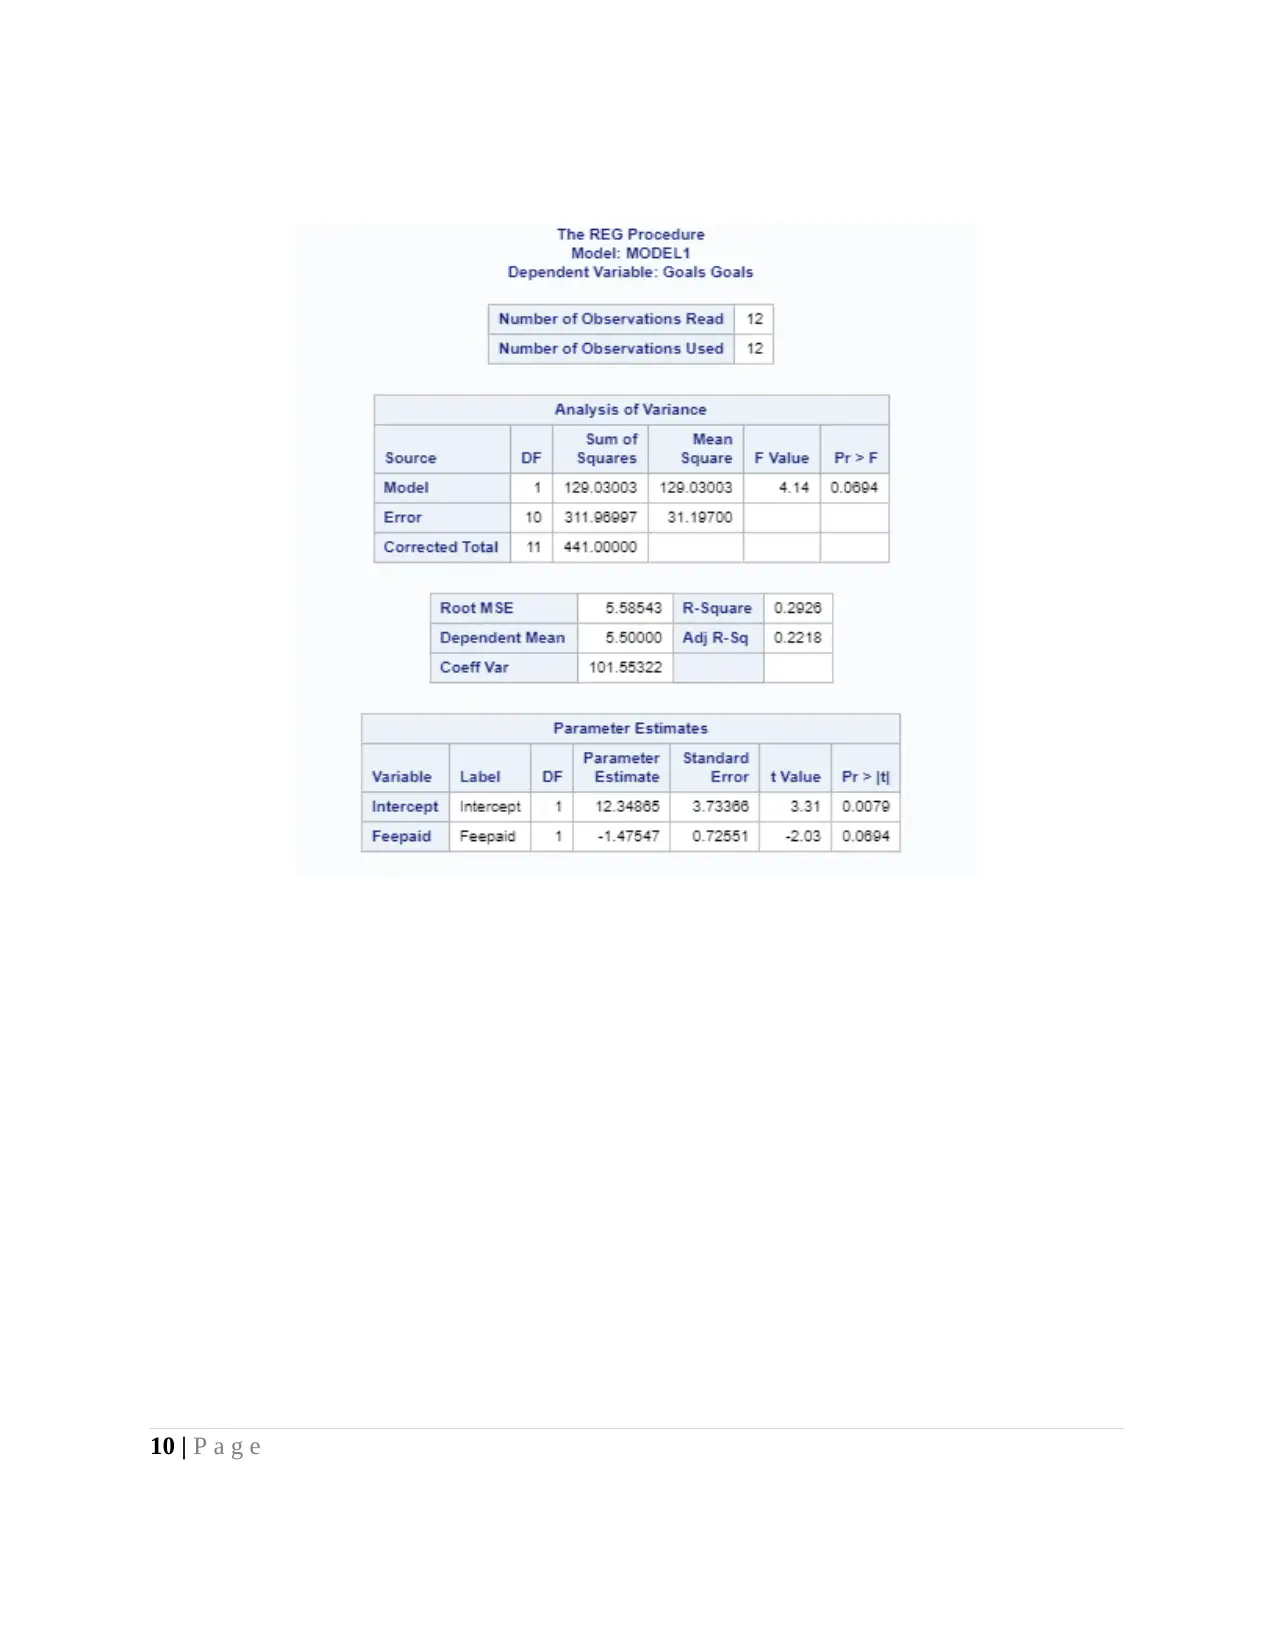
This report presents a comprehensive analysis of football club performance using business intelligence (BI) and data analytics (DA) techniques. It begins with a problem statement identifying the need to optimize player selection and performance within a football club, followed by a theoretical framework linking the problem to BI and analytics systems. The report showcases an Excel dashboard for visualizing player performance metrics, along with SAS code and output for regression and correlation analyses. The critical analysis evaluates the effective and efficient use of implemented BI and DA systems, offering insights into player performance, brand value, and financial implications. The conclusion recommends a flexible fee-paying system tied to player performance. The analysis reveals insights into the relationship between brand value, fees paid, and player performance, concluding that high brand value and fees do not guarantee optimal on-field results.

BUSINESS INTELLIGENCE
Paraphrase This Document
Need a fresh take? Get an instant paraphrase of this document with our AI Paraphraser

TABLE OF CONTENTS
INTRODUCTION...........................................................................................................................1
Problem or opportunity statement for football club........................................................................1
Theoritical framework to link problem statement with business intelligence and analytics
systems.............................................................................................................................................1
Evidence of knowledge of key business intelligence and analytics................................................3
Excel dashboard...........................................................................................................................3
Data import code..........................................................................................................................4
SAS output...................................................................................................................................4
Coorelation................................................................................................................................12
Critical analysis and justification of effective and efficient use of BI and DA Systems
implemented..................................................................................................................................13
Conclusion and recommendation for successful implementation and use of BI and analytics
solution..........................................................................................................................................14
REFERENCES..............................................................................................................................15

INTRODUCTION
Buisness analytics is one of the growing field and in current time period it is widely used
by sports academy and associations to make decisions. In the current report dashboard is
prepared and regression as well as coorelation analysis is done in SAS. On basis of analysis of
results useful decisions are taken in the current report. At end of research study, conclusion
section is prepared in the report.
Problem or opportunity statement for football club
Soccer is the one of the most popular game in the UK and every year number of
tournaments happened in the mentioned nation. It can be observed that football clubs
consistently add members in their group and due to this reason it become very important to
identify number of factors so as to ensure that suitable candidate is included in the football club
so that it become to compete with rival clubs (Alamar, 2013). Usually, it is observed that football
clubs pay million of amount to football players but sometimes they does not receive that support
or performance from the players which they expect from them. Thus, one of the major problem is
to replace those players time to time which do not perform well even million of amount was paid
to them. Major problem associated with football club is that many of its players failed to make a
goal in most of matches. Thus, in order to solve this problem analytics will be used and under
this dashboard is prepared in Excel which will reflect entire performance of the players on single
sheet (Newcastle limited, 2017). Apart from this, in respect to problem statement analytical tools
will be applied on analytics platform or software like SAS.
Theoritical framework to link problem statement with business intelligence
and analytics systems
Buisness intelligence is the one of the field that is gaining wide popularity now a days.
This is because in business intelligence huge chunk of dataset is analyzed by preparing charts on
variables and by aligning them in proffesional manner (Travassos and et.al., 2013). In advanced
softwares like Tableau attractive charts are prepared on dashboard and trend lines are prepared
on them to make prediciton. Apart from this, descriptive analysis results can also be depicted on
them. Business intelligence is nothing but a tool to analyze large data set thart encompass
multiple variables and is related to the previous years time period. On other hand, analytics
1 | P a g e
⊘ This is a preview!⊘
Do you want full access?
Subscribe today to unlock all pages.

Trusted by 1+ million students worldwide

systems are another option that are also available to the firms. This is because in analytics
software or systems data can be analyzed by using multiple tools like regression analysis, cluster
analysis, decision tree analysis and RFM analysis etc. All these methods have different
properties and can be used to find out answers of different questions. For example regression
analysis method is the one of the tool which reflect the relationship between two variables in
terms of significent difference that exist between them (Mondello and Kamke, 2014). On other
hand, cluster analysis tool reflect grouping of variables on basis of similarity that is identified by
using proximity and pattern matrix. Apart from this, decision tree is another tool which reflect
that if certain condition occur then what may be outcome.
In order to solve problem that is faced by football association dashboard is prepared.
Major problem faced by football association is that its few players are performing well and some
are struggling to make even a single goal in match. Higher amount of contract is signed with
such kind of players and when they does not perform it prove costly football association. In order
to solve this problem dashboard is prepared which reflect that how many goals are made by
single player in last two years. On viewing chart it can be clearly identified that which are the
players that perform worst in most of matches they played for football club. Apart from this, in
second chart that is on left side is indicating million of fee that is paid to each player. By
comparing both charts it can be identified that which are those players to whom higher amount is
paid but they failed to perform well for football club. By doing so answer of problem statement
can be easily identified by using dashboard. Further, brand value chart is also prepared which if
compared with goals that is made by players will reflect that which are those players that have
good brand value but failed to deliever performance in line to expectation (Miller, 2015). In the
chart position of the players of football club is also reflected. Hence, it can be said that through
charts deep analysis of players performance is done and in terms of fee, brand value as well as
goals they made it is identified that which players need to be retained and which one must be
excluded from squad.
Statistical tools like regression analysis will be applied on data set specifically on
variables like fee paid and brand value. By doing so it will be identified whether due to change in
brand value fee also changed or brand value factor play significent role in determination of fee
2 | P a g e
Paraphrase This Document
Need a fresh take? Get an instant paraphrase of this document with our AI Paraphraser

paid to the players of the team. Apart from this, coorelation tool will be applied to identify
relationship between multiple variables like position and goals. By doing so it will be identified
whether position play any role in increasing or decreasing number of goals from player side.
3 | P a g e
relationship between multiple variables like position and goals. By doing so it will be identified
whether position play any role in increasing or decreasing number of goals from player side.
3 | P a g e

Evidence of knowledge of key business intelligence and analytics
Excel dashboard
4 | P a g e
Excel dashboard
4 | P a g e
⊘ This is a preview!⊘
Do you want full access?
Subscribe today to unlock all pages.

Trusted by 1+ million students worldwide

Data import code
/** Import an XLSX file. **/
PROC IMPORT DATAFILE="/folders/myfolders/sasuser.v94/A53064 New.xlsx"
OUT=WORK.A53064_New
DBMS=XLSX
REPLACE;
RUN;
/** Print the results. **/
PROC PRINT DATA=WORK.A53064_New; RUN;
SAS output
Regression analysis
PROC REG;
MODEL Feepaid=Brandvalue;
RUN;
5 | P a g e
/** Import an XLSX file. **/
PROC IMPORT DATAFILE="/folders/myfolders/sasuser.v94/A53064 New.xlsx"
OUT=WORK.A53064_New
DBMS=XLSX
REPLACE;
RUN;
/** Print the results. **/
PROC PRINT DATA=WORK.A53064_New; RUN;
SAS output
Regression analysis
PROC REG;
MODEL Feepaid=Brandvalue;
RUN;
5 | P a g e
Paraphrase This Document
Need a fresh take? Get an instant paraphrase of this document with our AI Paraphraser

Number of Observations Read 1
2
Number of Observations Used 1
2
6 | P a g e
2
Number of Observations Used 1
2
6 | P a g e

Analysis of Variance
Source DF
Sum of
Squares
Mean
Square F Value Pr > F
Model 1 43.648
86
43.648
86
27.94 0.000
4
Error 10 15.620
31
1.5620
3
Corrected Total 11 59.269
17
Root MSE 1.2498
1
R-Square 0.736
5
Dependent Mean 4.6416
7
Adj R-Sq 0.710
1
Coeff Var 26.925
94
Parameter Estimates
Variable Label DF
Parameter
Estimate
Standard
Error t Value Pr > |t|
Intercept Intercept 1 2.00066 0.61626 3.25 0.008
8
Brandvalue Brandval
ue
1 0.49457 0.09356 5.29 0.000
4
7 | P a g e
⊘ This is a preview!⊘
Do you want full access?
Subscribe today to unlock all pages.

Trusted by 1+ million students worldwide

Fit Diagnostics for Feepaid
0.7101Adj R-Square
0.7365R-Square
1.562M SE
10Error DF
2Parameters
12Observations
Proportion Less
0.0 0.4 0.8
Residual
0.0 0.4 0.8
Fit–Mean
-2
0
2
4
6
-4 -3 -2 -1 0 1 2 3 4
Residual
0
10
20
30
40
50
Percent
2 4 6 8 10 12
Observation
0.0
0.2
0.4
0.6
Cook's D
2 4 6 8 10
Predicted Value
2
4
6
8
10
Feepaid
-1 0 1
Quantile
-2
-1
0
1
2
Residual
0.2 0.4 0.6 0.8
Leverage
-2
-1
0
1
2
RStudent
2 4 6 8 10
Predicted Value
-2
-1
0
1
2
RStudent
2 4 6 8 10
Predicted Value
-2
-1
0
1
Residual
8 | P a g e
Paraphrase This Document
Need a fresh take? Get an instant paraphrase of this document with our AI Paraphraser

0 5 10 15
Brandvalue
-2
-1
0
1
Residual
Residuals for Feepaid
0 5 10 15
Brandvalue
0
5
10
15
Feepaid
95% Prediction Limits95% Confidence LimitsFit
0.7101Adj R-Square
0.7365R-Square
1.562M SE
10Error DF
2Parameters
12Observations
Fit Plot for Feepaid
9 | P a g e
Brandvalue
-2
-1
0
1
Residual
Residuals for Feepaid
0 5 10 15
Brandvalue
0
5
10
15
Feepaid
95% Prediction Limits95% Confidence LimitsFit
0.7101Adj R-Square
0.7365R-Square
1.562M SE
10Error DF
2Parameters
12Observations
Fit Plot for Feepaid
9 | P a g e

10 | P a g e
⊘ This is a preview!⊘
Do you want full access?
Subscribe today to unlock all pages.

Trusted by 1+ million students worldwide
1 out of 20
Related Documents

Your All-in-One AI-Powered Toolkit for Academic Success.
 +13062052269
info@desklib.com
Available 24*7 on WhatsApp / Email
Unlock your academic potential
Copyright © 2020–2025 A2Z Services. All Rights Reserved. Developed and managed by ZUCOL.