Analysis of Business Intelligence and Knowledge Management Systems
VerifiedAdded on 2023/01/11
|19
|5101
|70
Report
AI Summary
This report delves into the application of Business Intelligence (BI) and Knowledge Management (KM) within modern enterprises, emphasizing the extraction of value from extensive datasets. It explores the utilization of visual analytics to empower organizations in accessing, analyzing, and sharing information. The report highlights the significance of BI in promoting data-driven decision-making and the role of visual analytics in developing both qualitative and quantitative insights. Data collection from various sources is discussed, emphasizing an approach that provides accurate information and experience. The report covers the background of BI, its evolution, and the importance of KM in organizational success. It examines BI solutions like visual analytics, particularly tools like Tableau, and their impact on market trends, patterns, and competitor analysis. The literature review provides insights into BI, visual analytics, customer data platforms, and the emergence of data visualization and analytical tools. It emphasizes how these elements contribute to effective decision-making, customer data management, and overall business performance.

Business Intelligence and Knowledge
Management
1
Management
1
Paraphrase This Document
Need a fresh take? Get an instant paraphrase of this document with our AI Paraphraser
ABSTRACT
In modern Era, many enterprise have an extensive collection of data or information. In order to
extract the value from data source. In this report, it will try to utilise the business intelligence and
knowledge management applications. Visual analytics can empower the organizations to analyse,
access and share information, knowledge. Moreover, business intelligence always promotes the
use of information which are available to the organization. Hence, it has assumed that Visual
analytics which plays significant role in developing both qualitative as well as quantitative
information value in decision-making. In this study, it can be captured or collected the data from
different sources. The process could help in tern of approach which will give accurate
information and experience that were mentioned in the study.
2
Contents
ABSTRACT....................................................................................................................................2
INTRODUCTION...........................................................................................................................4
LITERATURE REVIEW................................................................................................................6
ELEMENTS OF METHODOLOGY..............................................................................................9
RESULT, FINDING, CONCLUSION..........................................................................................15
REFERENCES..............................................................................................................................18
3
⊘ This is a preview!⊘
Do you want full access?
Subscribe today to unlock all pages.
Trusted by 1+ million students worldwide
INTRODUCTION
A report is communication artefact that prepared with other intention of relaying the
information within presentable into visualise manner. Liberate IT by providing the user new way
to access the information if required. In order to increase the demand of visual analytic in global
marketplace. SAS Visual analytics that enable IT to easily prepare or load large amount of
information. Visual analytic platform reveal trends in the information that could otherwise be
misinterpreted or missed altogether.
Many organizations are basically used the both visual analytical and customer data platform
which are collecting the large amount of information or data. Therefore, Analytical tools will be
usually performed the task to manage the large amount of unstructured data within data
warehousing and other online analytical processing. This will help for organised and validated
the data through business analytics. On the other hand, it can be understanding the customer data
platform that mainly used by customers to access the information or data.
The report will examine the need and requirement of business intelligence that help for
comparison between the visual analytics and customer data platform (Massaro and et.al., 2019).
In order to increase the capabilities and abilities of organization. Nowadays, many companies are
depending on the business intelligence tool for maintaining the business competitive advantage
in marketplace. Visual analytics that are performed the different operation during visualization
process such as extraction load, data mining and other on-line analytical processing. Many
enterprises have been concerned about the extensive collection of data or information and
afterwards, it will be maintaining the proper documentation so that it can easily access, retrieve
in proper manner.
Due to the increasing the demand of visual analytics that are coupled with fastest growing
data volume. In order to extract the value from multiple data sources and also utilising data
analytics. Furthermore, there are exponentially movement towards the investigation which highly
finding the efficient visualization system. The important product such as SAS visual analytics
that help for maintaining the business performance and efficiency. However, it empower the
current user’s pattern through analytical ways and also increasing the opportunities.
4
Paraphrase This Document
Need a fresh take? Get an instant paraphrase of this document with our AI Paraphraser
Back ground
Since 1955, business take advantage of information system to computerise their
operational as well as functional assets in multiple task. As the information sharing which has
grown into organizations (Massaro and et.al., 2019). Visual analytic is sub-division of business
intelligence which mainly providing the better brief idea about the information into visualise
manner. In another way, it useful for analysing the real based data in the form of charts, graphs.
Nowadays, Visual analytics is consider as modern technology that help for decision-
making which always supports for establishing coordination between two or more companies.
Analytics help for companies run smoothly and keep going into one step ahead of
competition. In another way, it also organise the different trends, competitors, technologies and
other regulatory context through actions.
There is no controversy that knowledge has become important term within organization.
Without this, it cannot imaged that business developed and even survive through proper
knowledge. So as require to consider knowledge management and should manage it well-
manner. In order to improve the overall business result or outcome. In past decade, it has
considered the major source for managing production as well as distribution of information.
it has been calculated that 55% -60% percent in UK which consists of knowledge,
information of employees or business operations (Trad, 2019). In this way, business have
identified the significance of knowledge management concept which always supports for
improving the entire business capabilities in marketplace. When it come Visual analytics, this
type of visualization plays important role which become useful for recognise capabilities of
organization through analytical tool or platform. At certain level, enterprise can use to determine
the actions of alternative competitors. Generally, it supports to knowledge management function
and handle different operation and function in proper manner.
Purpose of report
The primary purpose of report is to investigate about the BI solution such as visual
analytics which always supporting for decision-making process in the large organization. It has
been chosen the best BI solution through visual analytical tool like “tableau” which providing the
better solution for organization. In order to achieve the specific goal and objective.
This type of visual analytical tool will be considered the best choice in term of visual
analytics whereas representing the market trends, future directions, pattern and technologies by
5
using charts, graphs (Massaro and et.al., 2019). In another way, it can be representing into
visualise way to add more interactive design patterns in proper manner. Furthermore, it will be
determined the certain action of competitors where use visual analytic for organising the
unstructured data and generating accurate reports.
On the other hand, it has been elaborated that how Visual analytics for generating the
significant reports, graphs and other charts. The report will be considerations of knowledge about
the analytical tool which always supports for providing the professional service in the
organization. In order to provide the better solution where it could be competitive advantage and
able to exploit the business intelligence tool, modern techniques.
By analysing the organizational data or information so that it is important for adapting the
new idea in business. In this way, it can easily achieve desirable goal and objective of
organization in proper manner. in this project, As consulting with different IT vendors that
always support for providing the best idea about the visual analytics which help for increasing
overall business capabilities.
LITERATURE REVIEW
Business intelligence (BI) and visual analytics
According to Ain, Vaia and Waheed (2019) There are lot of thing that get thrown around
the global world and it became easier to interpret data by using BI tool or platform. Therefore, it
can be explained the business intelligence which mainly indicating many thing to multiple users.
Sometimes, it is depending on their perspective and also focused on the business. BI is consider
the set of different system that mainly designed to support for decision-making. In context of
organization, business intelligence has required to operate business in long-term growth. It is
also implementing the analytical way to change their entire business capabilities and abilities.
Usually, Business intelligence is formulating the multiple operational efficiency by accessing
real –time information. In order to help the users for executing the different function in step by
step manner.
Furthermore, The purpose of BI is to analyse in term of data sources and then support
rational decision-making. In this way, it can easily resolve the problem or issues in proper
manner. Furthermore, Business intelligence systems are considered the combination of data
warehouse, data section and knowledge management which handled by analytical tool or
platform. In order to demonstrate internal competitive data.
6
⊘ This is a preview!⊘
Do you want full access?
Subscribe today to unlock all pages.
Trusted by 1+ million students worldwide
According to Božič and Dimovski (2019) Visual analytics will be used in different way
in which depending on how organization perform multiple activities. Generally, the primary
purpose of Visualization is that when get significant leverage in both internal as well as external
within organization. VM also indicated the regular business framework to capture, store, collect
and organise the data into different charts, graphs. Afterwards, it helps for representing the
formation of data into visualize manner. So as it positively impact on the organization whereas
companies are considered both tactical as well as operational knowledge. Also it can be
understanding that user may deploy them to be more productive and efficient for increasing the
business knowledge.
Many users are interpreting the data through visual analytics by using SAS, tableau tools.
Business may consider as modern technology in which supports for recognising and categorising
the data into visualize manner. IT vendor also focused on the implementing the concept of
visual analytic in the business to maintain or organise data into proper manner. in another way, it
also giving the better view to share share, contribute and learn new things from current trends.
Visual analytics and customer data platform
As per Bouaoula, Belgoum and Bazan (2019) Visual analytical is sub-division of
business intelligence such as SAS. It is mainly include relationship intelligence, competence
relationship and structure intelligence. The information can be represented in the form of Visual
dashboard level, self-service. The interactive analytical tool help for recognising that how
interaction between knowledge staff where they can change the business performance.
Failing under the category of visual business intelligence and analytics which generally
just visualization. It involved the data or information that displayed in visual chart, dashboard
that make an easier to understand. The competence intelligence provide the facility to recognise
the ability and proficiency of knowledge for maintaining business performance and efficiency in
proper manner. At certain level, Business intelligence tool will be captured or shared the
information, frequently involved IT system as well as processes. BI tool facilitate to operate the
enterprise process while creating and transferring knowledge throughout the organization.
Caseiro and Coelho (2019) Customer data Platform is based on the software that
organize and aggregates the customer data across the widely used by touch points. It also used
the software, system and other marketing efforts. CDP that has collected or gathered, structure
real-time data into centralize customer profile and individuals.
7
Paraphrase This Document
Need a fresh take? Get an instant paraphrase of this document with our AI Paraphraser
Emergence of data visualization and data analytical
According to Ferraris, Mazzoleni and Couturier (2019) there will be growing palette of
data visualization tool or technique that enable the user of business analytical as well as business
Intelligence. It has been emerging into different application for establishing relationship
between data or information. It became useful for presenting valuable insight, decision-making
and also accelerating the entire business performance. These analytical tool or business
intelligence emphases the different charts which mainly representing as solution. In recently, it
has founded the information or data visualization organization which always increasing the
efforts towards visual analytics
Business intelligence and analytical platform that will generate accurate result or
outcome so that companies used for decision-making. It provide the real time customer handling
where they can store or collect large amount of information that will be organised into structured
format. In this way, it become easier for identifying certain requirement of business.
Furthermore, it also comprises wide range of application for gathering, storing, analysing and
making data easily accessible. In this way, it help for user to make better enterprise processes. BI
provide benefits, advantage to encompass both purpose as well as technical functionality.
Sometimes, Business intelligence tools that are supported for extracting the data and transform
into analytical processing.
In business intelligence and analytics, it has been identified the key challenges for
visualization that have been resolved around the representation of complex, large data set. In
order to measure the different dimensions. In context of organization, analytical platform or tool
provide the better reliable service which will help for improving quality and also decrease the
prices. In this way, there are different type of platform which supports for representing the
customer data, shows their positive respond towards the organization. Business intelligence and
analytical platform are increasing the capabilities while proposed to boost the innovation in term
of decision-making.
Visual analytics
Ferraris, Mazzoleni and Couturier (2019) shows the recently coined term which often
applicable to visualise information or data in proper manner. It is based on the combination of
predictive as well as visualization analytics. In most of time, vendors are adding the more
capabilities to provide the analytical solution. Sometimes, it is to be considered the long-term
8
analytics which handling different activities. In another way, it embedded with the analytical
capabilities in term of high performance which automatically created the visualization
environment. On the other hand, Stories bring life to fact and data so that it help for make sense
order large collection of disparate facts. In this way, it make easier to remember to important
point to visualise in the form of picture.
Business performance management
In context of business performance which mainly include the ERP, CPM and SAP that
providing the better facilities to manage different task. It is mainly referred as the business
processes, technologies and other metrics that supports for measuring, tracking and monitoring
entire performance. According to Gunjal (2019) Business performance will be identified on the
basis of analytic tool in order to find out the integration among overall business performance
management. In this way, it help for enhancing and developing the knowledge in decision
making. In another way, it also improve the entire business performance because companies use
BI tool for analysing the information and organise effectively and efficiently. Moreover,
companies are gaining the competitive advantage and also relates to the arrangement of quality
data or information. it became reliable and store data that will help to achieve the desirable goal
or objective.
As per Hoffman and Freyn (2019) it has been created the model of business intelligence
through knowledge management. It also demonstrated the significant role of business knowledge
strategies in the organization which help for organise the employee details such as income,
payment, personal information. Generally, it will be stored in structured way to access
information in proper manner. Furthermore, there are different integration model of BI as well as
enterprise performance management.
ELEMENTS OF METHODOLOGY
On the basis of project objective which was looking for different elements and
components. The study was employed qualitative research and concern in theoretical manner. It
provide the brief idea about the concept of business intelligence and knowledge management
where hoe both are interrelated to each other. The approach could provide the detailed
description from multiple journals, article, literature and books (Bouaoula, Belgoum and Bazan,
2019). Afterwards, it could implement the accurate approach to gain more information and also
mention in this report.
9
⊘ This is a preview!⊘
Do you want full access?
Subscribe today to unlock all pages.
Trusted by 1+ million students worldwide
The investigator has chosen qualitative method which involving an interpretative,
naturalistic approach for identifying accurate information or data. It means that qualitative
method consider the suitable for collecting or gathering lot of information relevant to business
intelligence and knowledge management (Massaro and et.al., 2019). Qualitative method provide
brief idea through pre-existing theories so that easily understand where requirement to
implement new thing and expand the concept.
As conducting the preliminary research that mainly useful for investigator to to interpret
data, phenomena in context of meanings conceptual framework which bring to them. By using
this method, it can easily identified the interest, human behaviour towards business intelligence
and how they will use in the business operational management.
Explicit search strategy
The search strategy is mainly used to gather or collect the data systematic manner. It must
be fully reported when review is published. This type of search strategy allows replication and
consistency in the approach (Massaro and et.al., 2019). Few systematic way to discover the data
on the basis of research evidence. Afterwards, it has been recommendation to further expand
study in proper manner.
As per analysis of journals and article, it has been proposed the Business intelligence that
will be used in Knowledge management. Sometimes, it also emphasize the wide range of tool
which providing the solution for gathering analyzing and providing access to information
(Bouaoula, Belgoum and Bazan, 2019). It also supposed to improve the enterprise performance
in term of better decision-making. This can be possible while using qualitative method for
identifying the accurate information or data.
In additional, it can be classified into two different method for collecting or gathering
accurate information about the project. Primary data collection and Secondary data collection are
considered as important techniques for collecting information. When primary data may be
referred on the basis of non-numerical which help for providing interacting with other
respondent. In order to find out the positive as well as negative review towards Business
intelligence use in knowledge management. On the other hand, secondary method that is mainly
focused on the journals, article which always pre-defined in the previous study. So as it help for
investigator to determine strength, weakness. In this way, it can find out the research gap where
10
Paraphrase This Document
Need a fresh take? Get an instant paraphrase of this document with our AI Paraphraser
implementing innovative idea in future expansion. Sometimes, it also used some key words
which mainly representing the technical aspects in business development.
Use of BI tools/data analytics tools or analysis
SAS Business intelligence tool
It is based on the analytical tool or platform that consider as popular which offering the
advanced predictive the data or information. It provide the better great business intelligence
platform for gathering or collecting data for purpose of analysis. Sometimes, it is to be consider
as self-service platform which mainly allowed the leverage data, metric to make informed
decision about their enterprise. By using API, generally it provided with lot of multiple
customization option and ensure the high-level of data integration.
Tableau Business intelligence tool
Tableau is another tool or platform which always supports for arranging a large volume
of information in proper manner. While implementing the “Tableau” which become powerful
and fastest growing data visualization tool that mainly used in the business intelligence. It is
simplifying the raw data into understandable format. It is the efficient tool or platform which
always supports for organization to generate reports. Sometimes, it is useful for visualizing form
of worksheets, dashboards. “Tableau” generally combined with business analytics, data mining,
visualization and tool or infrastructure (Bouaoula, Belgoum and Bazan, 2019). It is best practice
which help to make more data driven decision. It can be possible through business intelligence
because it always supports for organize data into proper format.
Afterwards, tableau is considered the best choice in term of business intelligence which
providing the better facilities and services to organization. The strength is that when supporting
the decision-making process of business units. In recently, it has become high competition so
that tableau tool use as customer data platform.
As implementing the business intelligence tool or platform that can provide the solution
within poor analytical environment of organization. Generally, it provide the feasibility to
implement the data warehouse and update or maintained. In order to utilize the extraction as well
as transformation load. “Tableau” consists of different features that offered many facilities and
service to organization it involves queries, comments, graphs, tree and charting, dashboard and
other custom calculations.
11
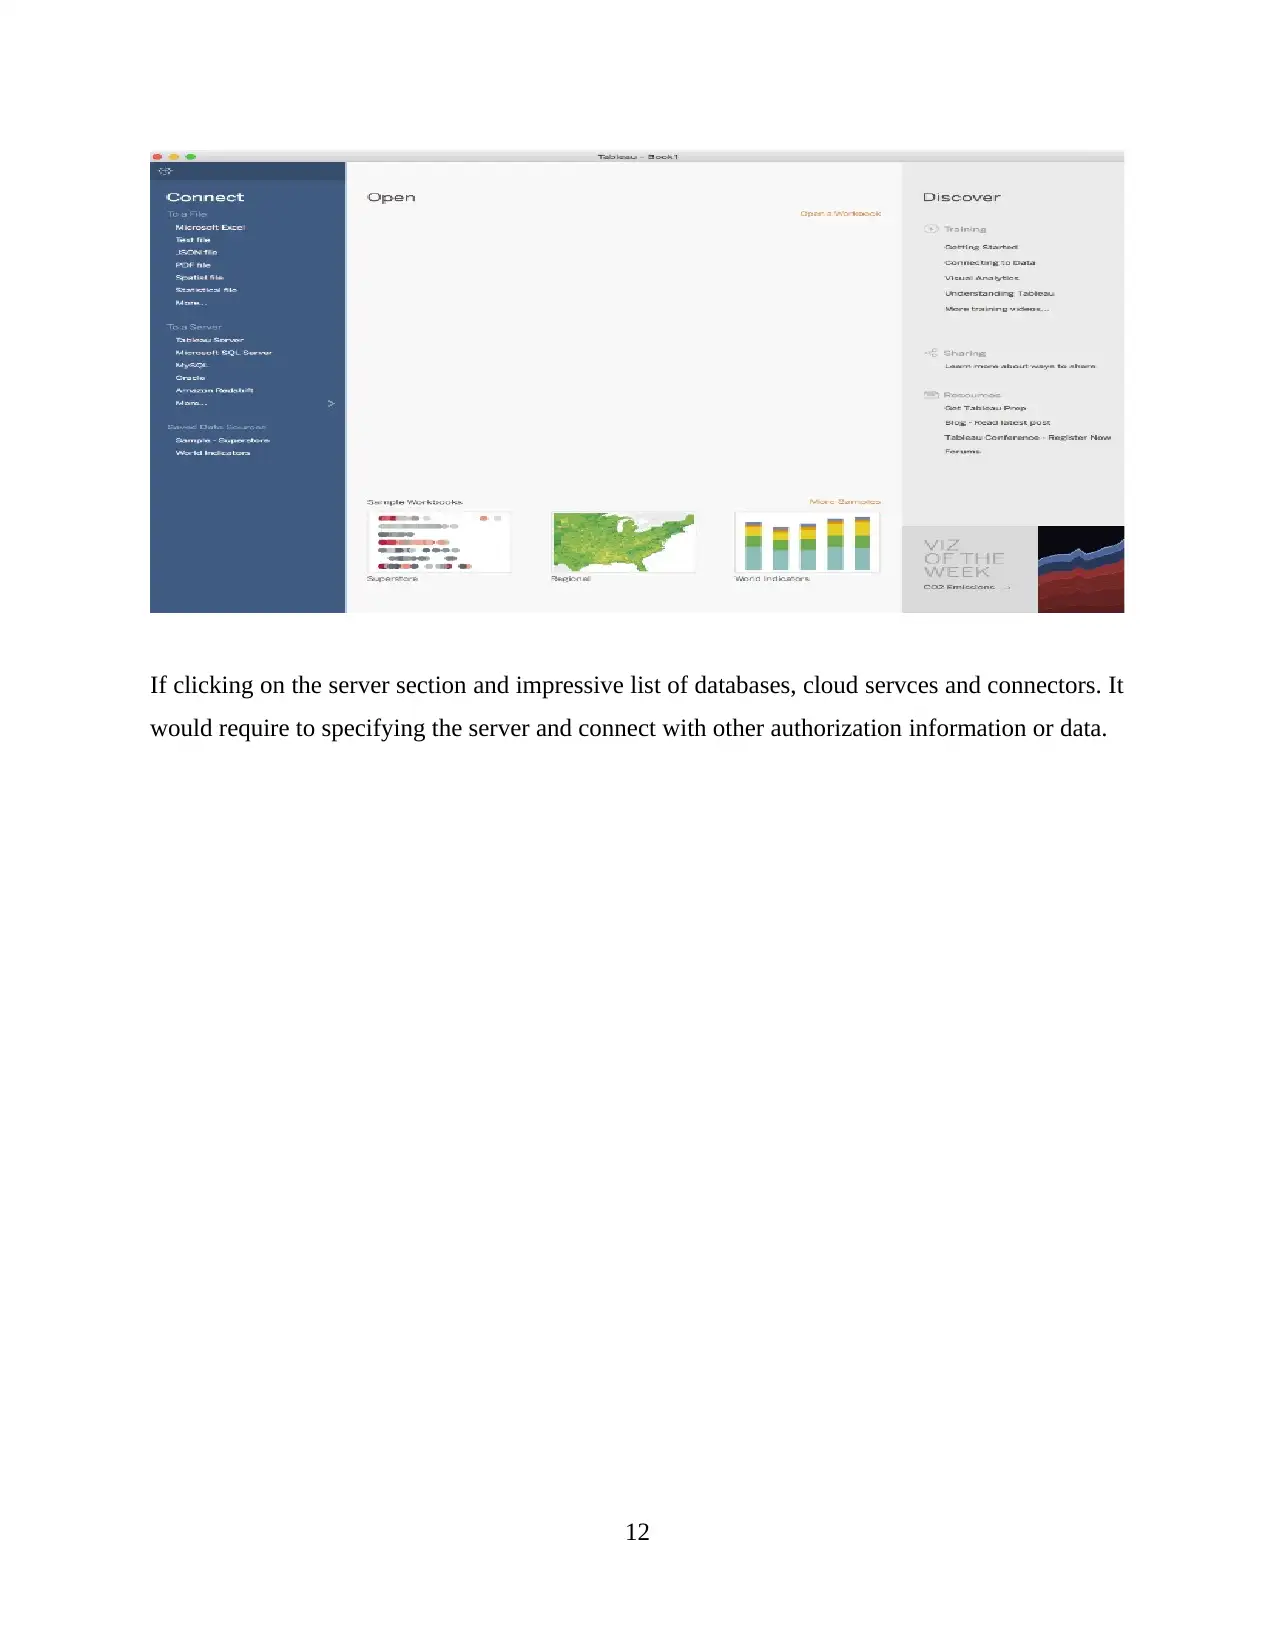
If clicking on the server section and impressive list of databases, cloud servces and connectors. It
would require to specifying the server and connect with other authorization information or data.
12
would require to specifying the server and connect with other authorization information or data.
12
⊘ This is a preview!⊘
Do you want full access?
Subscribe today to unlock all pages.
Trusted by 1+ million students worldwide
1 out of 19
Related Documents


Your All-in-One AI-Powered Toolkit for Academic Success.
+13062052269
info@desklib.com
Available 24*7 on WhatsApp / Email
![[object Object]](/_next/static/media/star-bottom.7253800d.svg)
Unlock your academic potential
Copyright © 2020–2026 A2Z Services. All Rights Reserved. Developed and managed by ZUCOL.