YourCloud Pty Ltd: Business Intelligence and Software Launch Project

Verified

Added on  2021/06/16

|17
|3202
|104
Project
AI Summary
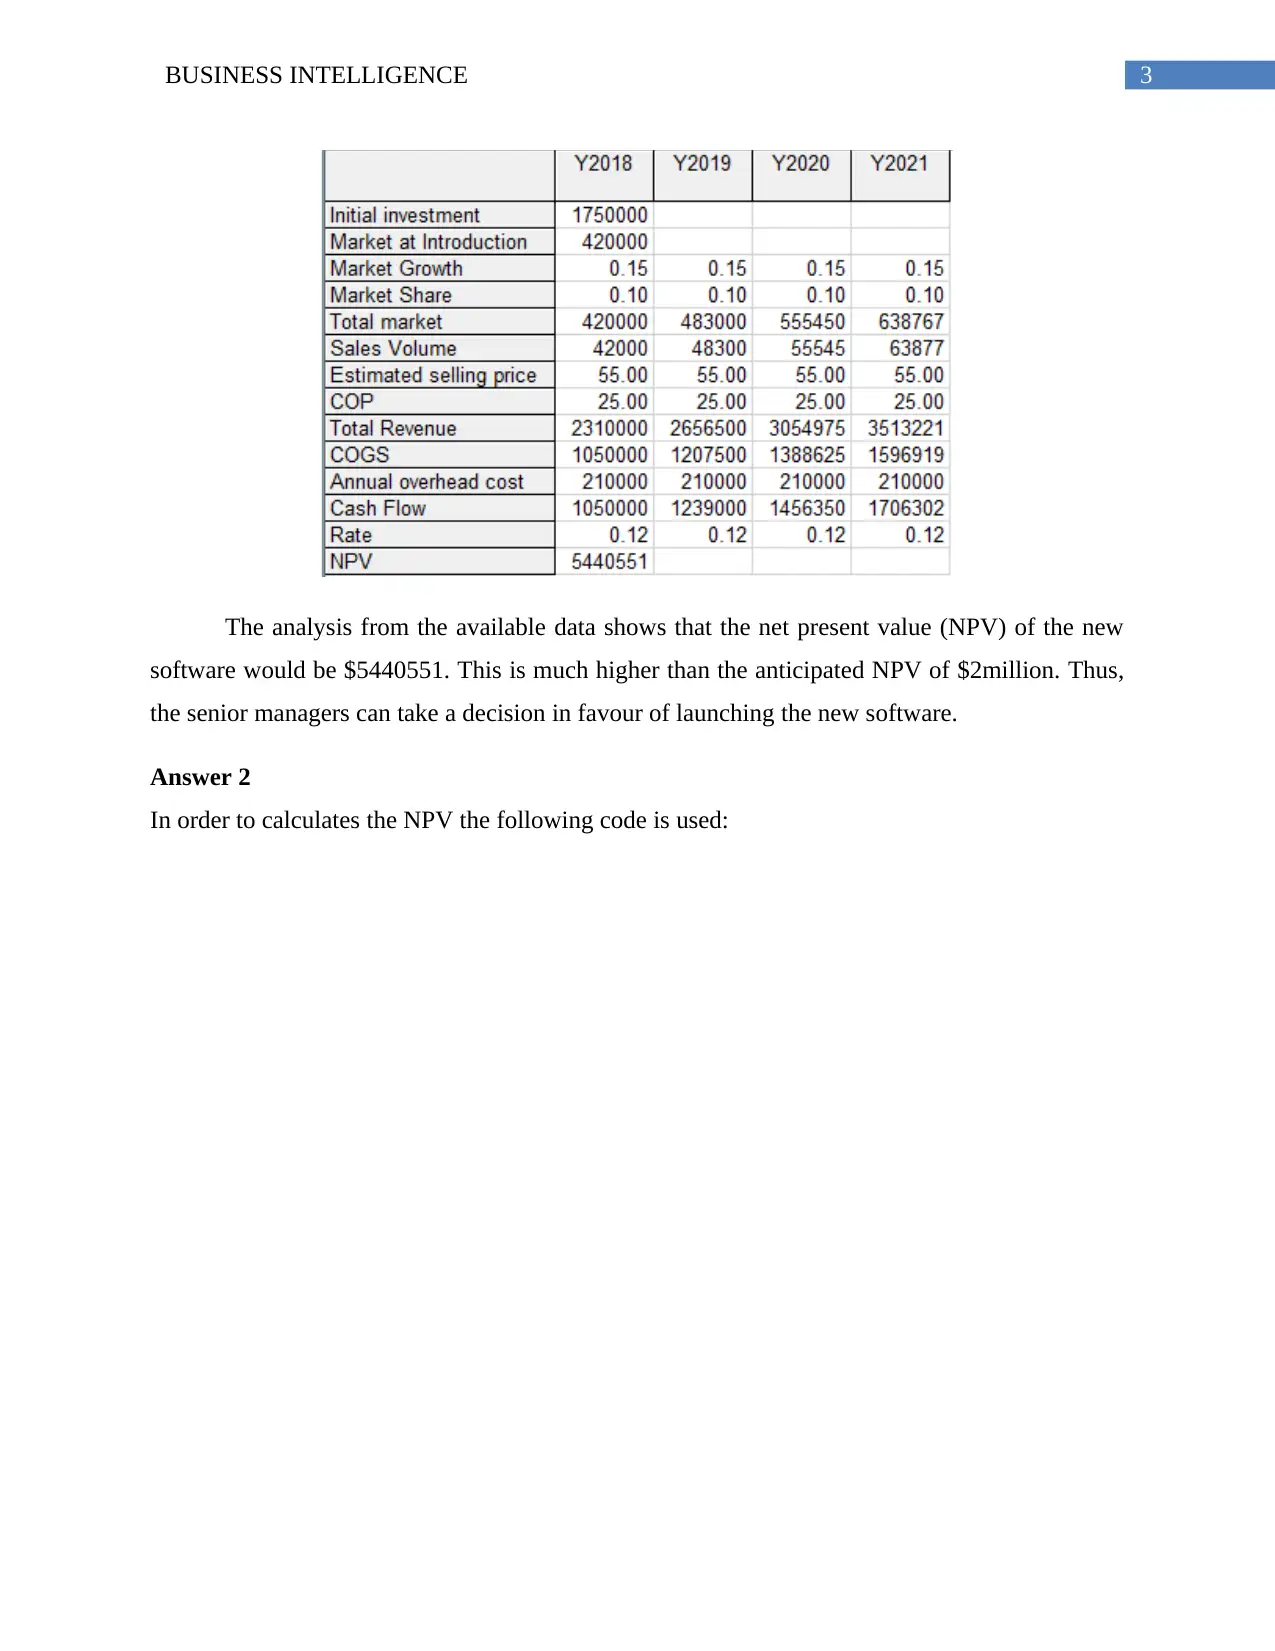
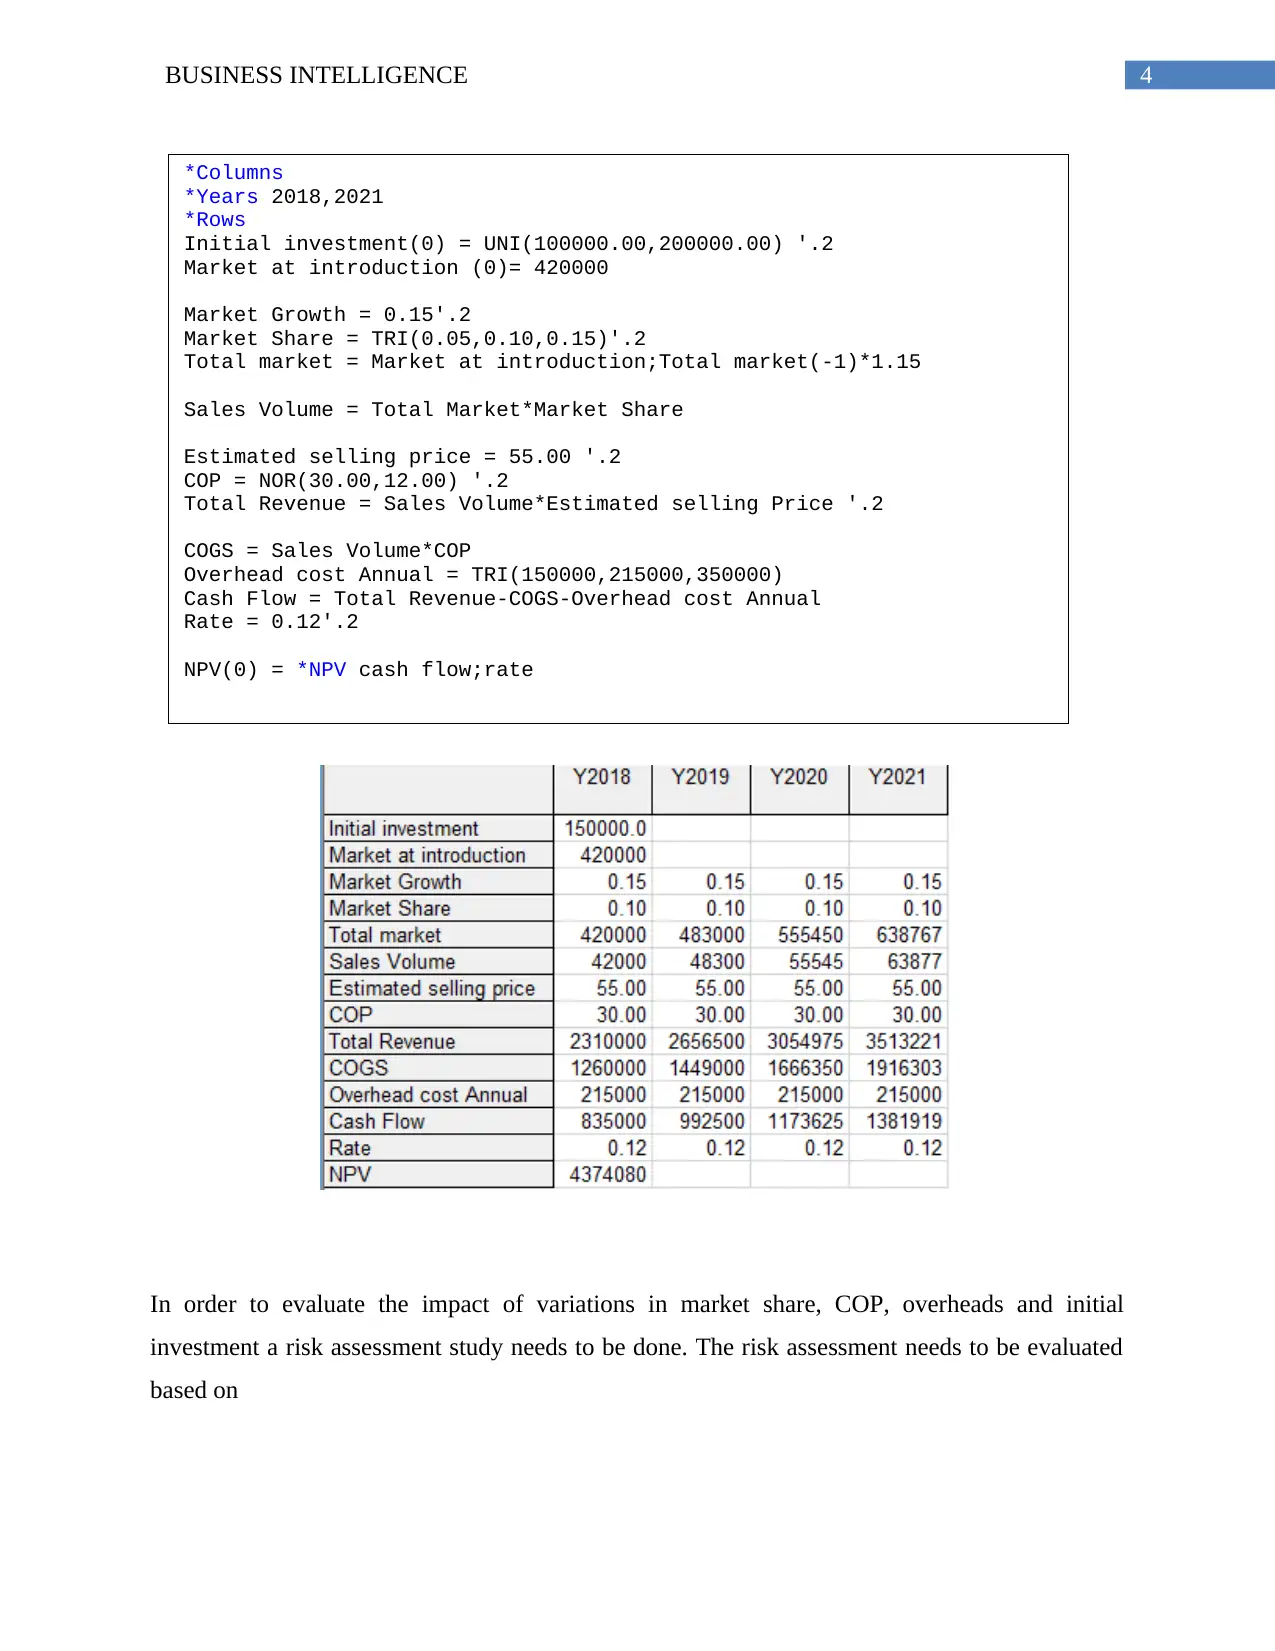
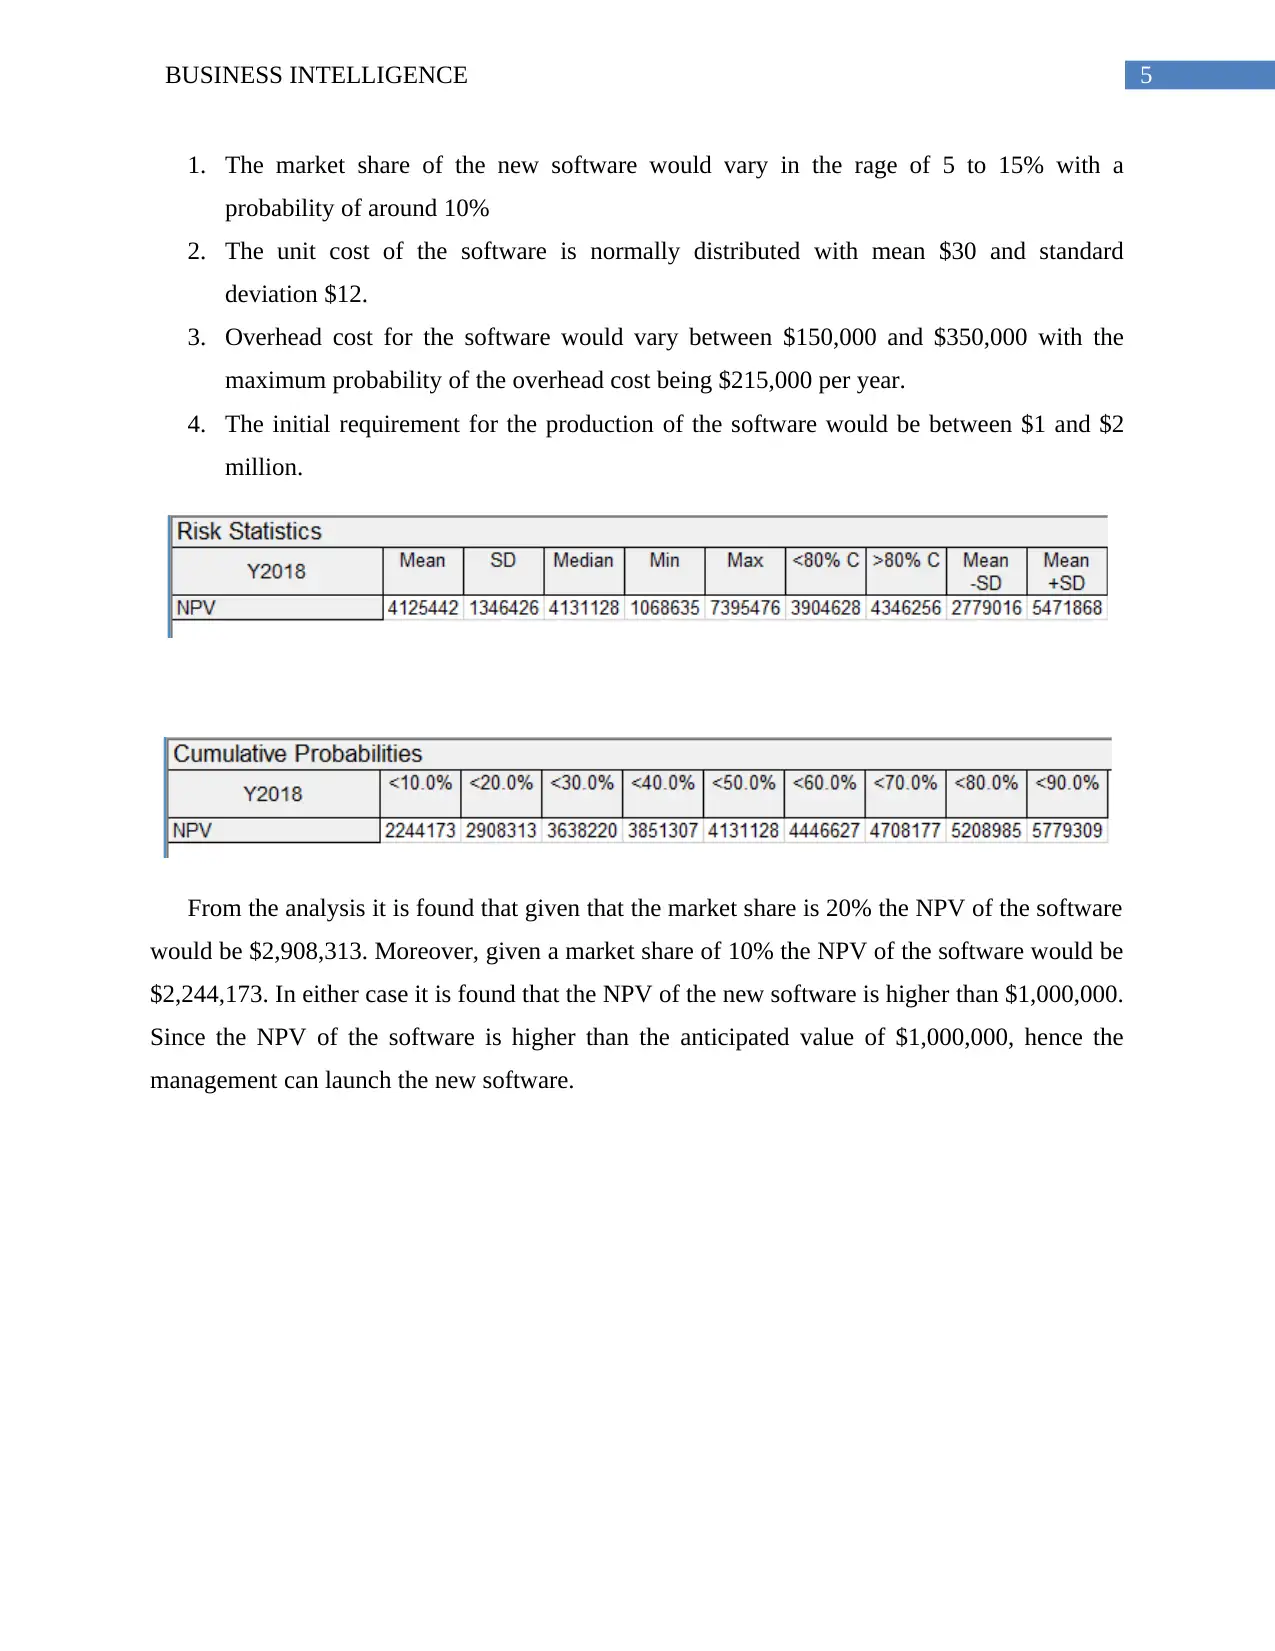
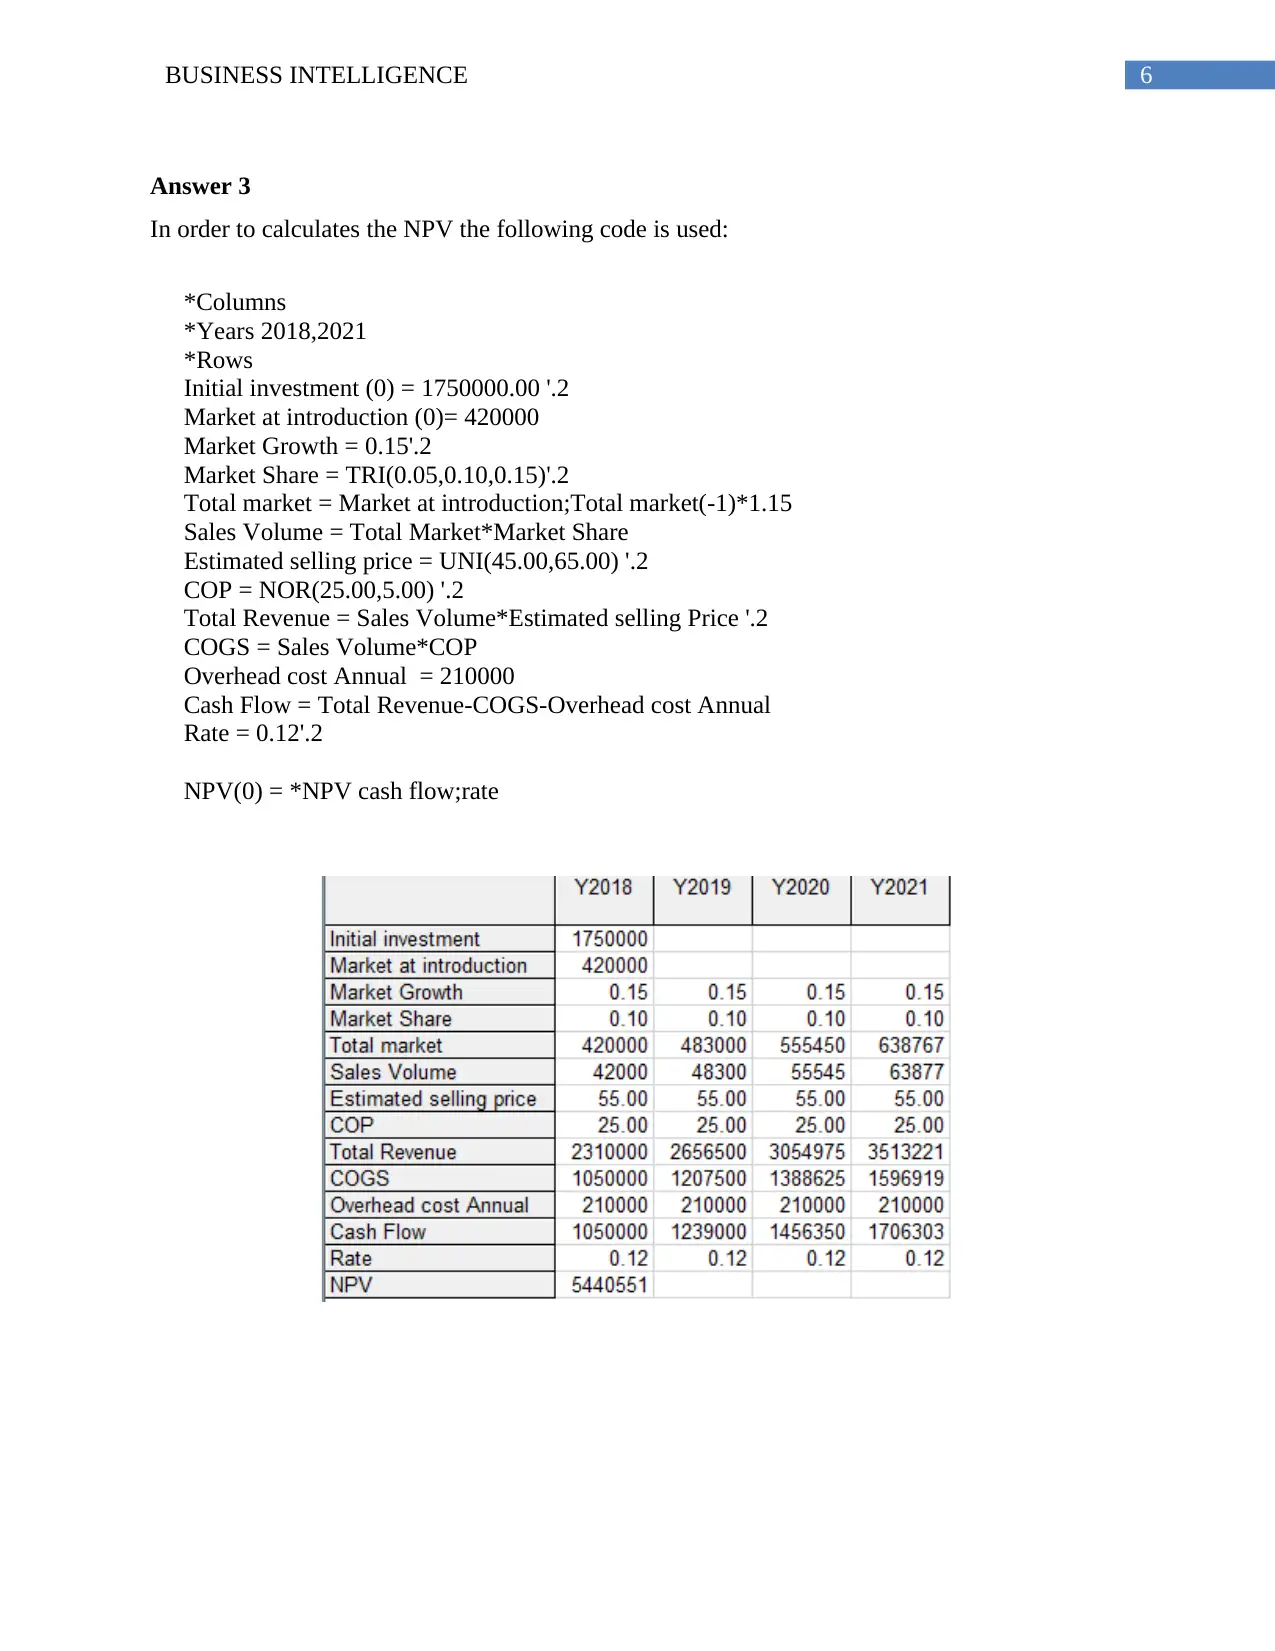
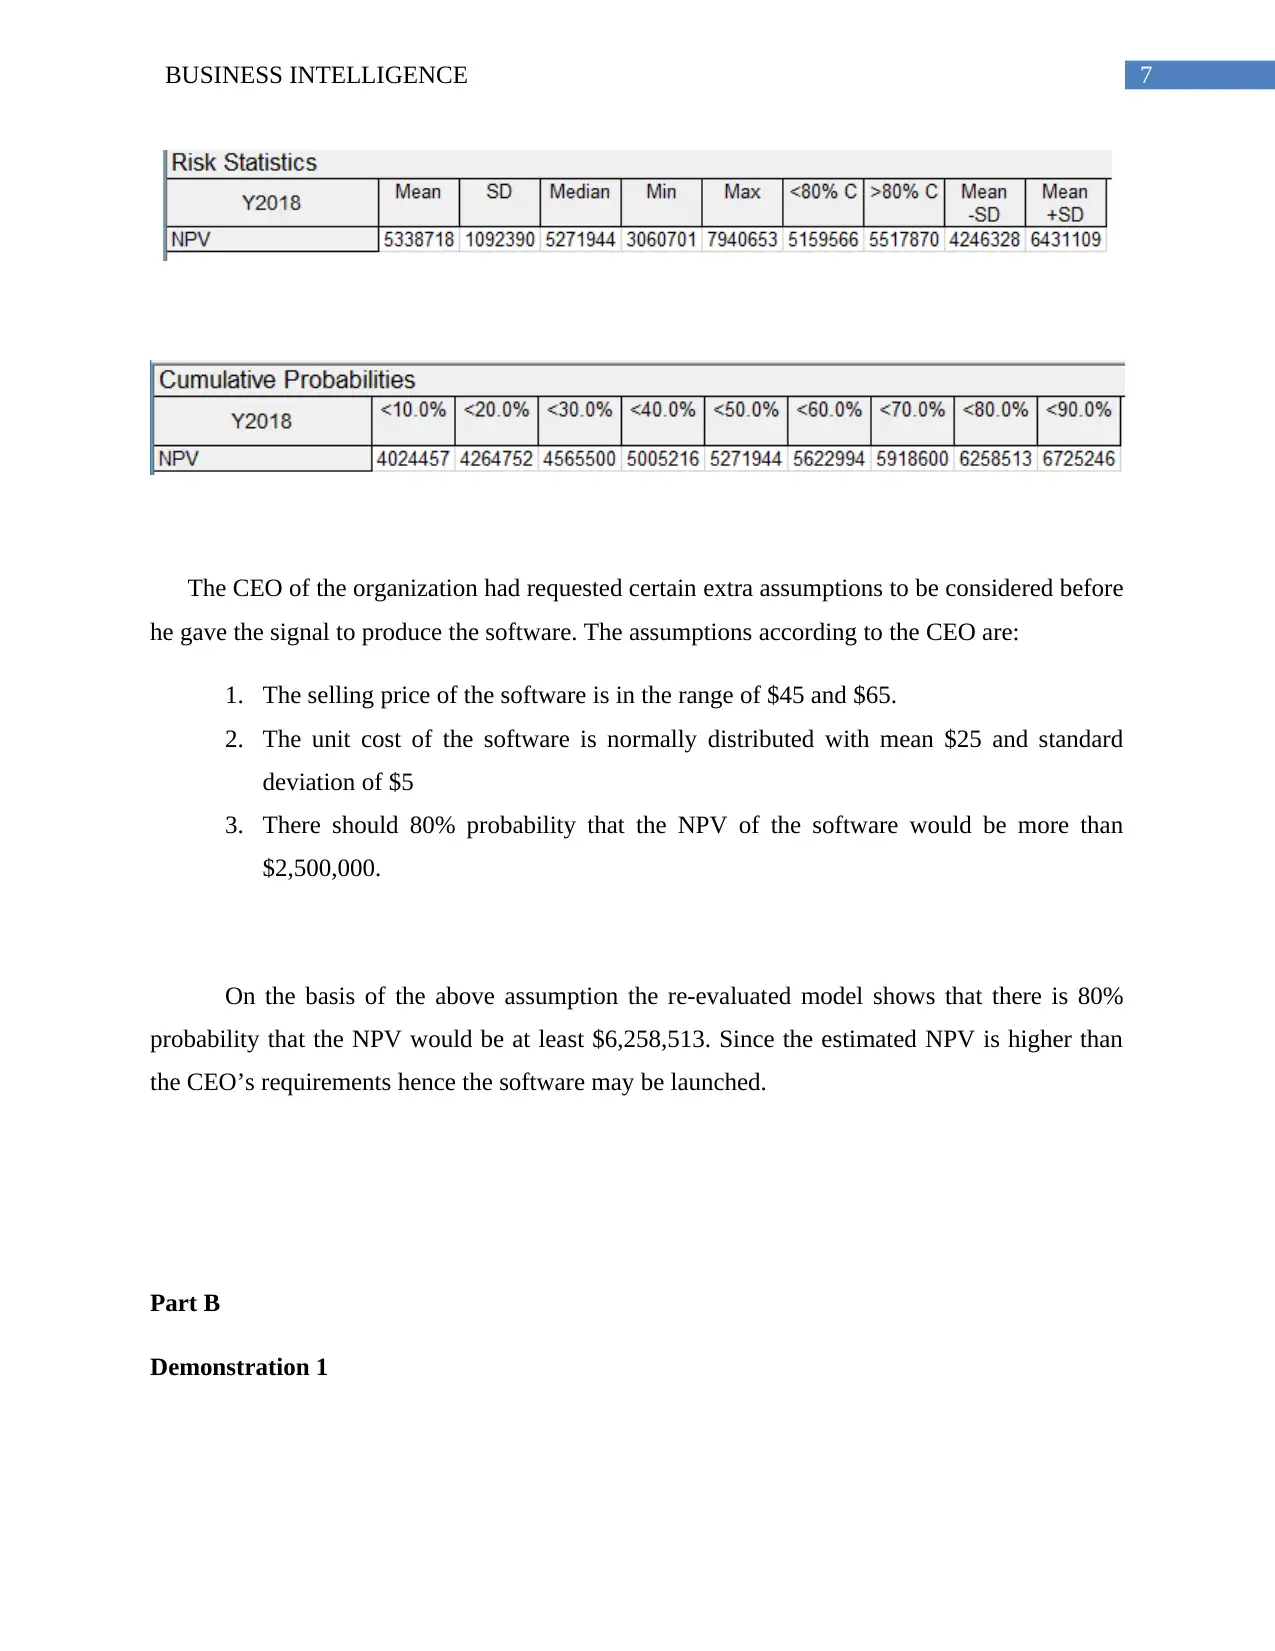
This project presents a comprehensive business intelligence analysis for YourCloud Pty Ltd, a cloud-based software organization. The project evaluates the viability of launching a new software, considering market dynamics and investment decisions. It utilizes Monte-Carlo simulation with visual DSS software to calculate Net Present Value (NPV) under various scenarios, including different market shares, costs, and initial investments. The analysis includes code snippets for NPV calculations, risk assessment, and sensitivity analysis. The project also demonstrates the use of Microsoft Power BI for data visualization and analysis, showcasing dashboards with sales data, labor costs, and funding information. Furthermore, it discusses the impact of smart, connected products on business competition, detailing the transformation of value chains and the role of business intelligence in this context. The project covers the application of business analytics, the integration of smart components, and the use of data for strategic decision-making.
Document Page
Running head: BUSINESS INTELLIGENCE
Business Intelligence
Name of Student:
Name of University:
Author’s Note:
tabler-icon-diamond-filled.svg

Paraphrase This Document

Need a fresh take? Get an instant paraphrase of this document with our AI Paraphraser
Document Page
1BUSINESS INTELLIGENCE
Table of Contents
Part A...............................................................................................................................................2
Answer 1......................................................................................................................................2
Answer 2......................................................................................................................................3
Answer 3......................................................................................................................................6
Part B...............................................................................................................................................7
Demonstration 1...........................................................................................................................7
Demonstration 2.........................................................................................................................10
Part C.............................................................................................................................................12
How Smart, Connected Products Are Transforming Competition................................................12
Introduction....................................................................................................................................12
Discussion......................................................................................................................................12
Conclusion.....................................................................................................................................14
References......................................................................................................................................15
Document Page
2BUSINESS INTELLIGENCE
*Columns
*Years 2018,2021
*Rows
Initial investment(0) = 1750000.00 '.2
Market at Introduction (0)= 420000
Market Growth = 0.15'.2
Market Share = 0.10'.2
Total market = Market at Introduction;Total market(-1)*1.15
Sales Volume = Total Market*Market Share
Estimated selling price = 55.00 '.2
COP = nor(25.00,5.00) '.2
Total Revenue = Sales Volume*Estimated selling Price '.2
COGS = Sales Volume*COP
Annual overhead cost = 210000
Cash Flow = Total Revenue-COGS-Annual Overhead cost
Rate = 0.12'.2
NPV(0) = *NPV cash flow;rate
Part A
YourCloud Pty Ltd is a cloud based software organization operating out of Brisbane,
Australia. The organization plans to launch a new software. The cloud based software market is a
highly dynamic market. In recent times due to some bad decisions, there have been some wrong
investments. Hence, the senior management want to analyze the market before investing in any
new software. Towards this end, they have collected some data on the basis of which decision
has to be taken. Monte-Carlo simulation using visual DSS software is used to take the decision.
Answer 1
In order to calculates the NPV the following code is used:
Document Page
3BUSINESS INTELLIGENCE
The analysis from the available data shows that the net present value (NPV) of the new
software would be $5440551. This is much higher than the anticipated NPV of $2million. Thus,
the senior managers can take a decision in favour of launching the new software.
Answer 2
In order to calculates the NPV the following code is used:
tabler-icon-diamond-filled.svg

Paraphrase This Document

Need a fresh take? Get an instant paraphrase of this document with our AI Paraphraser
Document Page
4BUSINESS INTELLIGENCE
*Columns
*Years 2018,2021
*Rows
Initial investment(0) = UNI(100000.00,200000.00) '.2
Market at introduction (0)= 420000
Market Growth = 0.15'.2
Market Share = TRI(0.05,0.10,0.15)'.2
Total market = Market at introduction;Total market(-1)*1.15
Sales Volume = Total Market*Market Share
Estimated selling price = 55.00 '.2
COP = NOR(30.00,12.00) '.2
Total Revenue = Sales Volume*Estimated selling Price '.2
COGS = Sales Volume*COP
Overhead cost Annual = TRI(150000,215000,350000)
Cash Flow = Total Revenue-COGS-Overhead cost Annual
Rate = 0.12'.2
NPV(0) = *NPV cash flow;rate
In order to evaluate the impact of variations in market share, COP, overheads and initial
investment a risk assessment study needs to be done. The risk assessment needs to be evaluated
based on
Document Page
5BUSINESS INTELLIGENCE
1. The market share of the new software would vary in the rage of 5 to 15% with a
probability of around 10%
2. The unit cost of the software is normally distributed with mean $30 and standard
deviation $12.
3. Overhead cost for the software would vary between $150,000 and $350,000 with the
maximum probability of the overhead cost being $215,000 per year.
4. The initial requirement for the production of the software would be between $1 and $2
million.
From the analysis it is found that given that the market share is 20% the NPV of the software
would be $2,908,313. Moreover, given a market share of 10% the NPV of the software would be
$2,244,173. In either case it is found that the NPV of the new software is higher than $1,000,000.
Since the NPV of the software is higher than the anticipated value of $1,000,000, hence the
management can launch the new software.
Document Page
6BUSINESS INTELLIGENCE
*Columns
*Years 2018,2021
*Rows
Initial investment (0) = 1750000.00 '.2
Market at introduction (0)= 420000
Market Growth = 0.15'.2
Market Share = TRI(0.05,0.10,0.15)'.2
Total market = Market at introduction;Total market(-1)*1.15
Sales Volume = Total Market*Market Share
Estimated selling price = UNI(45.00,65.00) '.2
COP = NOR(25.00,5.00) '.2
Total Revenue = Sales Volume*Estimated selling Price '.2
COGS = Sales Volume*COP
Overhead cost Annual = 210000
Cash Flow = Total Revenue-COGS-Overhead cost Annual
Rate = 0.12'.2
NPV(0) = *NPV cash flow;rate
Answer 3
In order to calculates the NPV the following code is used:
tabler-icon-diamond-filled.svg

Paraphrase This Document

Need a fresh take? Get an instant paraphrase of this document with our AI Paraphraser
Document Page
7BUSINESS INTELLIGENCE
The CEO of the organization had requested certain extra assumptions to be considered before
he gave the signal to produce the software. The assumptions according to the CEO are:
1. The selling price of the software is in the range of $45 and $65.
2. The unit cost of the software is normally distributed with mean $25 and standard
deviation of $5
3. There should 80% probability that the NPV of the software would be more than
$2,500,000.
On the basis of the above assumption the re-evaluated model shows that there is 80%
probability that the NPV would be at least $6,258,513. Since the estimated NPV is higher than
the CEO’s requirements hence the software may be launched.
Part B
Demonstration 1
Document Page
8BUSINESS INTELLIGENCE
Figure 1: Complete Car sales
The above figure represents the car sales of British car sales. From the analysis it is found
that the data contains information on the sales of cars of various models. The map represents the
labour costs across different countries. The diameter of the bubble represents the labour costs.
From the diameter of the bubble it can be envisaged that the labour costs for United Kingdom is
the highest. The analysis also provides us with the information that the organization has sold
495K spare parts. In addition, the delivery charges of various models show that there is variation
in the delivery charges across models. Moreover, information on the sales price of cars in
different countries from 2012 to 15 is also presented. From the information, it can be gathered
that the sum of the sales prices across 4 years is the highest for United Kingdom. Moreover, the
sum of the sales price for the organization is 31697940.
Document Page
9BUSINESS INTELLIGENCE
Figure 2: Car Sales DB9
For the model DB9 the highest labour cost is from United States. Moreover, for the
model 44K spare parts have been sold by British Car Sales. In addition, it is found that sum of
the car sales for model DB9 is 5423860. For model DB9, the highest sales has been from United
States. In United States, total DB9 sales is 3609410.
Microsoft power BI is a very useful tool for analysis of data. From the analysis of the
present data it is seen that the tool can be used to visualise geographical information, yearly
trends very effectively. Moreover, the information’s in a dashboard using similar variables gets
related. Thus change in information in one visualising tool gets reflected in another visualising
tool. In the present circumstance, a second dashboard was created using the first dashboard as
reference. When the slicer tool is used, all visualisations change with reference to the slicer.
Thus, in the second dashboard all the information is related to “DB9” only. Thus, business data
can be analysed and investigated through the use of Microsoft power BI.
tabler-icon-diamond-filled.svg

Paraphrase This Document

Need a fresh take? Get an instant paraphrase of this document with our AI Paraphraser
Document Page
10BUSINESS INTELLIGENCE
Demonstration 2
Figure 3: Information on Funding Recipients
In the above dashboard information is analysed on the advance Queensland Funding
recipients. The information contains the funding committed based on program and sector.
Document Page
11BUSINESS INTELLIGENCE
Figure 4: Research Funding’s on Research Fellowships
The above dashboard presents information on advance funding for research fellowships.
The total advance for research fellowships is 9300000. The maximum amount advanced for
research fellowships is for health care and social assistance.
The information on advances by Government of Queensland has been analysed by the
use of Microsoft Power BI. In the first dashboard we have created a pie chart, tree map, a table
and stacked bar chart. However, the link between the four charts is very poor. When the second
dashboard is created we select “research fellowships.” In the tree map we select the given
variable. However, the pie chart is not able to reflect the value of “research fellowships,” only
the instruments become lighter. Further, in the stacked bar chart we find that the values of
“research fellowships” are deeper as compared to other instruments. Thus, in such
circumstances, where there is a poor link between the charts, data validation is poor.
chevron_up_icon
1 out of 17
circle_padding
hide_on_mobile
zoom_out_icon
[object Object]