INFS2036 Study Period 5: Woolworths BI Dashboard Proposal Analysis
VerifiedAdded on 2022/12/12
|13
|2405
|446
Report
AI Summary
This report presents a comprehensive proposal for implementing business intelligence (BI) dashboards at Woolworths, a major Australian retailer. The proposal focuses on evaluating the performance of marketing campaigns, particularly the customer loyalty program and social media marketing, from a financial perspective. It aims to determine the effectiveness of various promotional efforts and their impact on Woolworths' market share. The report outlines the methodology, including data sources from similarweb.com, Kaggle, and Statista, and proposes two dashboard visualizations: an online marketing dashboard and a financial management dashboard. It addresses potential challenges such as data quality and ethical considerations, and concludes with a summary of the benefits of using BI dashboards in business performance evaluation. The objective is to optimize marketing strategies and reduce related financial costs while maintaining the firm's competitive strength.
Executive Summary
In the following paper, a proposal on the adoption of business intelligence dashboards will be
given which generally consists the evaluation of how the use of a dashboard might have an
impact on monitoring of the performance of Woolworths in relation to marketing and finance.
Objective
The objective of the paper is to provide the details of a dashboard which will be used in
evaluating the different marketing campaigns by the firm (both online and physical) with an aim
of determining which campaign is performing well and which one is not.
Methodology
So as to develop the dashboard successfully, several components will be utilized including:
data which will be obtained from 3 different sources as detailed in the data section below, as well
as choice of the appropriate dashboard in which case, the paper proposes either an Online
marketing dashboard or financial management dashboard depending on the need of the firm.
However, both dashboards can be used if required.
Conclusion
The integration of BI dashboards in the evaluation of business performance have got several
advantages though there might be some ethical concerns and issues which need to be taken into
consideration.
Paraphrase This Document
Need a fresh take? Get an instant paraphrase of this document with our AI Paraphraser
Introduction
Over the past few years, the business world has seen substantial change in the way businesses
conduct their operations, ranging from marketing, human resource, sales, accounting, decision
making etcetera, business have adopted new measures which differ from those used 10-20 years
ago. Therefore, the question lies in what has driven such disruptive changes. According to an
article published in “The Economist”, this might have been triggered by data which is now the
most valuable resource surpassing oil by 2017 (Hwang, 2017). With the growth of the value of
data, it is only sensible that the respective players adopt supplementary technology that will
enable the utilization of the power of data. Such technology includes components of Business
Intelligence etc.
In this paper, a proposal on the potential use of dashboards in Woolworths will be developed.
This will include, exploration of a selected key priority which will provide an overview of
Woolworths as a firm, an area in which the use of business intelligence (dashboards) would
benefit the firm. The overview will be a precursor to the proposed questions that upon
implementation, the dashboard will be able to answer. Further, the proposal will include the
potential challenges that are likely to be encountered as well as propose data sources from where
the dashboard implementation data will be obtained from.
The rest of the paper is split into 6 major sections which will include: Overview of Selected
Key Priority, Questions to be Answered by Dashboard, Data and Data Sources (which will be
sued in developing the dashboard), Sample Dashboard Screenshot, Potential Challenges and
Issues, and Conclusion/Summary.
Overview of Selected Key Priority
Business Problem
Among the key objectives of the firm is to ensure that it sustains its market share despite the
entrance of new competitors. However, stepping up the firm’s methods of operation so as to
compete in the Lifestyle and Retail (grocery and related products in which Woolworths retails),
often comes with its fair share of effects which include substantial costs related to the measures
adopted to counter market competition. Ideally, it is fundamental that the performance of such
measures in terms of reinforcing the firm’s position in the market be evaluated.
In 2007, Woolworths introduced a customer loyalty scheme which awards the consumers a
point for every dollar that they spend in purchasing goods from Woolworths supermarkets. The
objective underlying such a program is often embedded on the hypothesis that loyalty programs
tend to influence consumer purchasing behaviors. Moreover, customer loyalty points are among
the several deliberate marketing efforts made by the firm.
Fast forward to 2015 (the customer loyalty scheme was overhauled but back flipped in
2016), the cost of running the customer loyalty scheme grew to approximately $500 million a
year according to Deutsche Bank (Mitchell, 2015), which is relatively high given that such costs
are to be borne by the firm.
Given the above literature, the selected key priority of this project is to explore the costs of
marketing efforts by Woolworths, the financial costs of such methods as well as determine from
the dashboards the effects of the marketing campaigns in terms of influencing the market and
how to optimally reduce the related financial costs while still maintaining the firm’s competitive
strength in the market.
⊘ This is a preview!⊘
Do you want full access?
Subscribe today to unlock all pages.
Trusted by 1+ million students worldwide
For instance, studies by “Australian Centre for Retail Studies” showed that in a span of 7.4
weeks, a member of the loyalty program earns an average of $10 on every $107 spent which is
similar to offering a 1.25% discount.
Financial Priority in Marketing
Woolworths adopts a marketing mix approach with the firm adopting the 4Ps strategy which
involves, Product, Price, Place, Promotion (Bhasin, 2019). Whereas, the 4Ps strategy involves a
wide range of marketing features, the customer loyalty scheme as well as other product
promotion methods such as advertising are categorized under promotion.
Promotion
One of the key strengths of Woolworths is their aligning towards innovative marketing which
over the years has prompted the development of schemes that have promoted the brand’s market
visibility which includes using various mediums of advertisement to boast the Woolworths brand
awareness. Such efforts are visible through the firm’s efforts to develop their own app, adopt
social media marketing through sites such as YouTube, twitter, Facebook, Instagram etcetera by
building “a niche place for itself via positive marketing” (Bhasin, 2019). These efforts are further
augmented by the launching of customer loyalty.
In the process of seeking to maintain market presence, increase market shares and deal with
competition, it is possible that firms fall into the trap of overly doing it and reach to the point
where the efforts are not reflected in the output.
The fundamental objective therefore is to evaluate whether the related promotional
campaigns are productive. That is, does social media marketing contribute to the market
depending on the original performance indicator set? Or does customer loyalty scheme fall
within the firm’s objectives or is it costly. In line with this, it is important to evaluate the key
Paraphrase This Document
Need a fresh take? Get an instant paraphrase of this document with our AI Paraphraser
performance indicators (KPIs) of the marketing practices adopted by the firm from a financial
perspective.
Questions to be Answered by Dashboard
Based on the overview of the selected priority (evaluating the performance of marketing
campaigns from a financial perspective), the questions that will be sought to be answered by the
business dashboard are:
What is the effect of the different marketing campaigns?
For instance, in terms of the set KPIs, what is the performance of different social media
marketing campaigns run by the firm? Is there a difference in performance of the marketing
campaigns?
What are the financial implications of the marketing campaigns?
Underlying this questions are the basic questions such as: what is the distribution of the costs
incurred by the firm in terms of marketing (customer loyalty, social media marketing, advertising
etcetera)?
Does the firm engage in price wars as a marketing measure?
That is, does the firm use price wars as a marketing measure and if so, is there any
relationship between cutting the firm’s prices in relation to those of the competitors in terms of
sales?
Which is the most optimal marketing strategy to adopt?
Given the results of analyzing the marketing strategies, which is the most financially optimal
solution to adopt i.e. which strategy has the potential of reducing the cost of marketing incurred
by the firm.
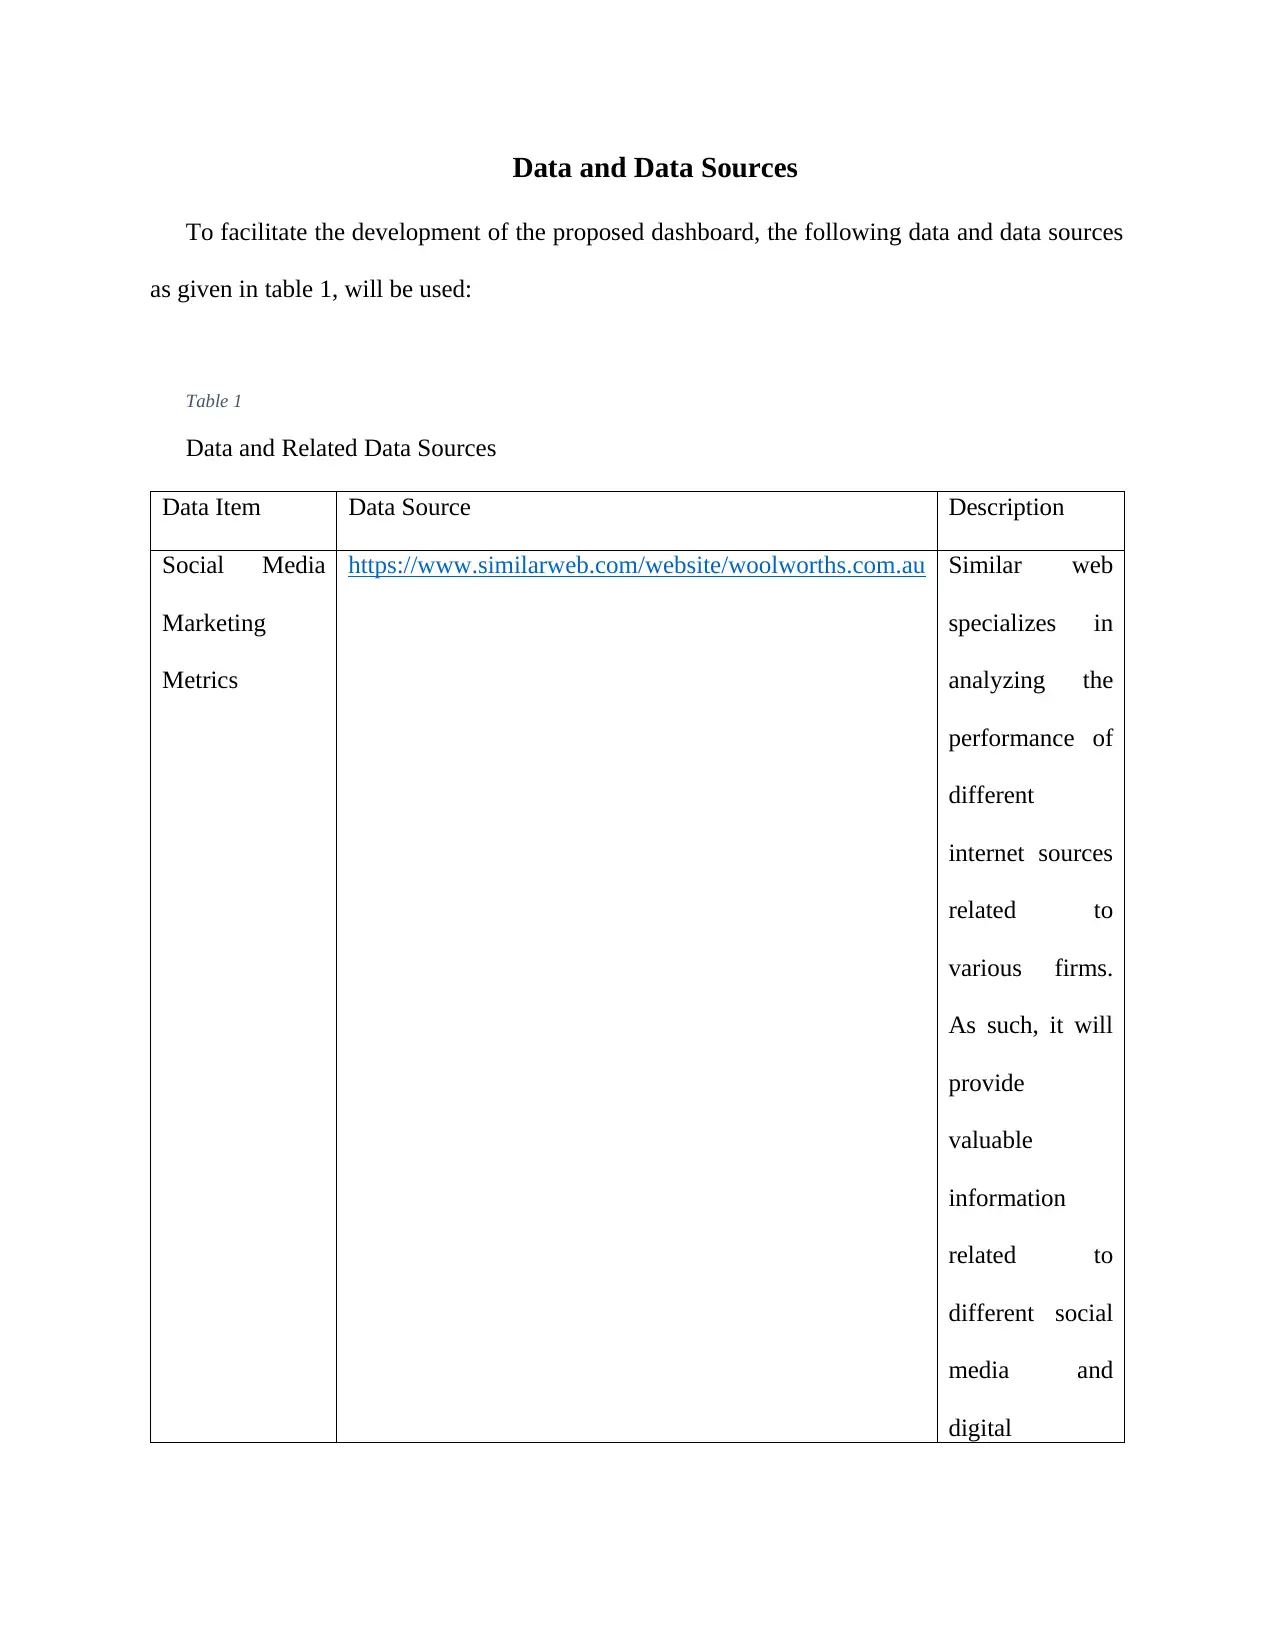
Data and Data Sources
To facilitate the development of the proposed dashboard, the following data and data sources
as given in table 1, will be used:
Table 1
Data and Related Data Sources
Data Item Data Source Description
Social Media
Marketing
Metrics
https://www.similarweb.com/website/woolworths.com.au Similar web
specializes in
analyzing the
performance of
different
internet sources
related to
various firms.
As such, it will
provide
valuable
information
related to
different social
media and
digital
⊘ This is a preview!⊘
Do you want full access?
Subscribe today to unlock all pages.
Trusted by 1+ million students worldwide
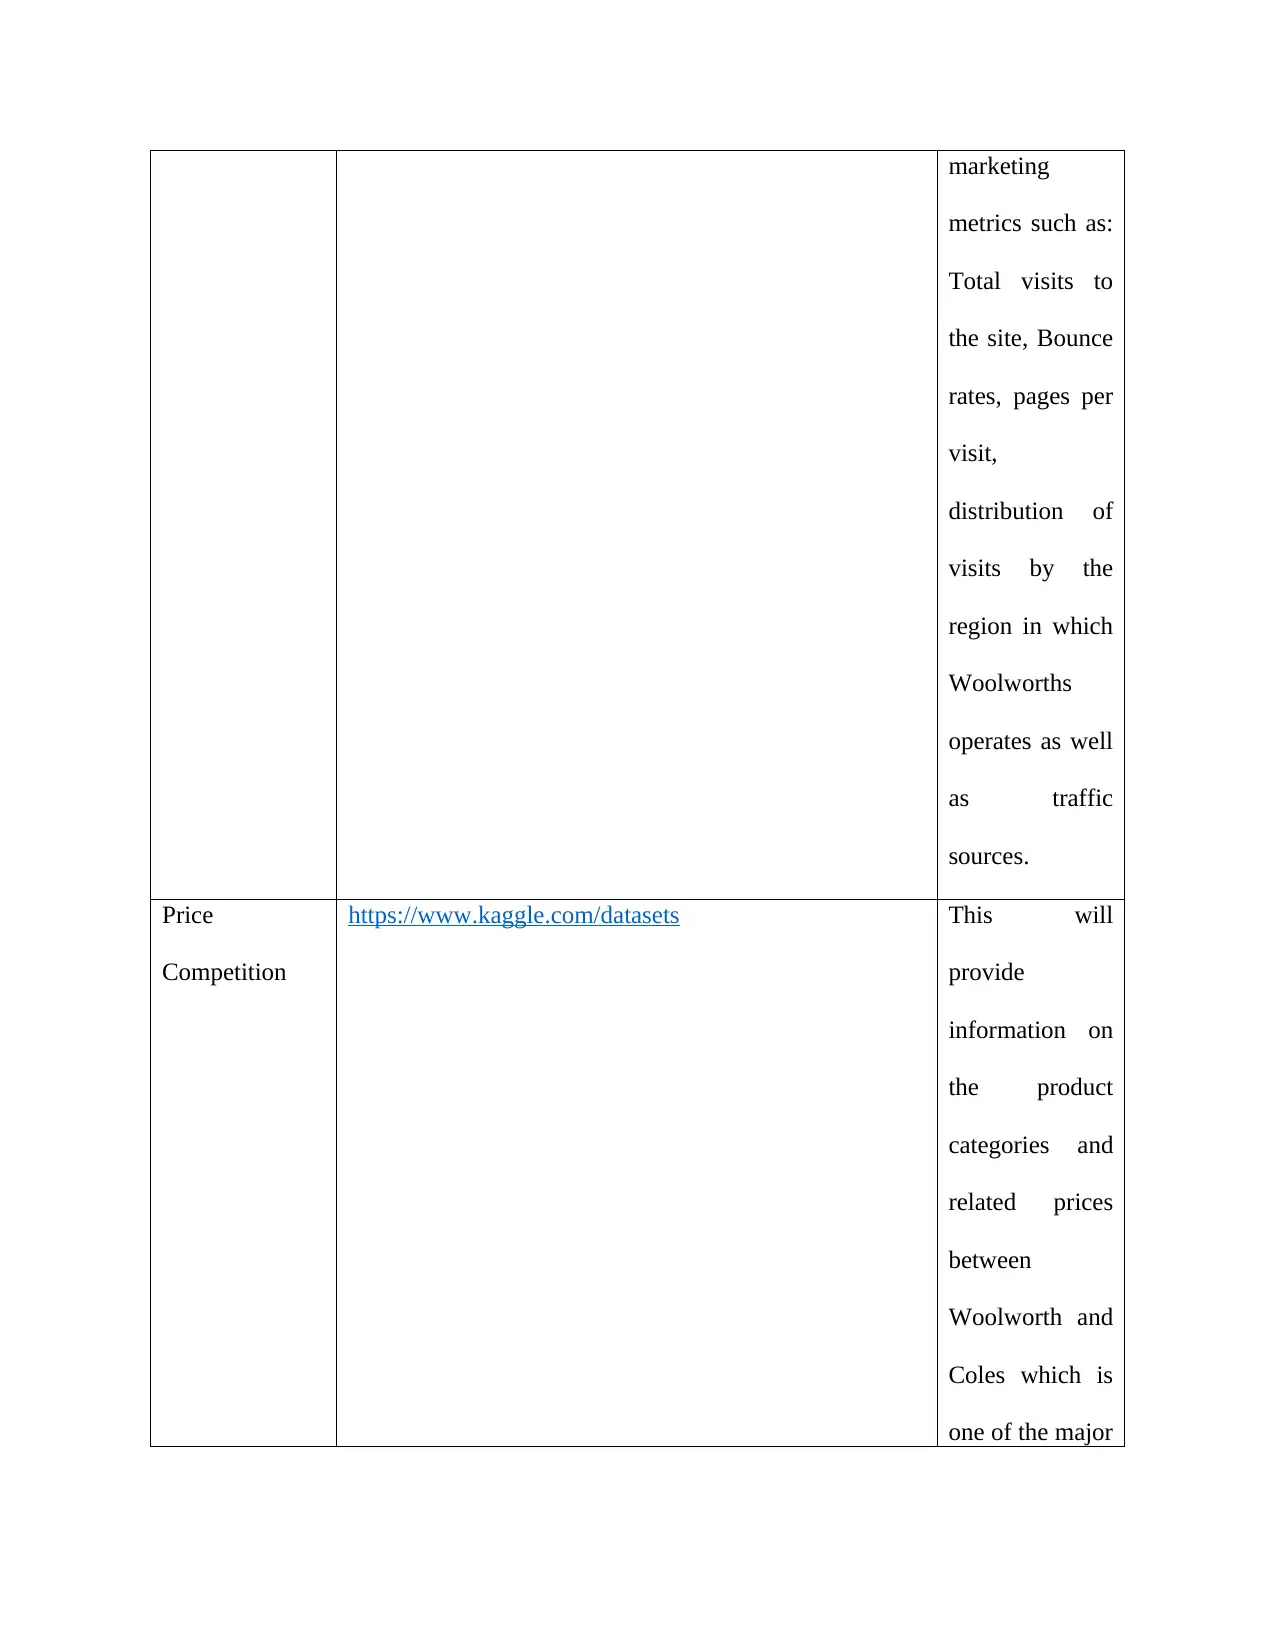
marketing
metrics such as:
Total visits to
the site, Bounce
rates, pages per
visit,
distribution of
visits by the
region in which
Woolworths
operates as well
as traffic
sources.
Price
Competition
https://www.kaggle.com/datasets This will
provide
information on
the product
categories and
related prices
between
Woolworth and
Coles which is
one of the major
Paraphrase This Document
Need a fresh take? Get an instant paraphrase of this document with our AI Paraphraser
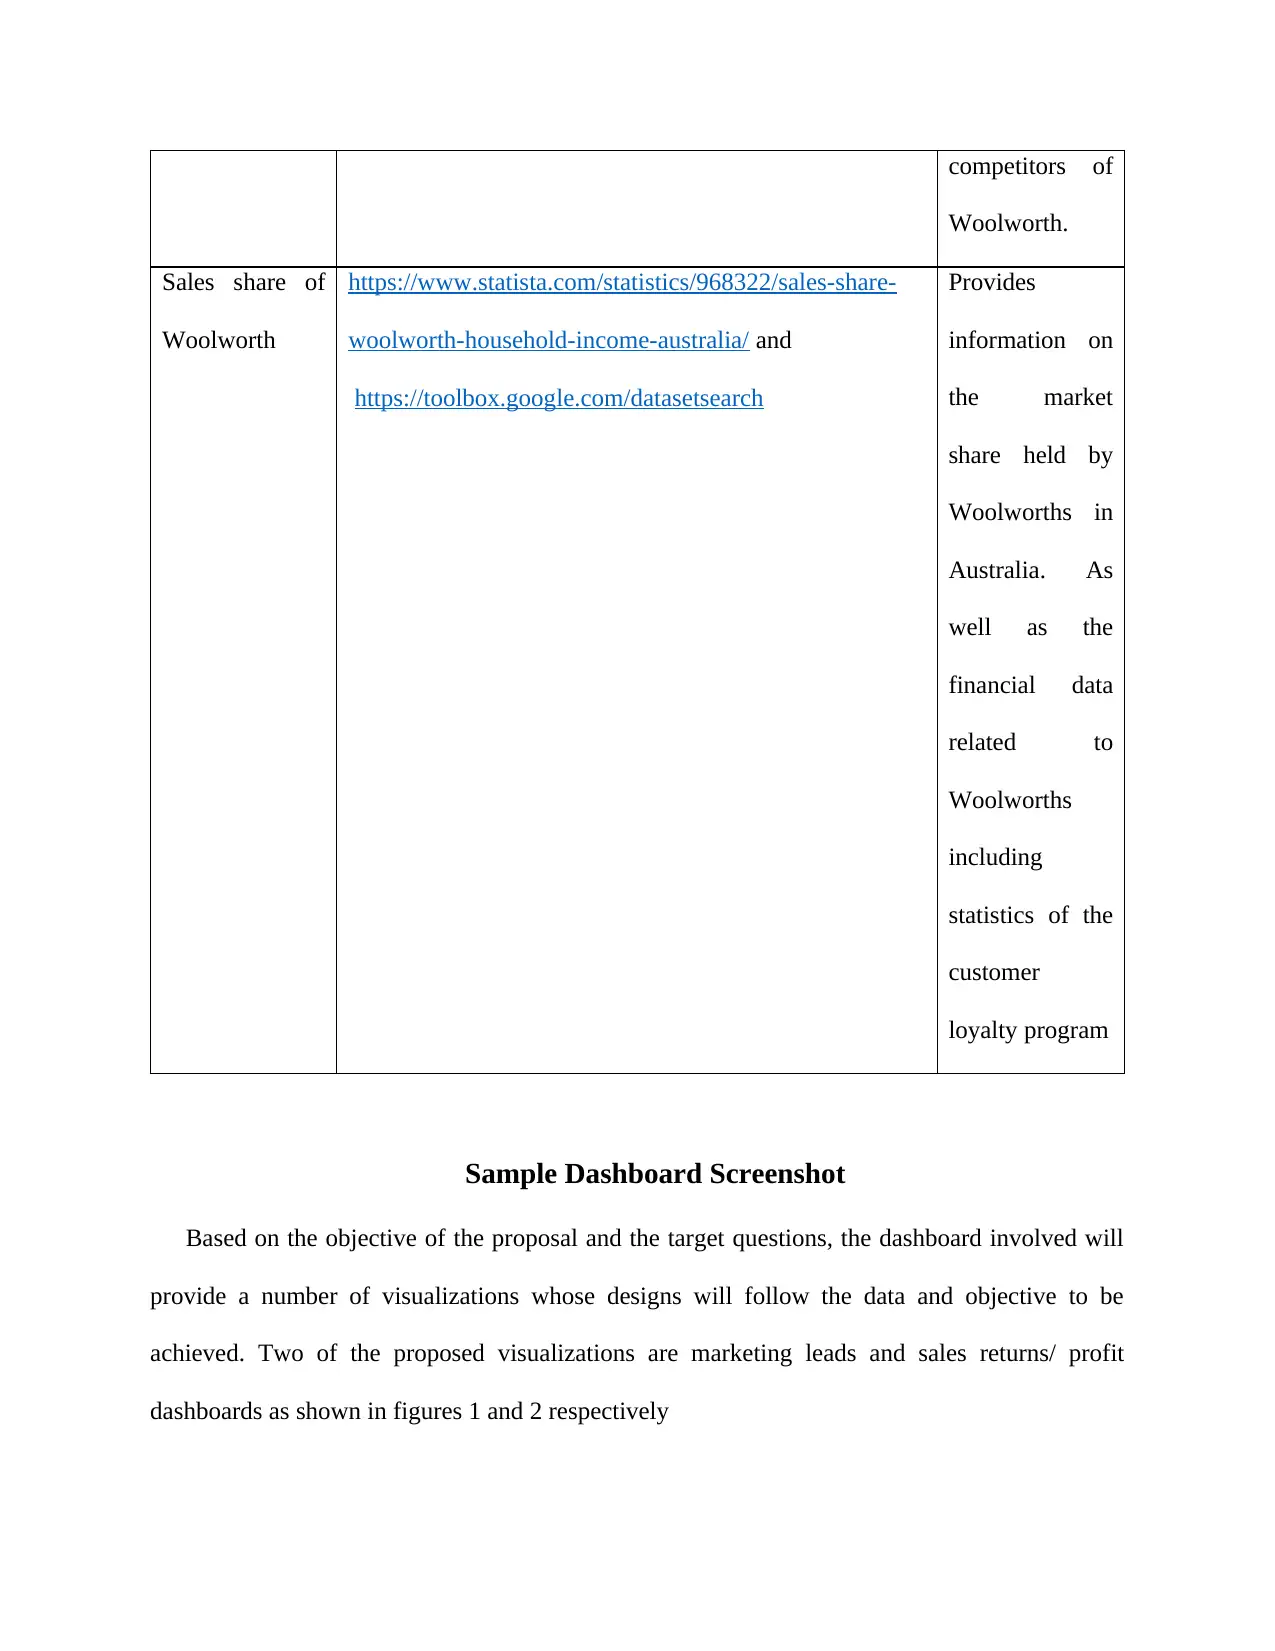
competitors of
Woolworth.
Sales share of
Woolworth
https://www.statista.com/statistics/968322/sales-share-
woolworth-household-income-australia/ and
https://toolbox.google.com/datasetsearch
Provides
information on
the market
share held by
Woolworths in
Australia. As
well as the
financial data
related to
Woolworths
including
statistics of the
customer
loyalty program
Sample Dashboard Screenshot
Based on the objective of the proposal and the target questions, the dashboard involved will
provide a number of visualizations whose designs will follow the data and objective to be
achieved. Two of the proposed visualizations are marketing leads and sales returns/ profit
dashboards as shown in figures 1 and 2 respectively
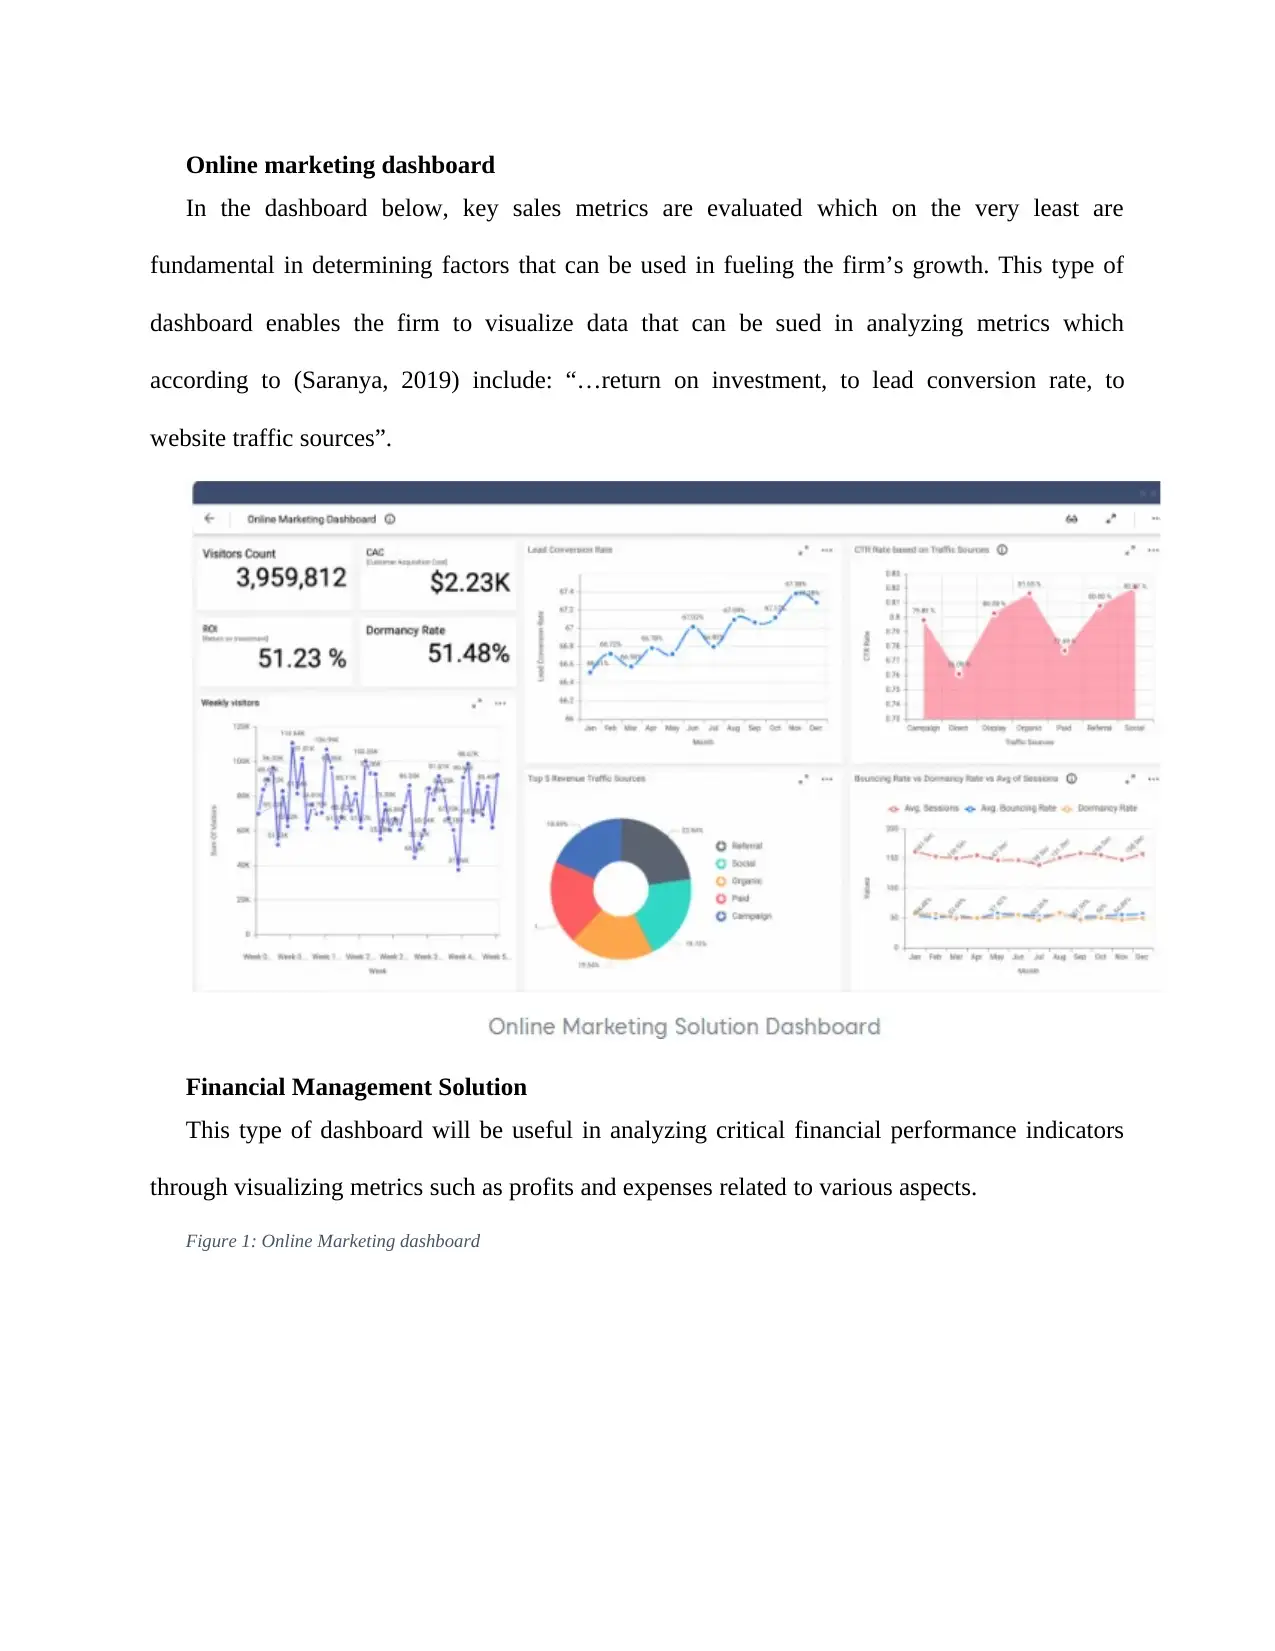
Online marketing dashboard
In the dashboard below, key sales metrics are evaluated which on the very least are
fundamental in determining factors that can be used in fueling the firm’s growth. This type of
dashboard enables the firm to visualize data that can be sued in analyzing metrics which
according to (Saranya, 2019) include: “…return on investment, to lead conversion rate, to
website traffic sources”.
Financial Management Solution
This type of dashboard will be useful in analyzing critical financial performance indicators
through visualizing metrics such as profits and expenses related to various aspects.
Figure 1: Online Marketing dashboard
⊘ This is a preview!⊘
Do you want full access?
Subscribe today to unlock all pages.
Trusted by 1+ million students worldwide
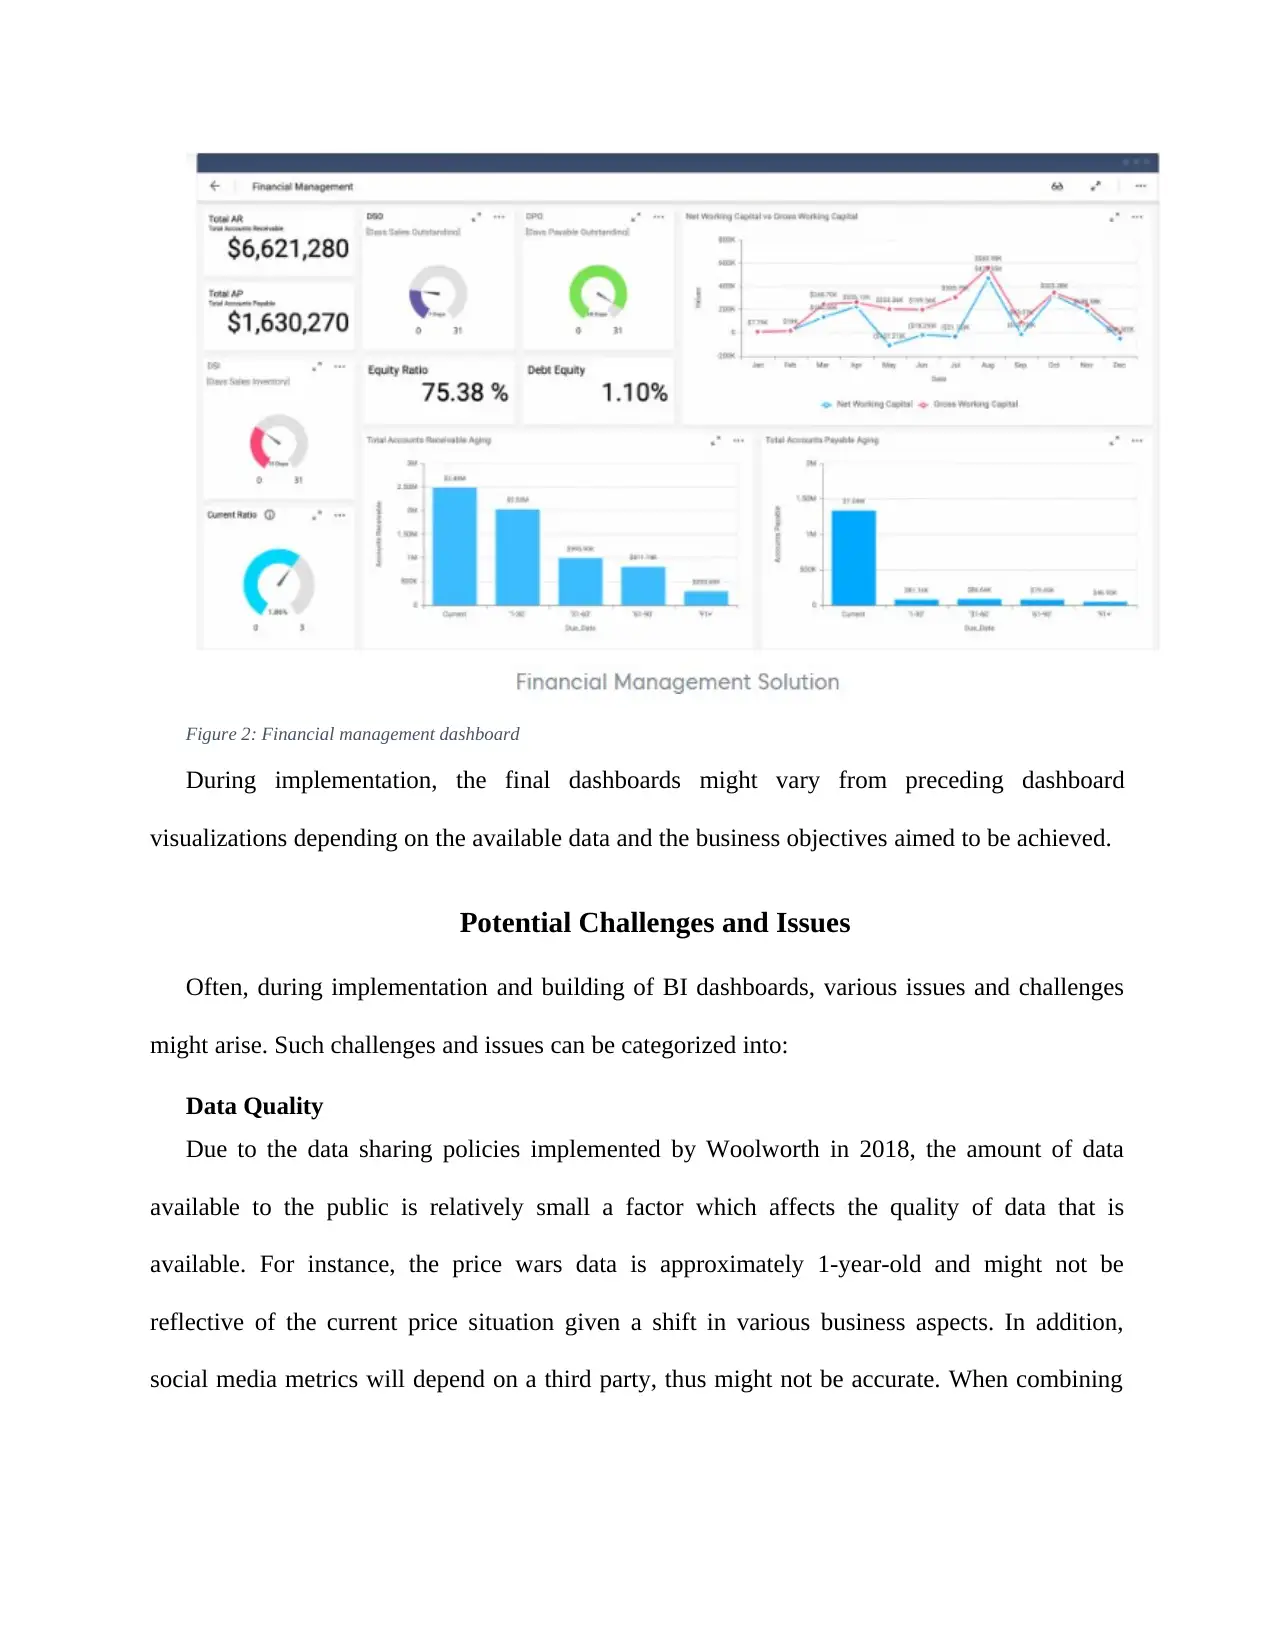
Figure 2: Financial management dashboard
During implementation, the final dashboards might vary from preceding dashboard
visualizations depending on the available data and the business objectives aimed to be achieved.
Potential Challenges and Issues
Often, during implementation and building of BI dashboards, various issues and challenges
might arise. Such challenges and issues can be categorized into:
Data Quality
Due to the data sharing policies implemented by Woolworth in 2018, the amount of data
available to the public is relatively small a factor which affects the quality of data that is
available. For instance, the price wars data is approximately 1-year-old and might not be
reflective of the current price situation given a shift in various business aspects. In addition,
social media metrics will depend on a third party, thus might not be accurate. When combining
Paraphrase This Document
Need a fresh take? Get an instant paraphrase of this document with our AI Paraphraser
all this factors which lead to low quality data, the quality of the final dashboard might be affected
leading to over/under estimation of the measured metrics.
Ethics
Business intelligence which encompasses dashboard building, is categorized under data
analytics. Given that data analytics at large utilizes data which often is extracted from consumer
activities both online and in the physical stores, issues related to privacy and transparency on the
ultimate use of data should be tackled upfront. For instance, the firm should be open on how it
will use the data that will be extracted from online user experiences and activities so as to
provide the user with an option of whether to provide the respective information or not.
Other ethical issues related to BI dashboard building include:
Accuracy in data/ availability and reliability
Given the cost of accurate data, some organizations choose to utilize less accurate data which
is cheaper. Use of such data might be costly in the end since it may end up leading to the
extraction of wrong insights thus misinforming the executive on the appropriate actions to take in
reducing financial costs related to product promotion. The reliability of the data will therefore
depend on the openness of the firm in sharing the related data or the accuracy of the chosen data
sources.
Organizational accountability
In BI, the respective firm should be accountable for any financial data so as to ensure that
there is sufficient informational security in the firm.
Conclusion
Business intelligence is a relatively new and emerging field in business. As such it requires
extensive research to add to its already growing usability. However, the advantages of using BI
dashboards are numerous despite the potential effort and resources required to successfully
implement dashboards in the business. From the proposal above, such benefits lie in the ability
of dashboards to visualize different aspects therefore illustrating the performance of different
metrics related to issues such finance, human resource, marketing etcetera.
Given the potential promised by dashboard in providing an overview of how Woolworths
promotional campaigns perform financially, it would be best that the executive considers
adoption of the proposed BI dashboards.
⊘ This is a preview!⊘
Do you want full access?
Subscribe today to unlock all pages.
Trusted by 1+ million students worldwide
1 out of 13
Related Documents


Your All-in-One AI-Powered Toolkit for Academic Success.
+13062052269
info@desklib.com
Available 24*7 on WhatsApp / Email
![[object Object]](/_next/static/media/star-bottom.7253800d.svg)
Unlock your academic potential
Copyright © 2020–2026 A2Z Services. All Rights Reserved. Developed and managed by ZUCOL.