Business Intelligence Report: Cloud-Pty Limited's New Software Product

Verified

Added on  2021/04/21

|18
|3303
|43
Report
AI Summary
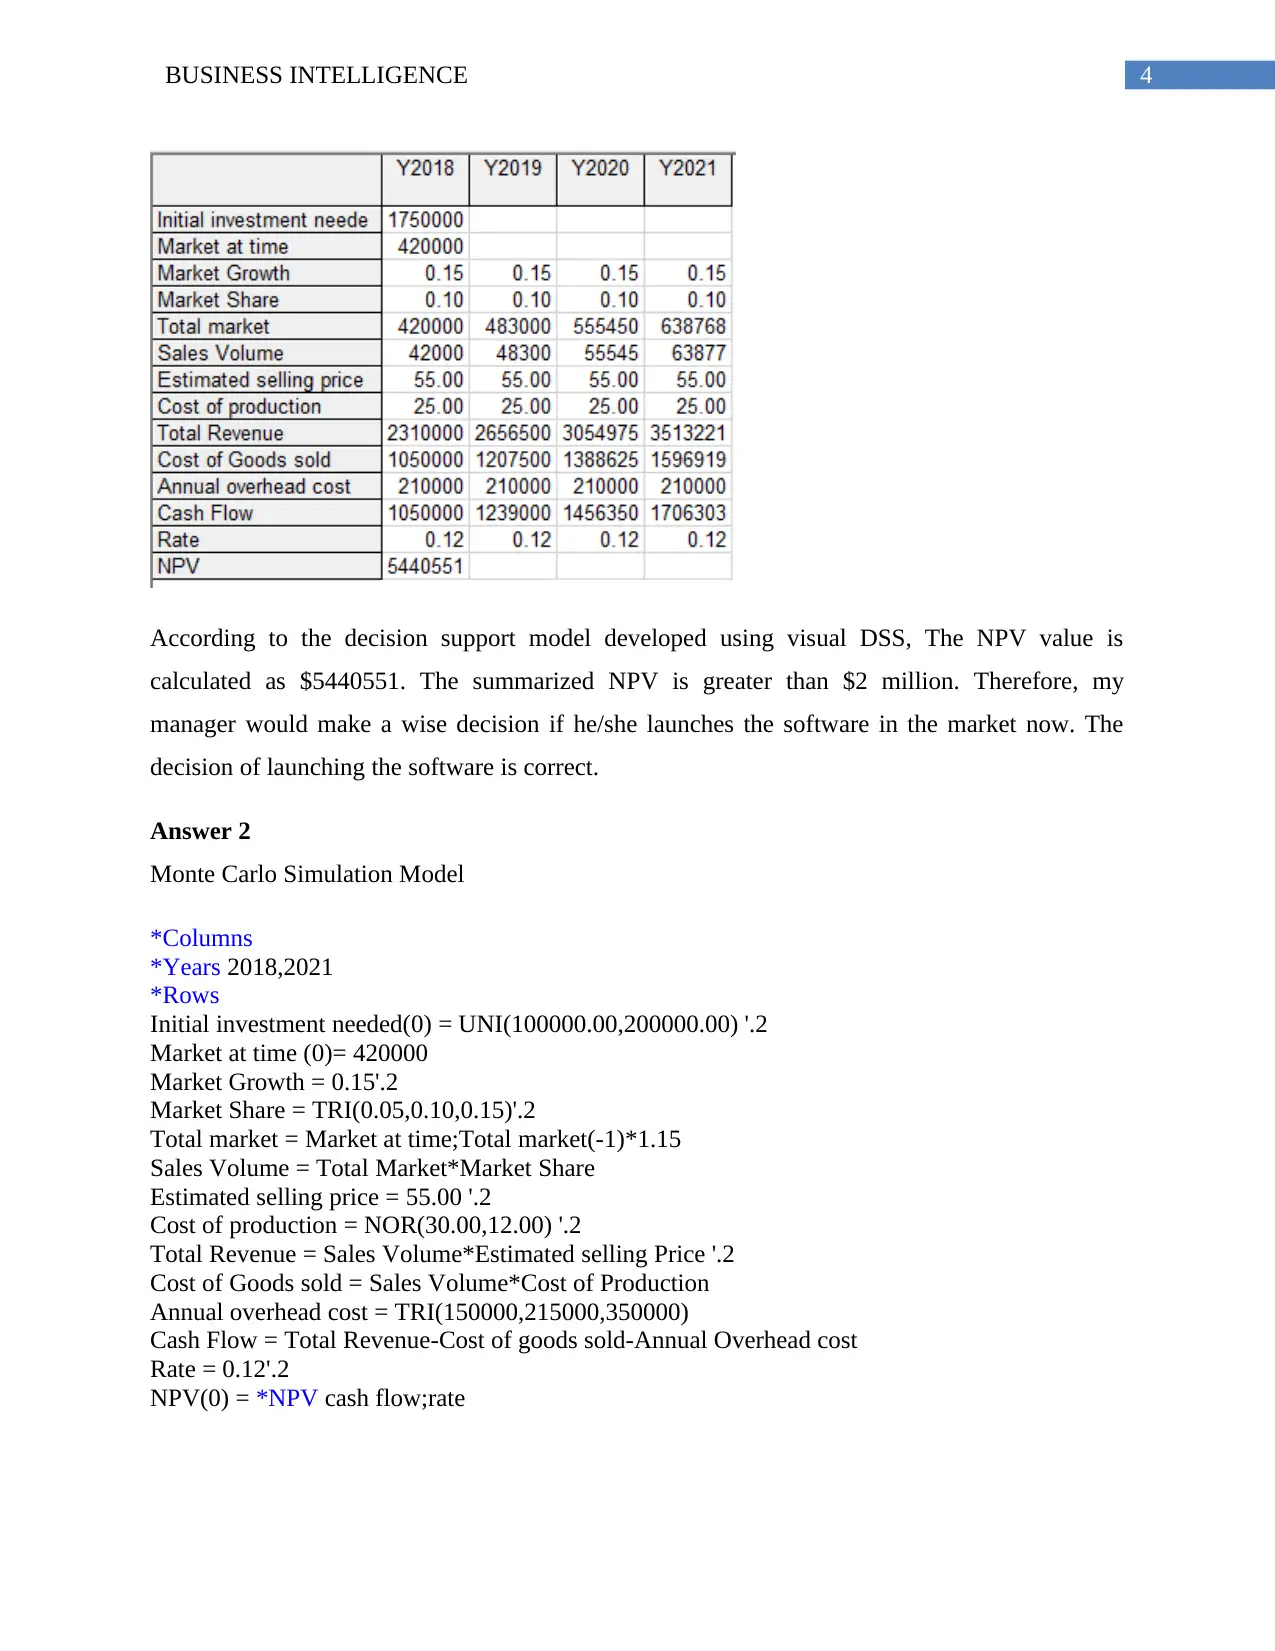
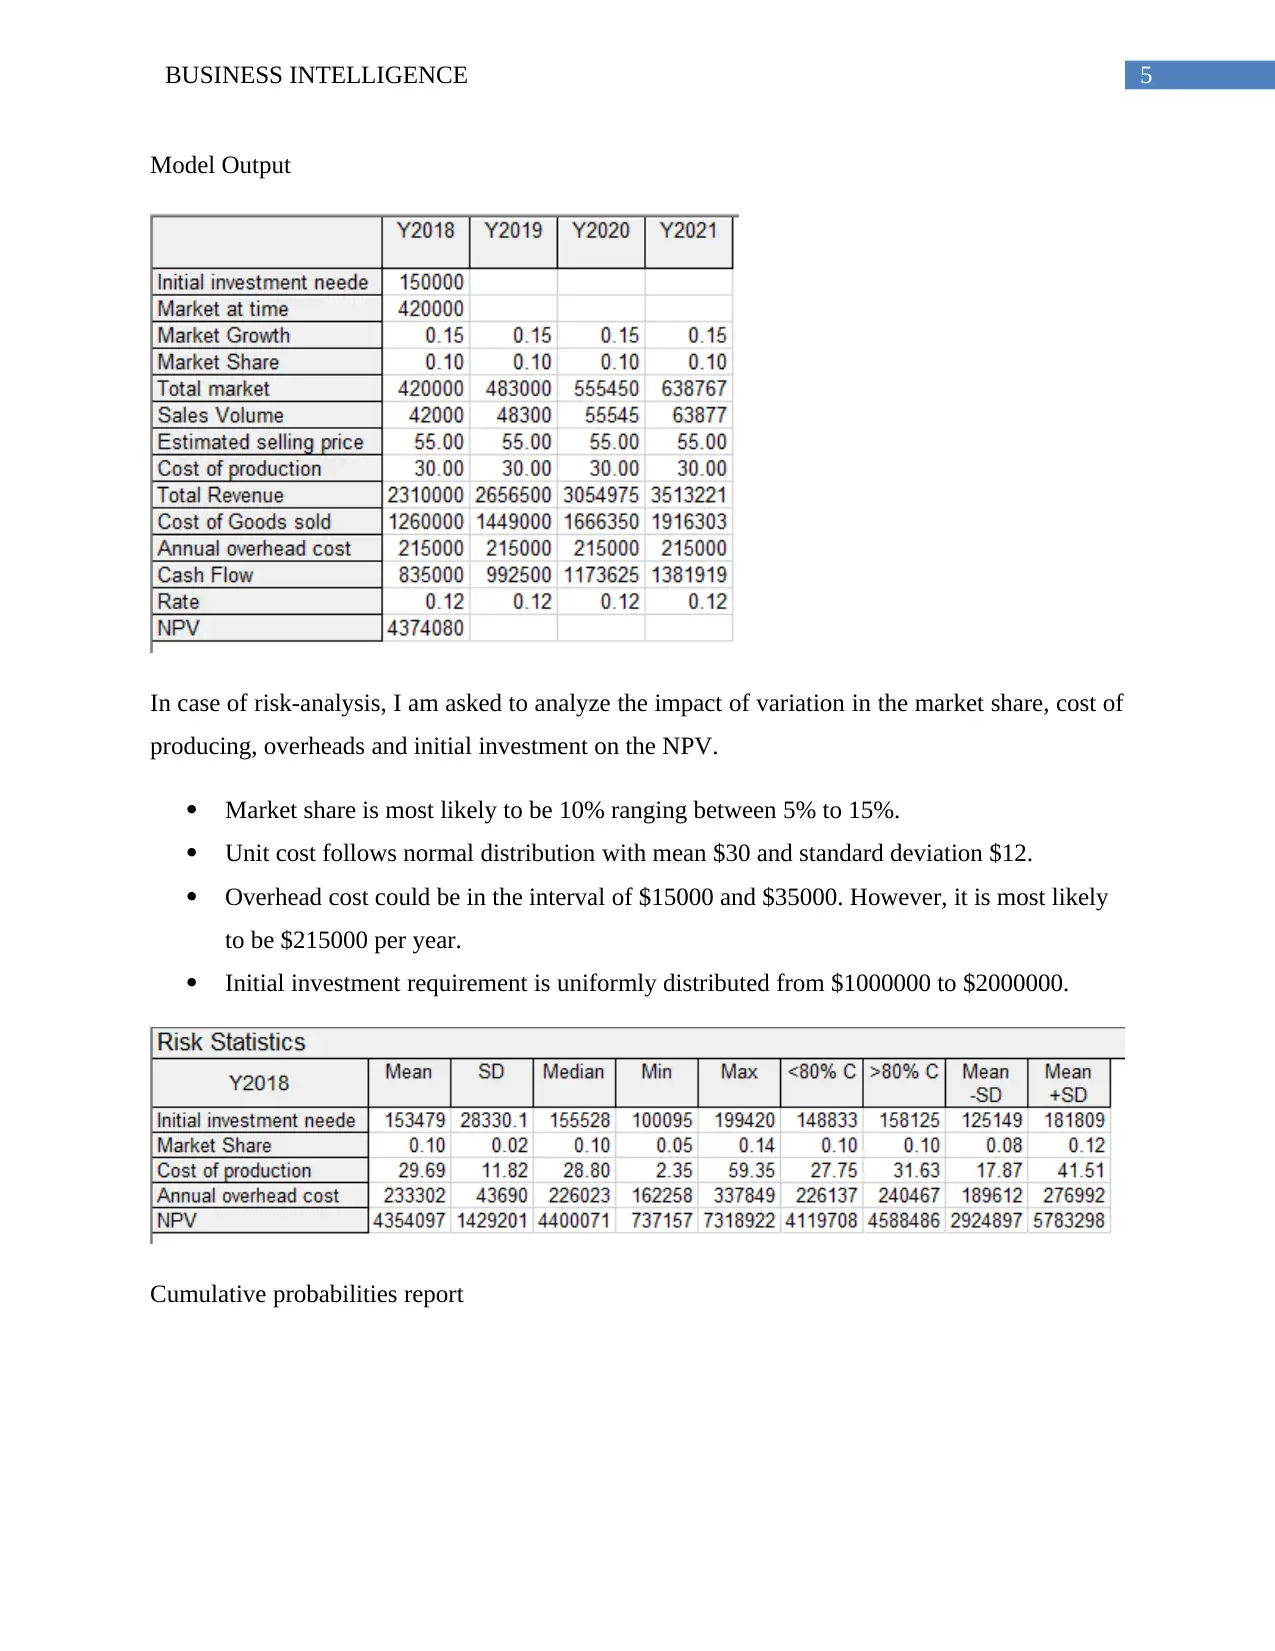
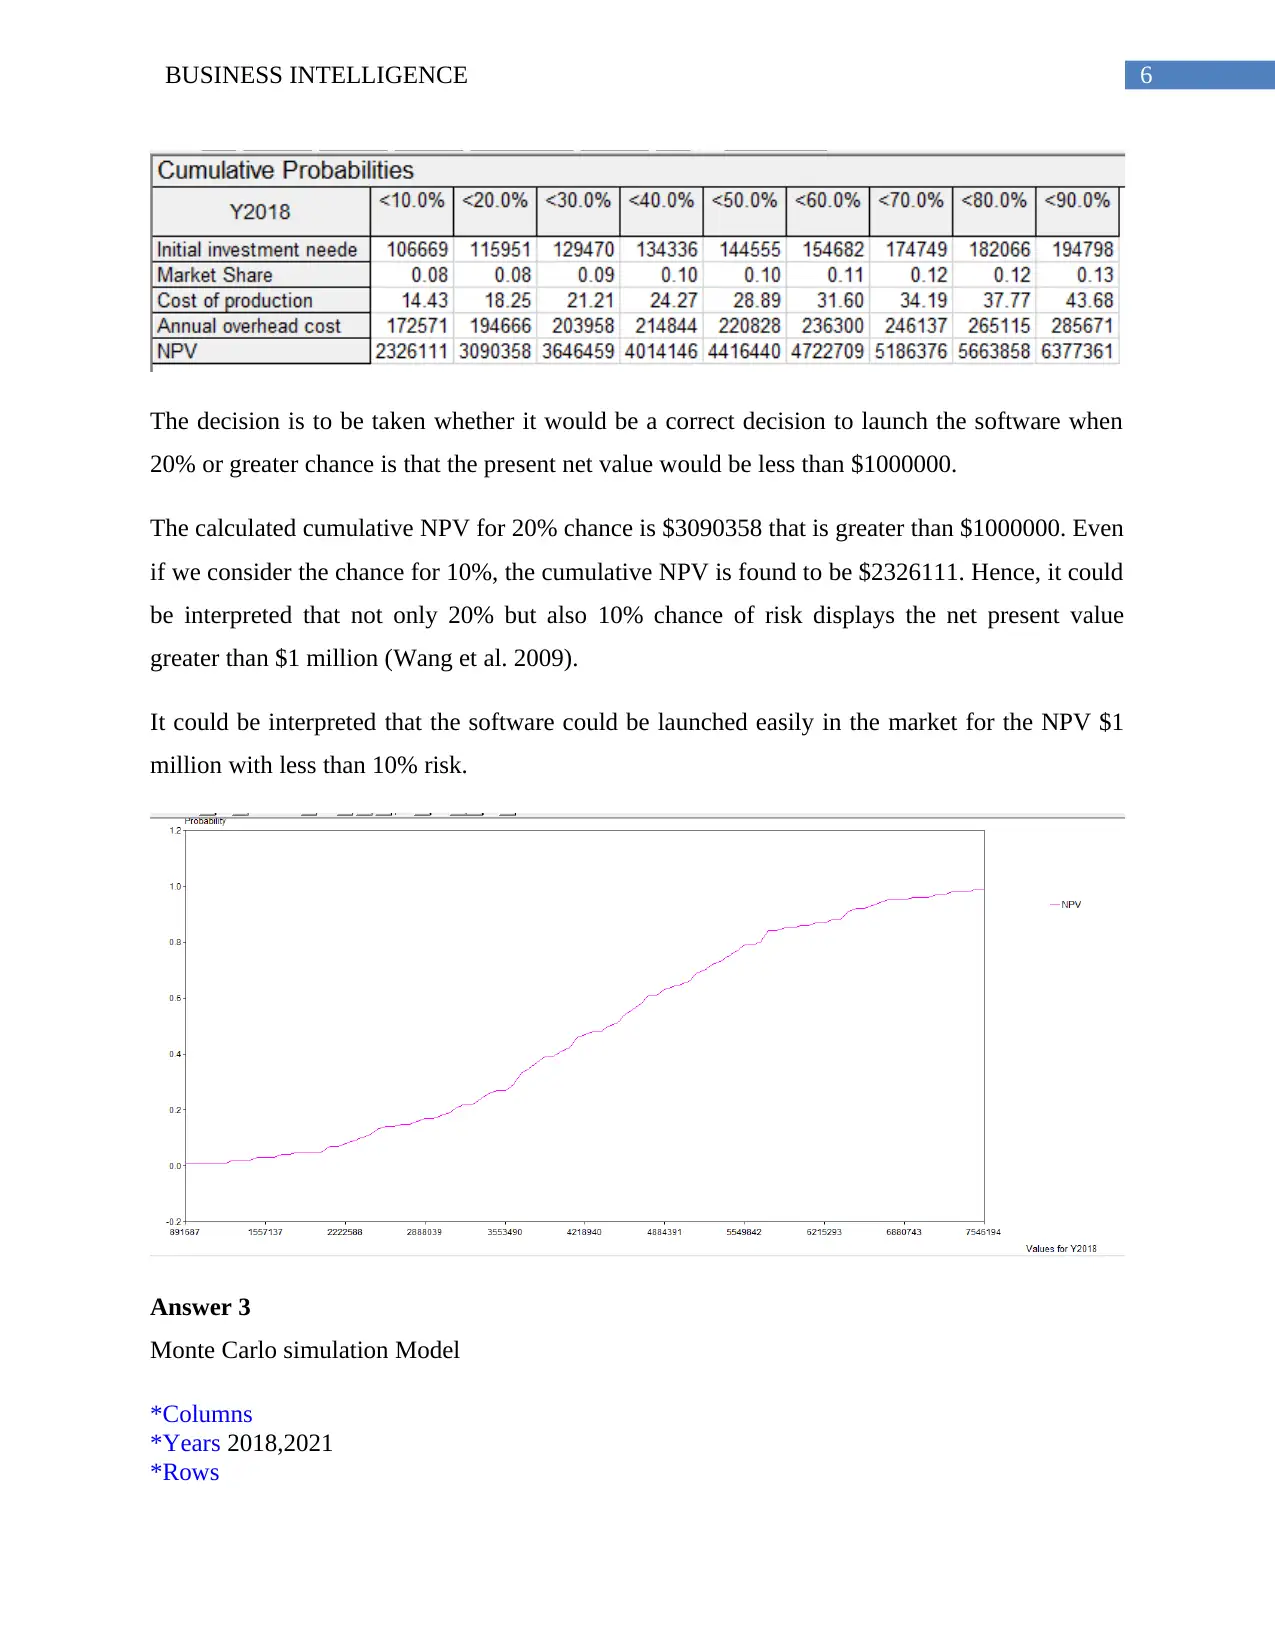
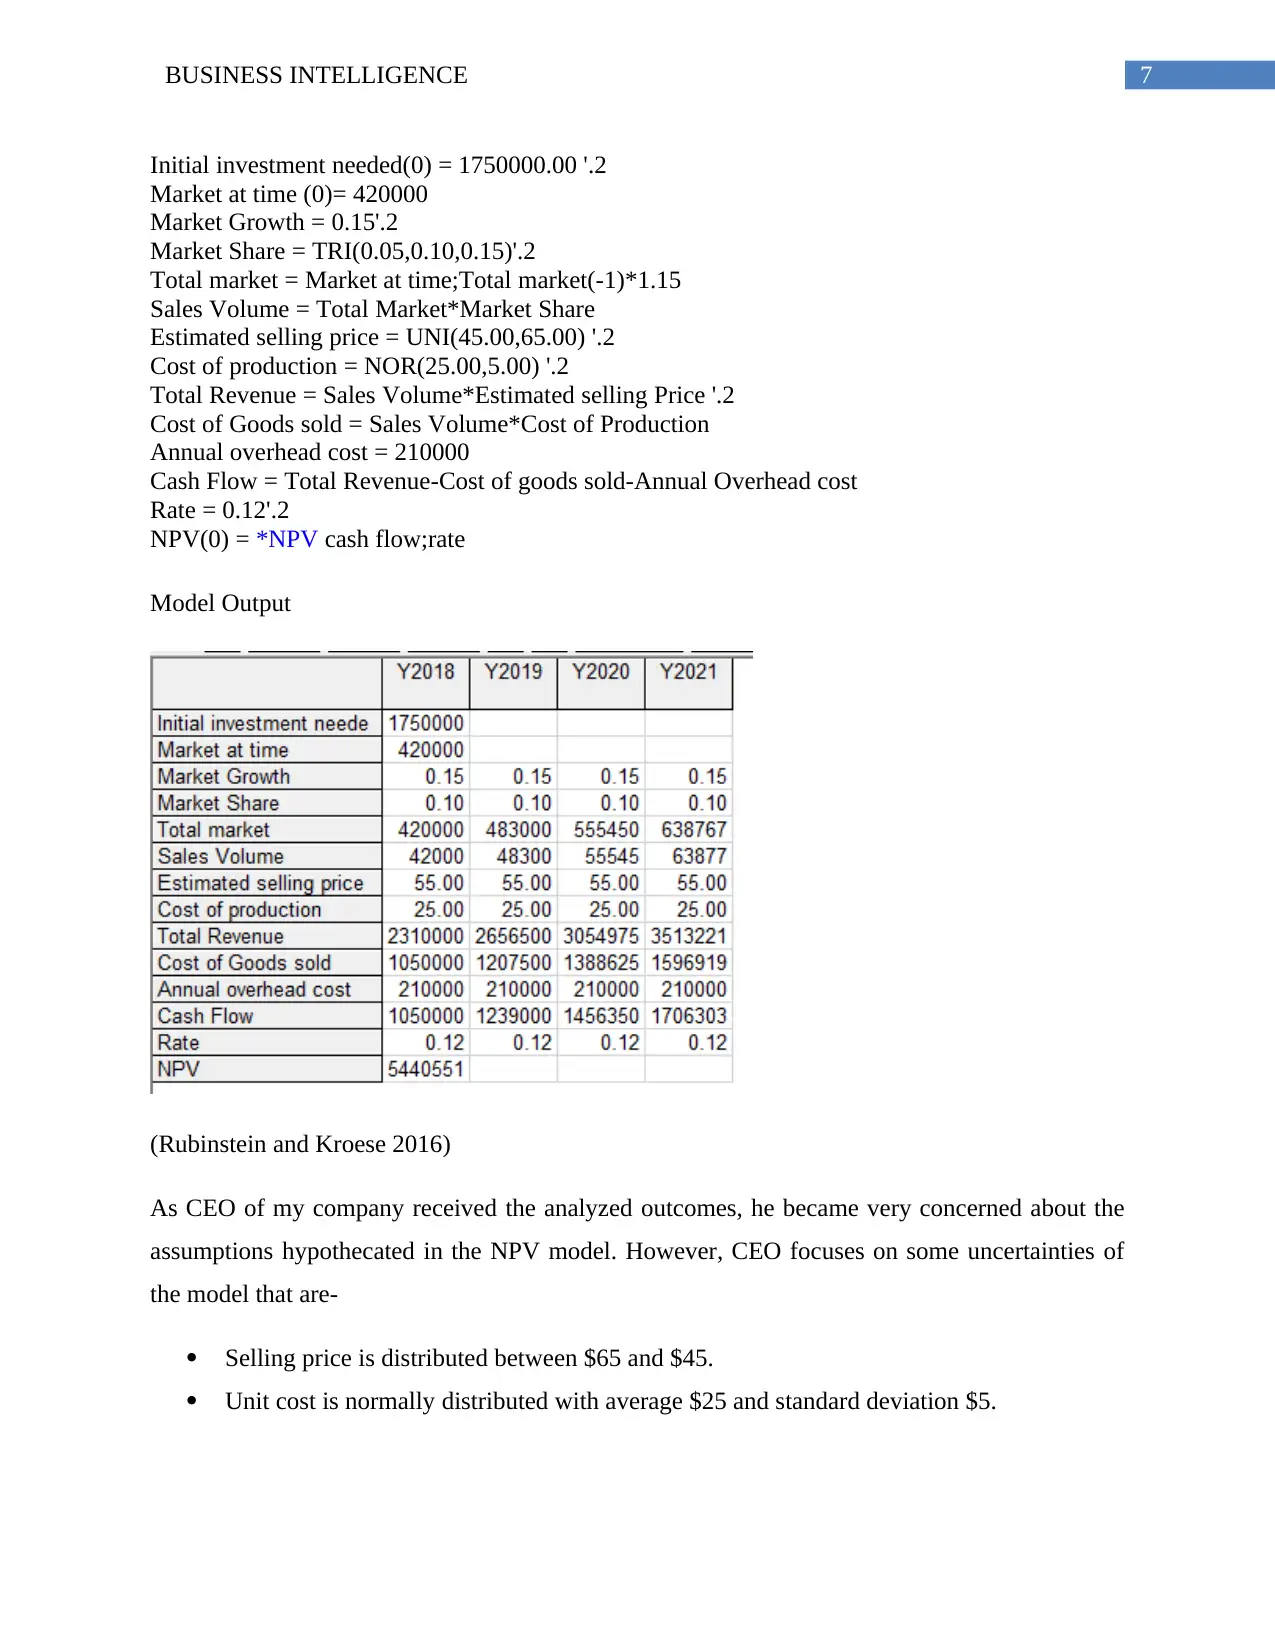
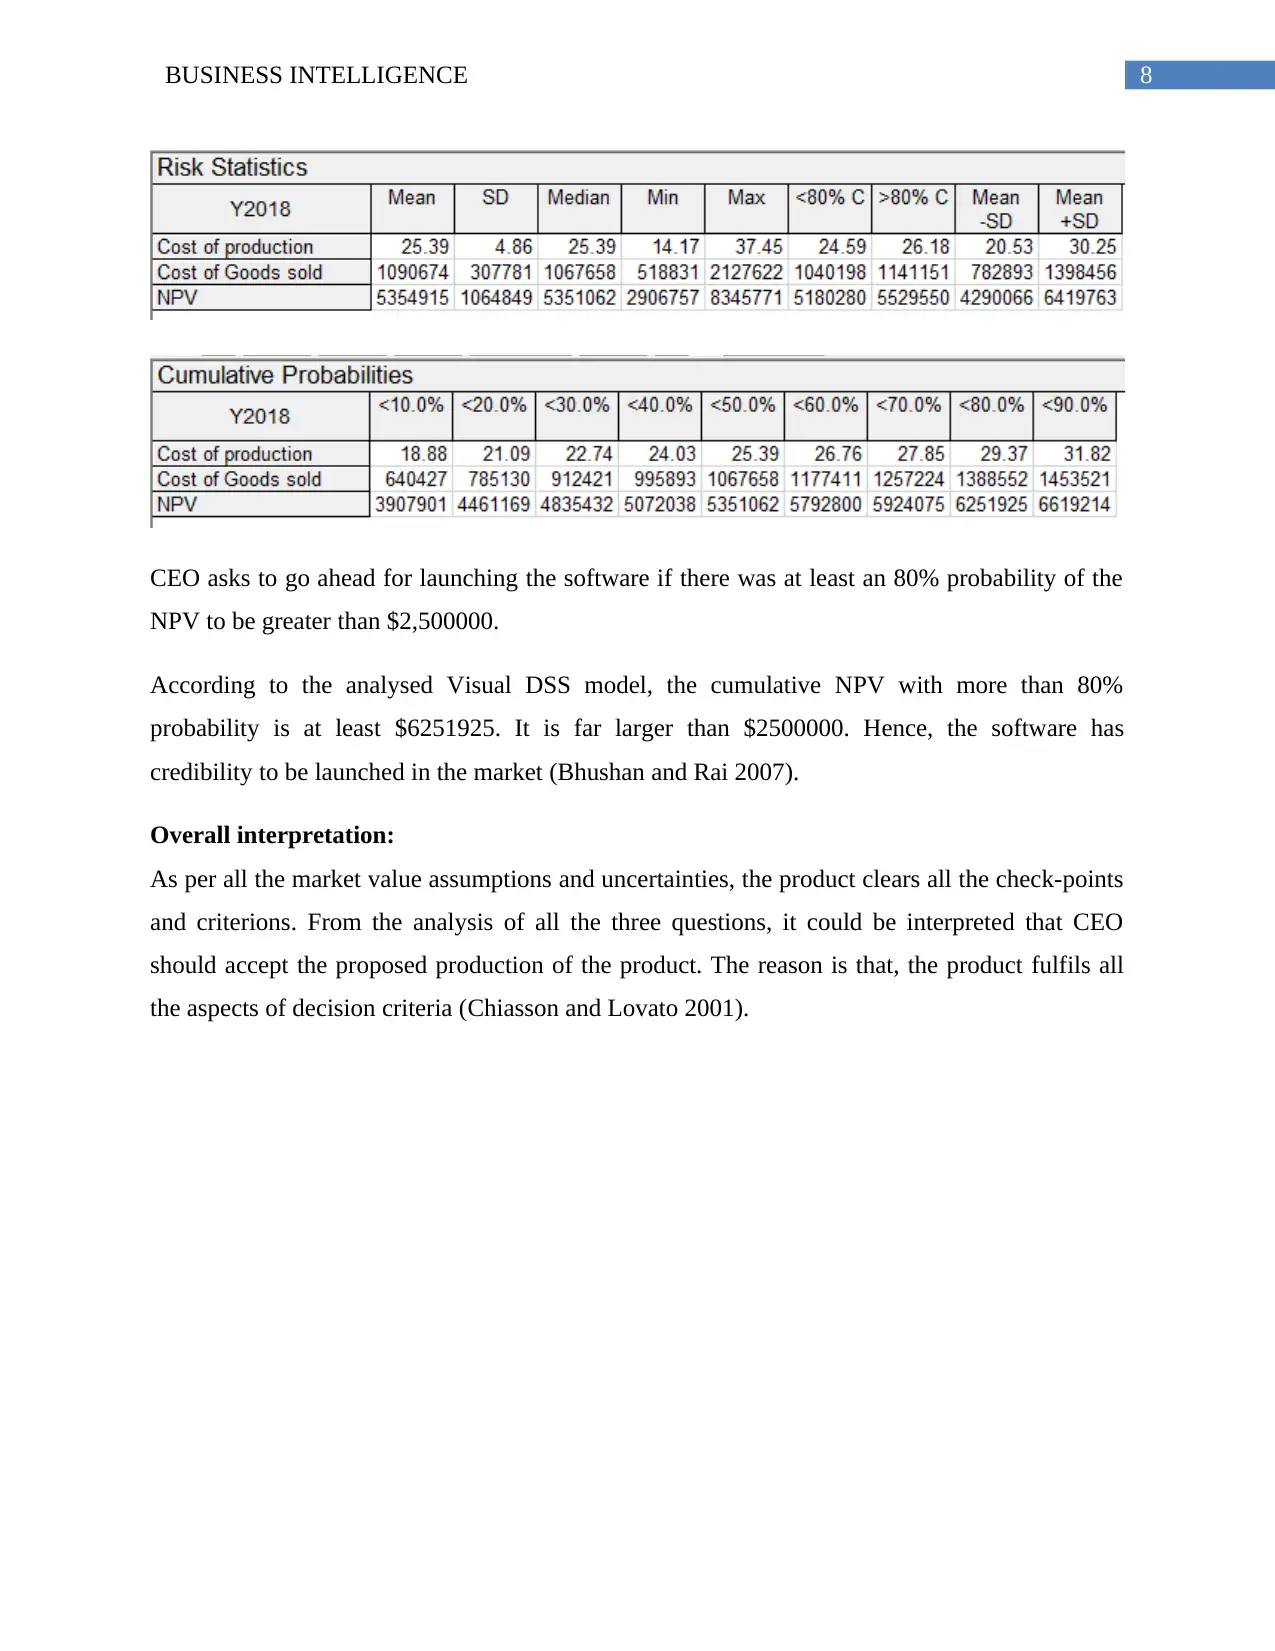
This report, prepared for Cloud-Pty Limited, a cloud-based software development organization, assesses the feasibility of launching a new responsive cloud-based software application. The report provides advice to senior management using Visual DSS software and Monte-Carlo simulation techniques. Part A presents three answers, evaluating the Net Present Value (NPV) of the software, incorporating market share, cost of production, overheads, and initial investment. The analysis reveals a positive NPV, suggesting the software's viability. Part B demonstrates data analysis using Power BI, showcasing sales data and funding allocation. Part C discusses the impact of smart, connected products on business intelligence and competition, highlighting their role in transforming industries by leveraging data analytics, redefining customer relationships, and building new technology infrastructures. The report concludes that the product fulfils all the decision criteria and should be launched.
Document Page
Running head: BUSINESS INTELLIGENCE
Business Intelligence
Name of Student:
Name of University:
Author’s Note:
tabler-icon-diamond-filled.svg

Paraphrase This Document

Need a fresh take? Get an instant paraphrase of this document with our AI Paraphraser
Document Page
1BUSINESS INTELLIGENCE
Table of Contents
Part A...............................................................................................................................................2
Answer 1......................................................................................................................................2
Answer 2......................................................................................................................................3
Answer 3......................................................................................................................................5
Overall interpretation:..................................................................................................................7
Part B...............................................................................................................................................8
Demonstration 1...........................................................................................................................8
Demonstration 2...........................................................................................................................9
Part C.............................................................................................................................................11
How Smart, Connected Products Are Transforming Competition................................................11
Introduction................................................................................................................................11
Discussion..................................................................................................................................12
Conclusion.................................................................................................................................13
References......................................................................................................................................15
Document Page
2BUSINESS INTELLIGENCE
Document Page
3BUSINESS INTELLIGENCE
Part A
Our company “Cloud-Pty Limited” is a cloud-based software development organization in
Brisbane, Australia. Our company is planning to launch new responsive cloud-based software
application in the market. Recently, dynamic and competitive approach has developed some bad
software decisions of investment. These days, senior manager need a prominent analysis of every
new product launched in the market. My task is to provide advice to the senior management on
the feasibility of the new product.
Visual DSS software and Monte-Carlo simulation technique is utilized for proper decision
making about launching the software.
Answer 1
NPV model
*Columns
*Years 2018,2021
*Rows
Initial investment needed(0) = 1750000.00 '.2
Market at time (0)= 420000
Market Growth = 0.15'.2
Market Share = TRI(0.05,0.10,0.15)'.2
Total market = Market at time;Total market(-1)*1.15
Sales Volume = Total Market*Market Share
Estimated selling price = 55.00 '.2
Cost of production = 25.00 '.2
Total Revenue = Sales Volume*Estimated selling Price '.2
Cost of Goods sold = Sales Volume*Cost of Production
Annual overhead cost = 210000
Cash Flow = Total Revenue-Cost of goods sold-Annual Overhead cost
Rate = 0.12'.2
NPV(0) = *NPV cash flow;rate
Model Output
tabler-icon-diamond-filled.svg

Paraphrase This Document

Need a fresh take? Get an instant paraphrase of this document with our AI Paraphraser
Document Page
4BUSINESS INTELLIGENCE
According to the decision support model developed using visual DSS, The NPV value is
calculated as $5440551. The summarized NPV is greater than $2 million. Therefore, my
manager would make a wise decision if he/she launches the software in the market now. The
decision of launching the software is correct.
Answer 2
Monte Carlo Simulation Model
*Columns
*Years 2018,2021
*Rows
Initial investment needed(0) = UNI(100000.00,200000.00) '.2
Market at time (0)= 420000
Market Growth = 0.15'.2
Market Share = TRI(0.05,0.10,0.15)'.2
Total market = Market at time;Total market(-1)*1.15
Sales Volume = Total Market*Market Share
Estimated selling price = 55.00 '.2
Cost of production = NOR(30.00,12.00) '.2
Total Revenue = Sales Volume*Estimated selling Price '.2
Cost of Goods sold = Sales Volume*Cost of Production
Annual overhead cost = TRI(150000,215000,350000)
Cash Flow = Total Revenue-Cost of goods sold-Annual Overhead cost
Rate = 0.12'.2
NPV(0) = *NPV cash flow;rate
Document Page
5BUSINESS INTELLIGENCE
Model Output
In case of risk-analysis, I am asked to analyze the impact of variation in the market share, cost of
producing, overheads and initial investment on the NPV.
Market share is most likely to be 10% ranging between 5% to 15%.
Unit cost follows normal distribution with mean $30 and standard deviation $12.
Overhead cost could be in the interval of $15000 and $35000. However, it is most likely
to be $215000 per year.
Initial investment requirement is uniformly distributed from $1000000 to $2000000.
Cumulative probabilities report
Document Page
6BUSINESS INTELLIGENCE
The decision is to be taken whether it would be a correct decision to launch the software when
20% or greater chance is that the present net value would be less than $1000000.
The calculated cumulative NPV for 20% chance is $3090358 that is greater than $1000000. Even
if we consider the chance for 10%, the cumulative NPV is found to be $2326111. Hence, it could
be interpreted that not only 20% but also 10% chance of risk displays the net present value
greater than $1 million (Wang et al. 2009).
It could be interpreted that the software could be launched easily in the market for the NPV $1
million with less than 10% risk.
Answer 3
Monte Carlo simulation Model
*Columns
*Years 2018,2021
*Rows
tabler-icon-diamond-filled.svg

Paraphrase This Document

Need a fresh take? Get an instant paraphrase of this document with our AI Paraphraser
Document Page
7BUSINESS INTELLIGENCE
Initial investment needed(0) = 1750000.00 '.2
Market at time (0)= 420000
Market Growth = 0.15'.2
Market Share = TRI(0.05,0.10,0.15)'.2
Total market = Market at time;Total market(-1)*1.15
Sales Volume = Total Market*Market Share
Estimated selling price = UNI(45.00,65.00) '.2
Cost of production = NOR(25.00,5.00) '.2
Total Revenue = Sales Volume*Estimated selling Price '.2
Cost of Goods sold = Sales Volume*Cost of Production
Annual overhead cost = 210000
Cash Flow = Total Revenue-Cost of goods sold-Annual Overhead cost
Rate = 0.12'.2
NPV(0) = *NPV cash flow;rate
Model Output
(Rubinstein and Kroese 2016)
As CEO of my company received the analyzed outcomes, he became very concerned about the
assumptions hypothecated in the NPV model. However, CEO focuses on some uncertainties of
the model that are-
Selling price is distributed between $65 and $45.
Unit cost is normally distributed with average $25 and standard deviation $5.
Document Page
8BUSINESS INTELLIGENCE
CEO asks to go ahead for launching the software if there was at least an 80% probability of the
NPV to be greater than $2,500000.
According to the analysed Visual DSS model, the cumulative NPV with more than 80%
probability is at least $6251925. It is far larger than $2500000. Hence, the software has
credibility to be launched in the market (Bhushan and Rai 2007).
Overall interpretation:
As per all the market value assumptions and uncertainties, the product clears all the check-points
and criterions. From the analysis of all the three questions, it could be interpreted that CEO
should accept the proposed production of the product. The reason is that, the product fulfils all
the aspects of decision criteria (Chiasson and Lovato 2001).
Document Page
9BUSINESS INTELLIGENCE
Part B
Demonstration 1
Figure 1: Complete Car sales
The above figure presents the car sales data. The analysis is based on different models.
From the analysis it is found that the highest car sales is from United Kingdom. The total car
sales is of 73139.53. the total car sales is the average of the last four years. The lower left hand
figure shows the delivery charge of based on models. Various models of cars are being
considered. From the analysis it can be said that there are variations in delivery charges for
different models. The total volume of sales of spare parts is 495K. The top right hand figure
presents the variations in labour costs by country. There are differences in labour costs across
countries. From the figure it can be seen that the highest labour cost is for United Kingdom.
tabler-icon-diamond-filled.svg

Paraphrase This Document

Need a fresh take? Get an instant paraphrase of this document with our AI Paraphraser
Document Page
10BUSINESS INTELLIGENCE
On selection of model DB9 it is found that the total spare parts sold in the last 4 years if
44K. For the model DB9 the maximum salesprice (sum) has been from United States. The sum
salesprice is 3609410. The total sum salesprice is 5423960.
In this analysis we analysed the car sales data. The data contained information on the
sales of different models of cars, there spare parts. The distribution of the data is across different
countries, and years. In the first model of analysis that was built the analysis considered the
complete data. The analysis considered the sum of the sales price for the years of the available
data. In the second model, the data for DB9 model was only selected. Power BI was able to
reduce the adjoining charts to model DB9 only. Thus in the second model the labour charge,
number of spare parts sold for model DB9 only is easily visualised. In addition, the total sales
price for model DB9 is also derived. Hence, Power BI was easily able to filter data according to
the requirement. In a business environment it is essential to have information as segregated as
possible. This can provide information on the performance of different models. Thus if the
organization would want to launch a new product then with the information available they can
get prior information about the performance of the product.
Demonstration 2
Document Page
11BUSINESS INTELLIGENCE
The sectors which receive research fellowship funding are agriculture, forest and
fisheries, arts and recreational services, Electricity, gas and waste water services. The total
funding committed for research fellowships is 9300000.
chevron_up_icon
1 out of 18
circle_padding
hide_on_mobile
zoom_out_icon
[object Object]