Business Intelligence Report: Data Mining, AI, and Weka Analysis

Verified

Added on  2021/06/18

|20
|3036
|86
Report
AI Summary
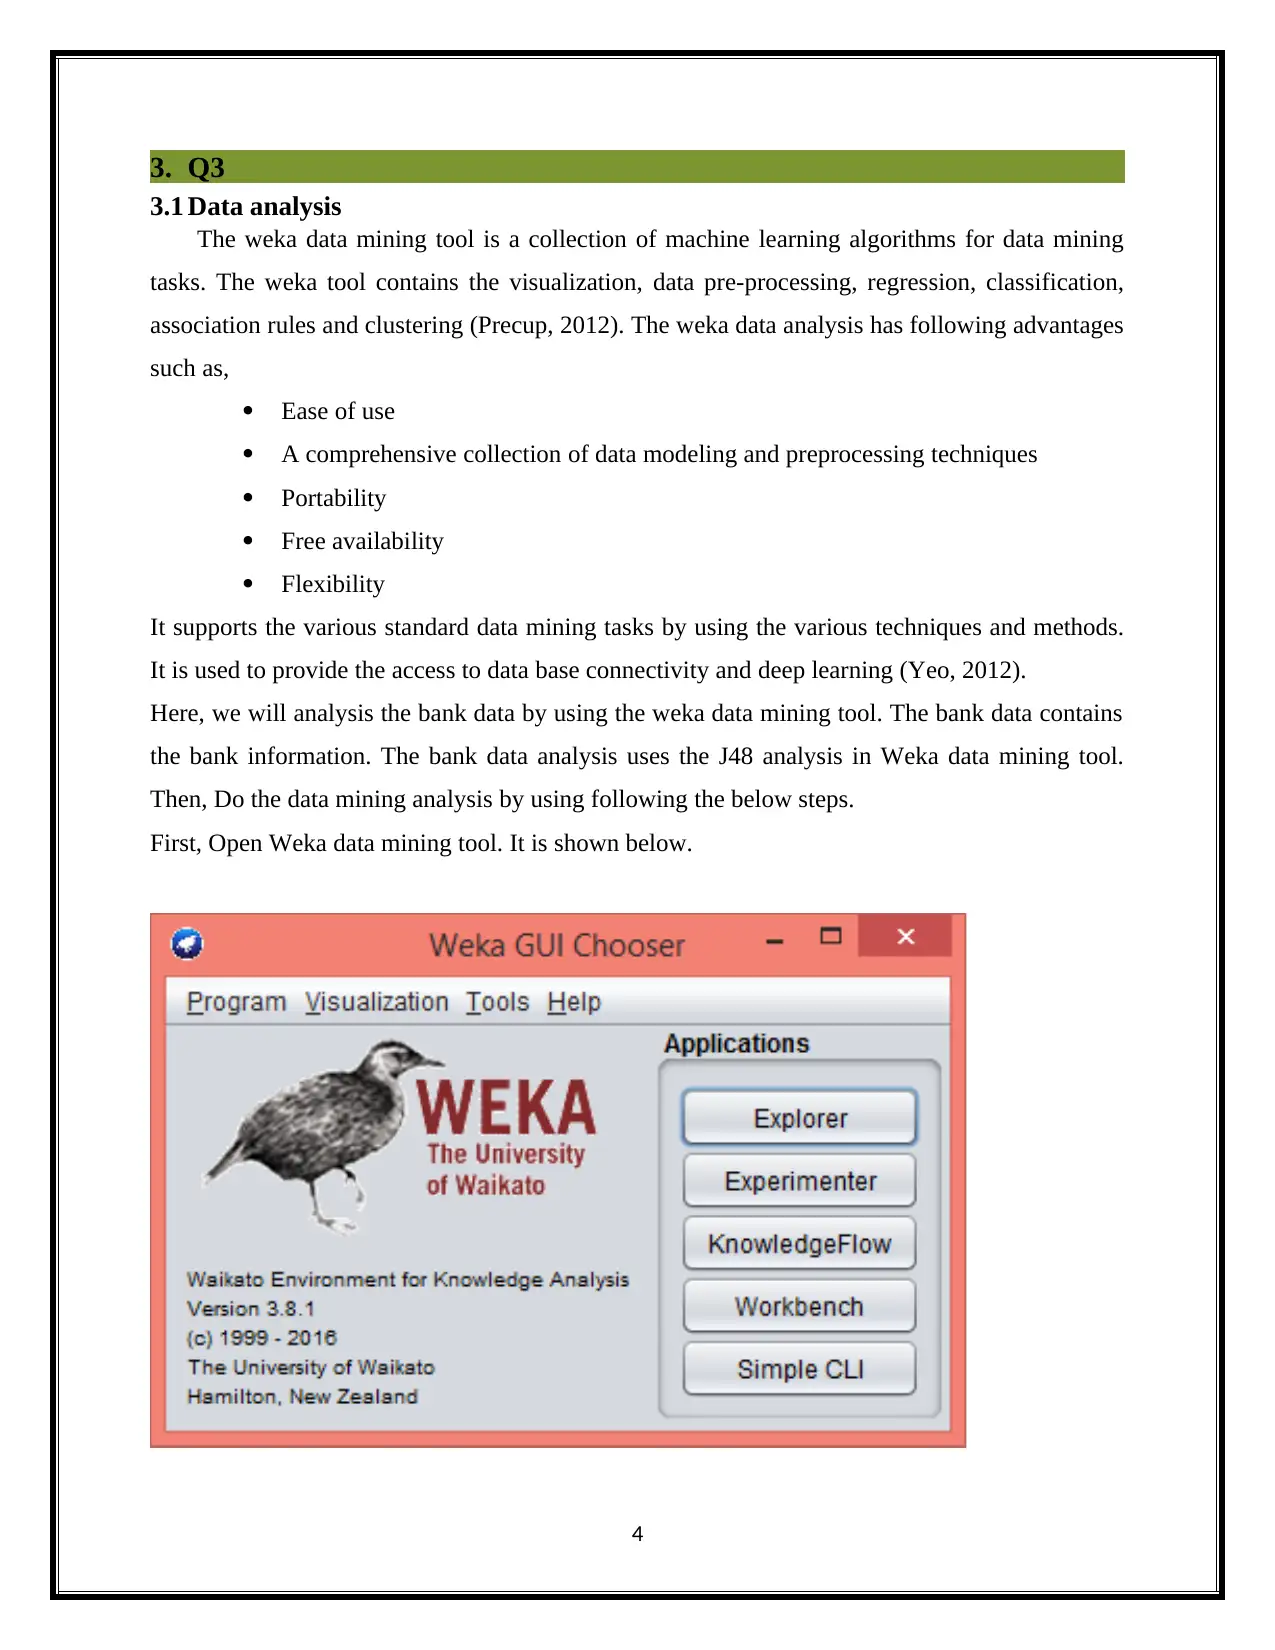
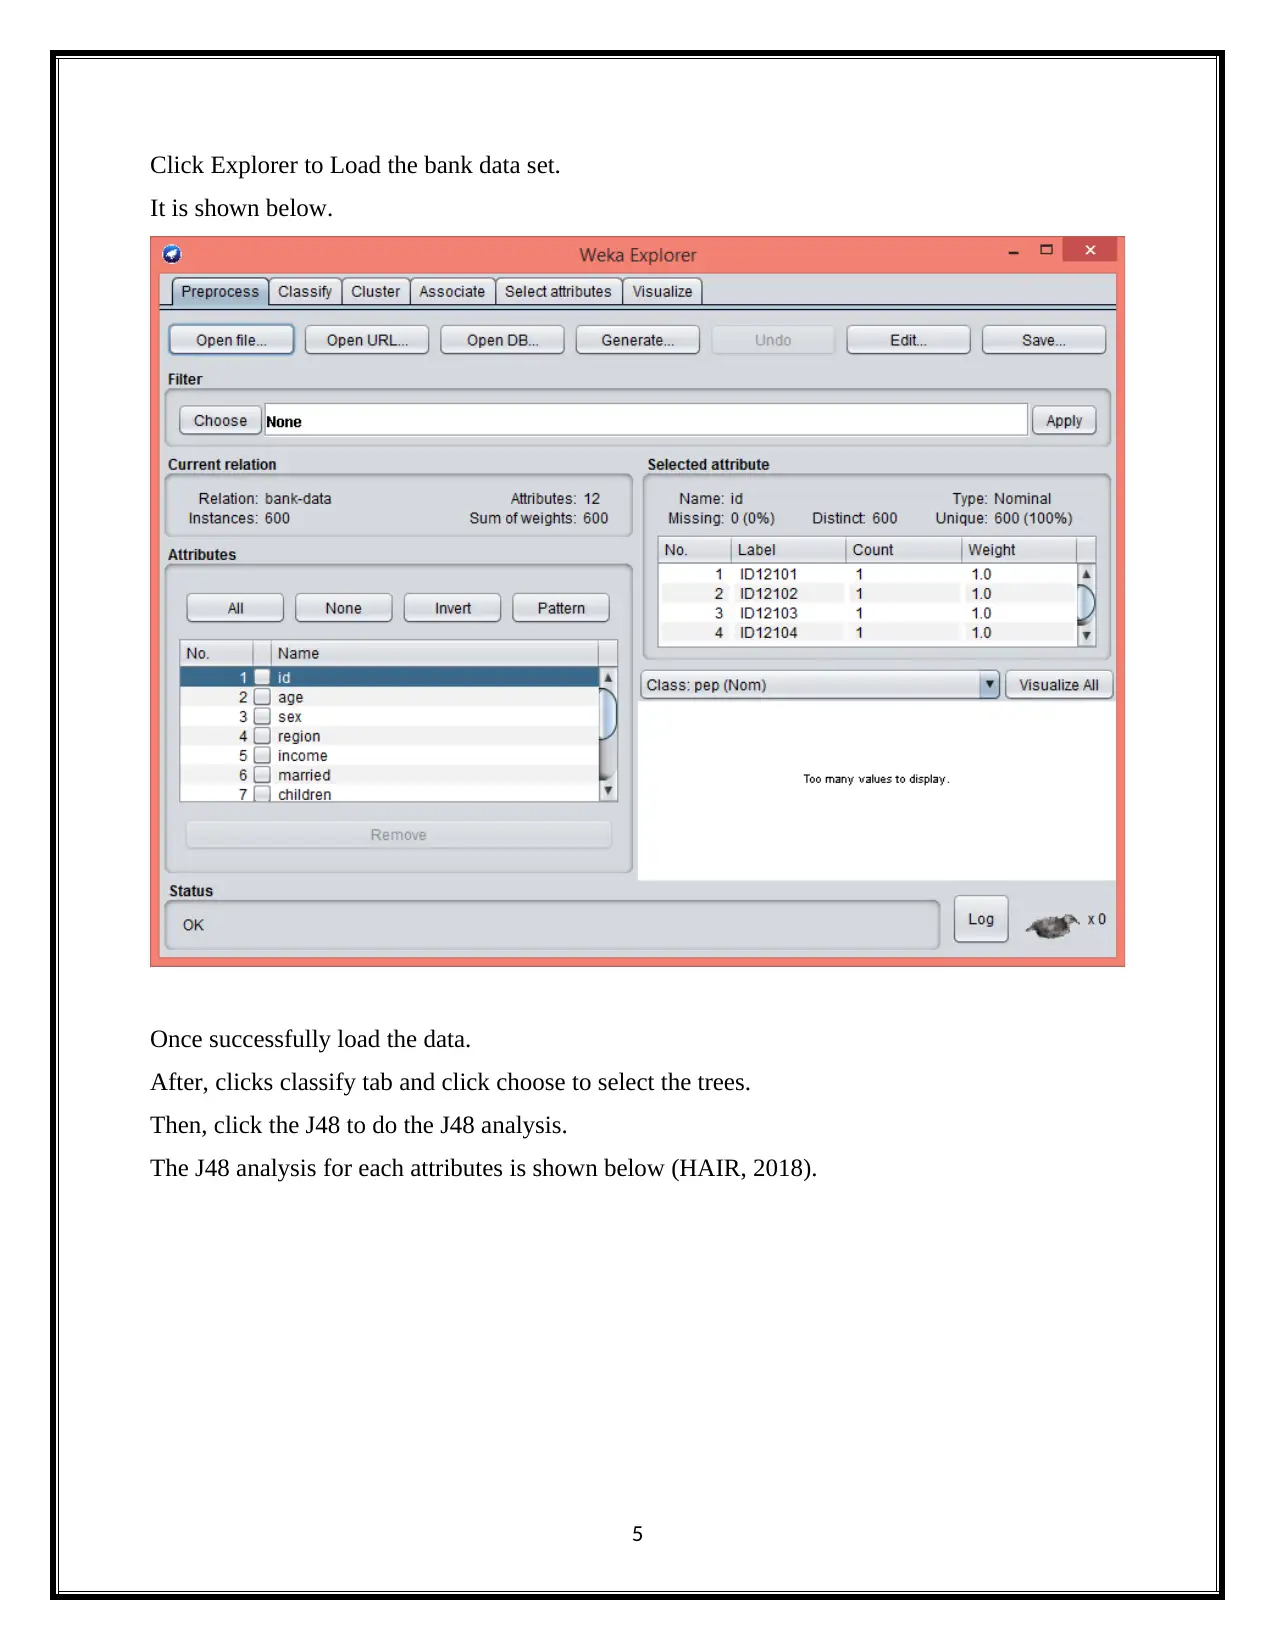
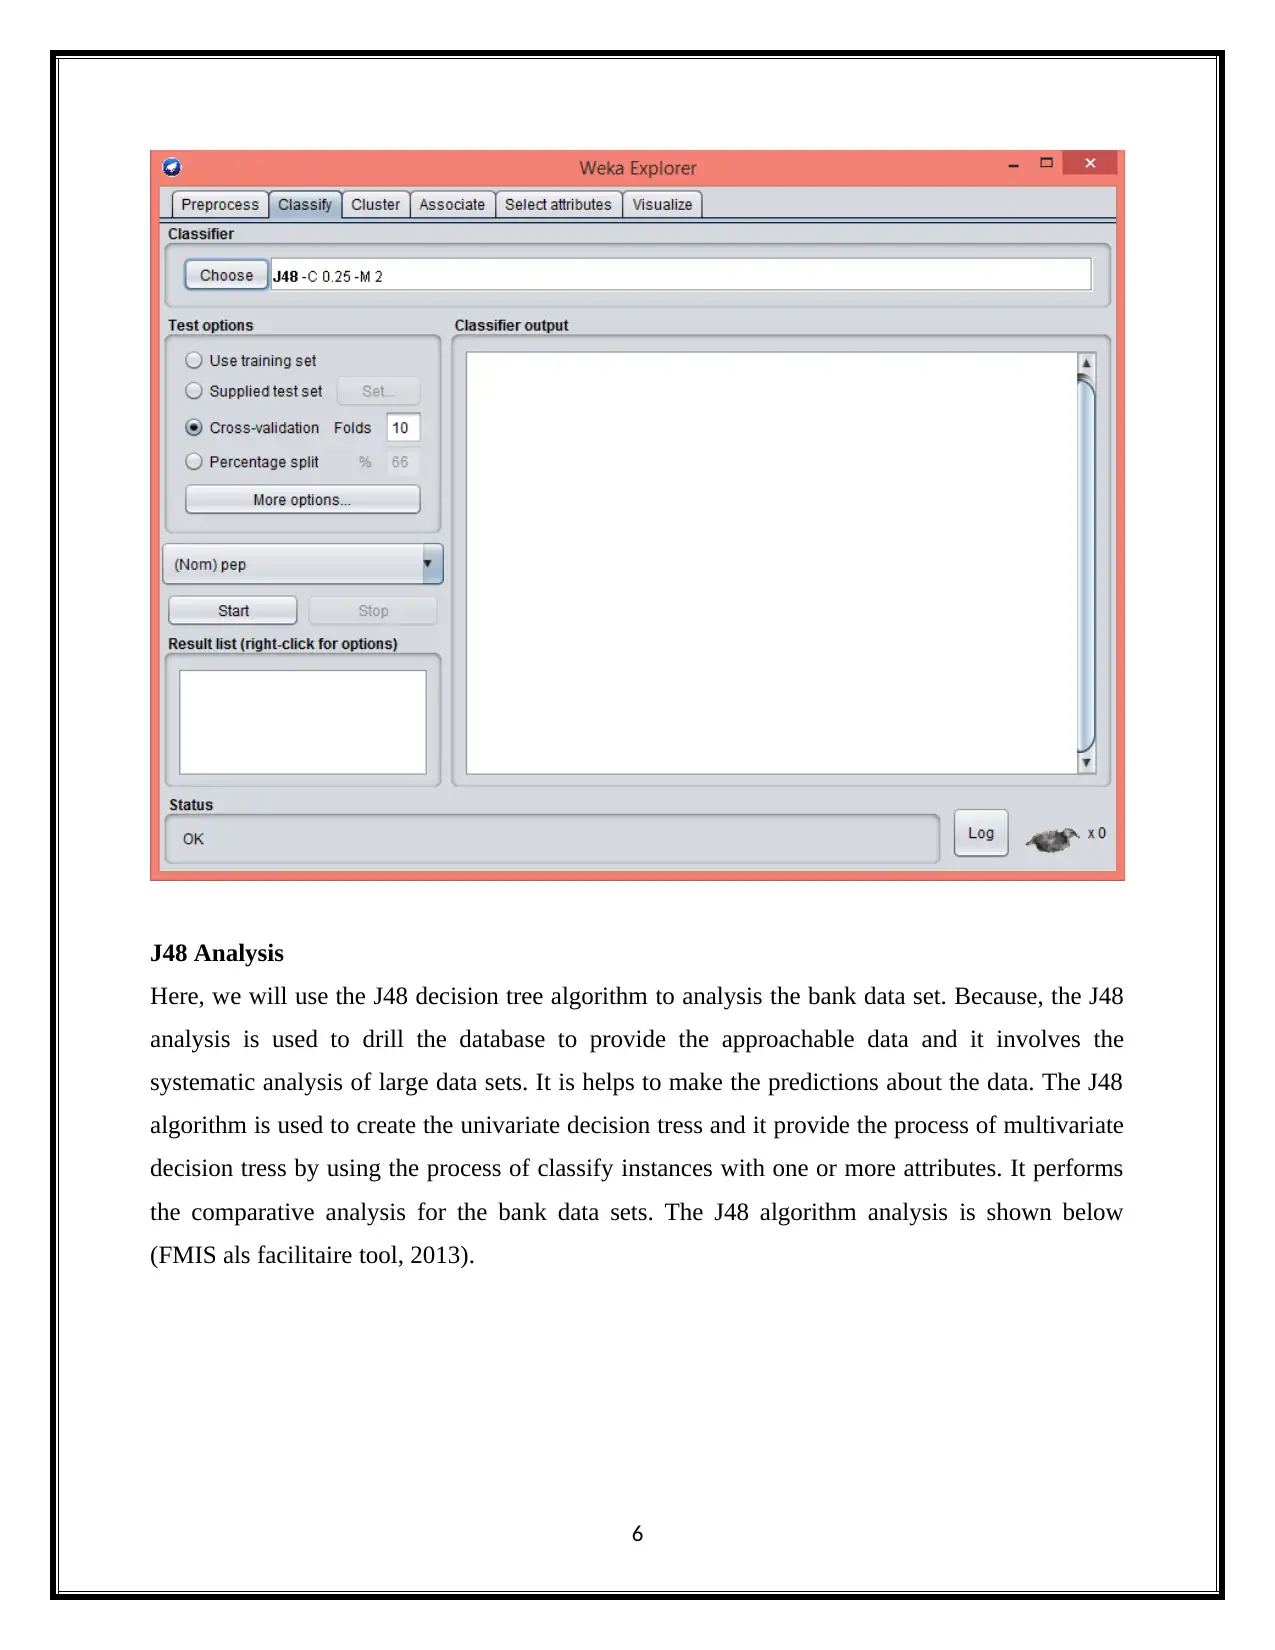
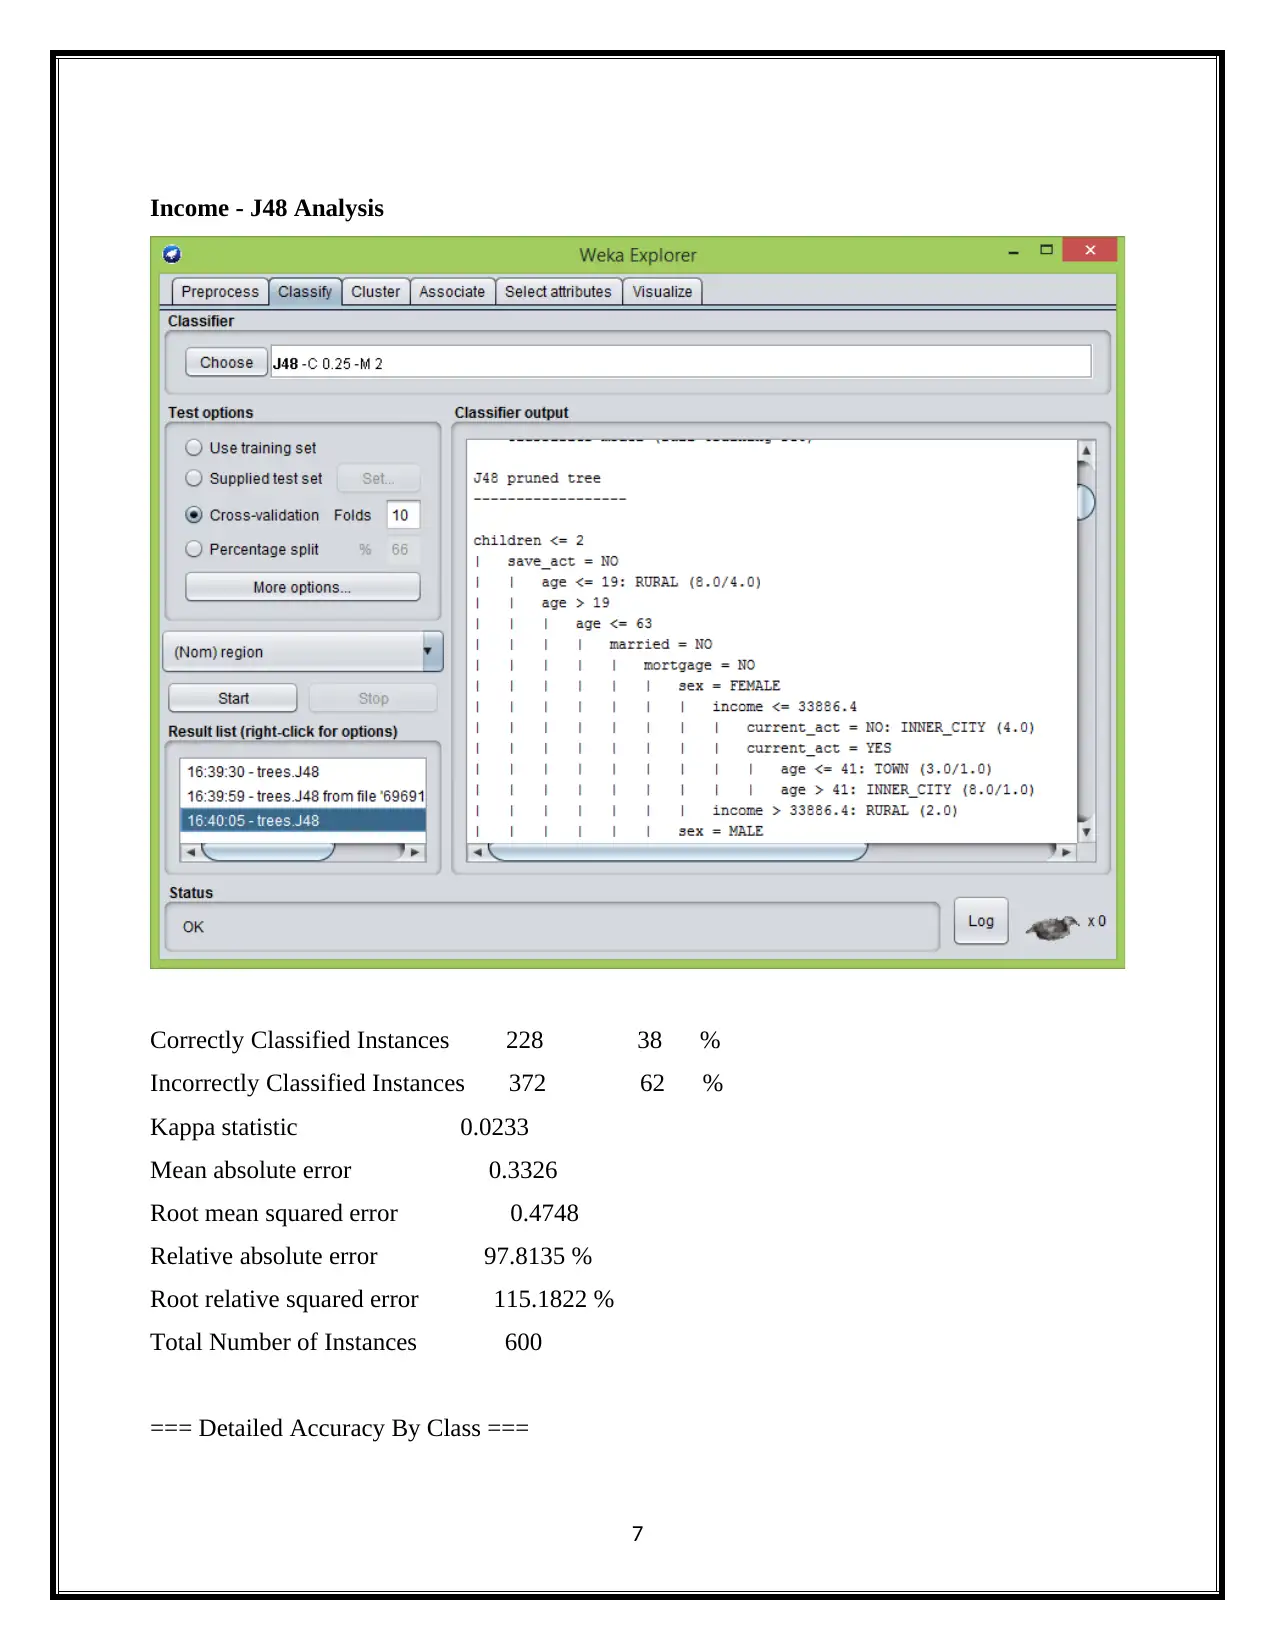
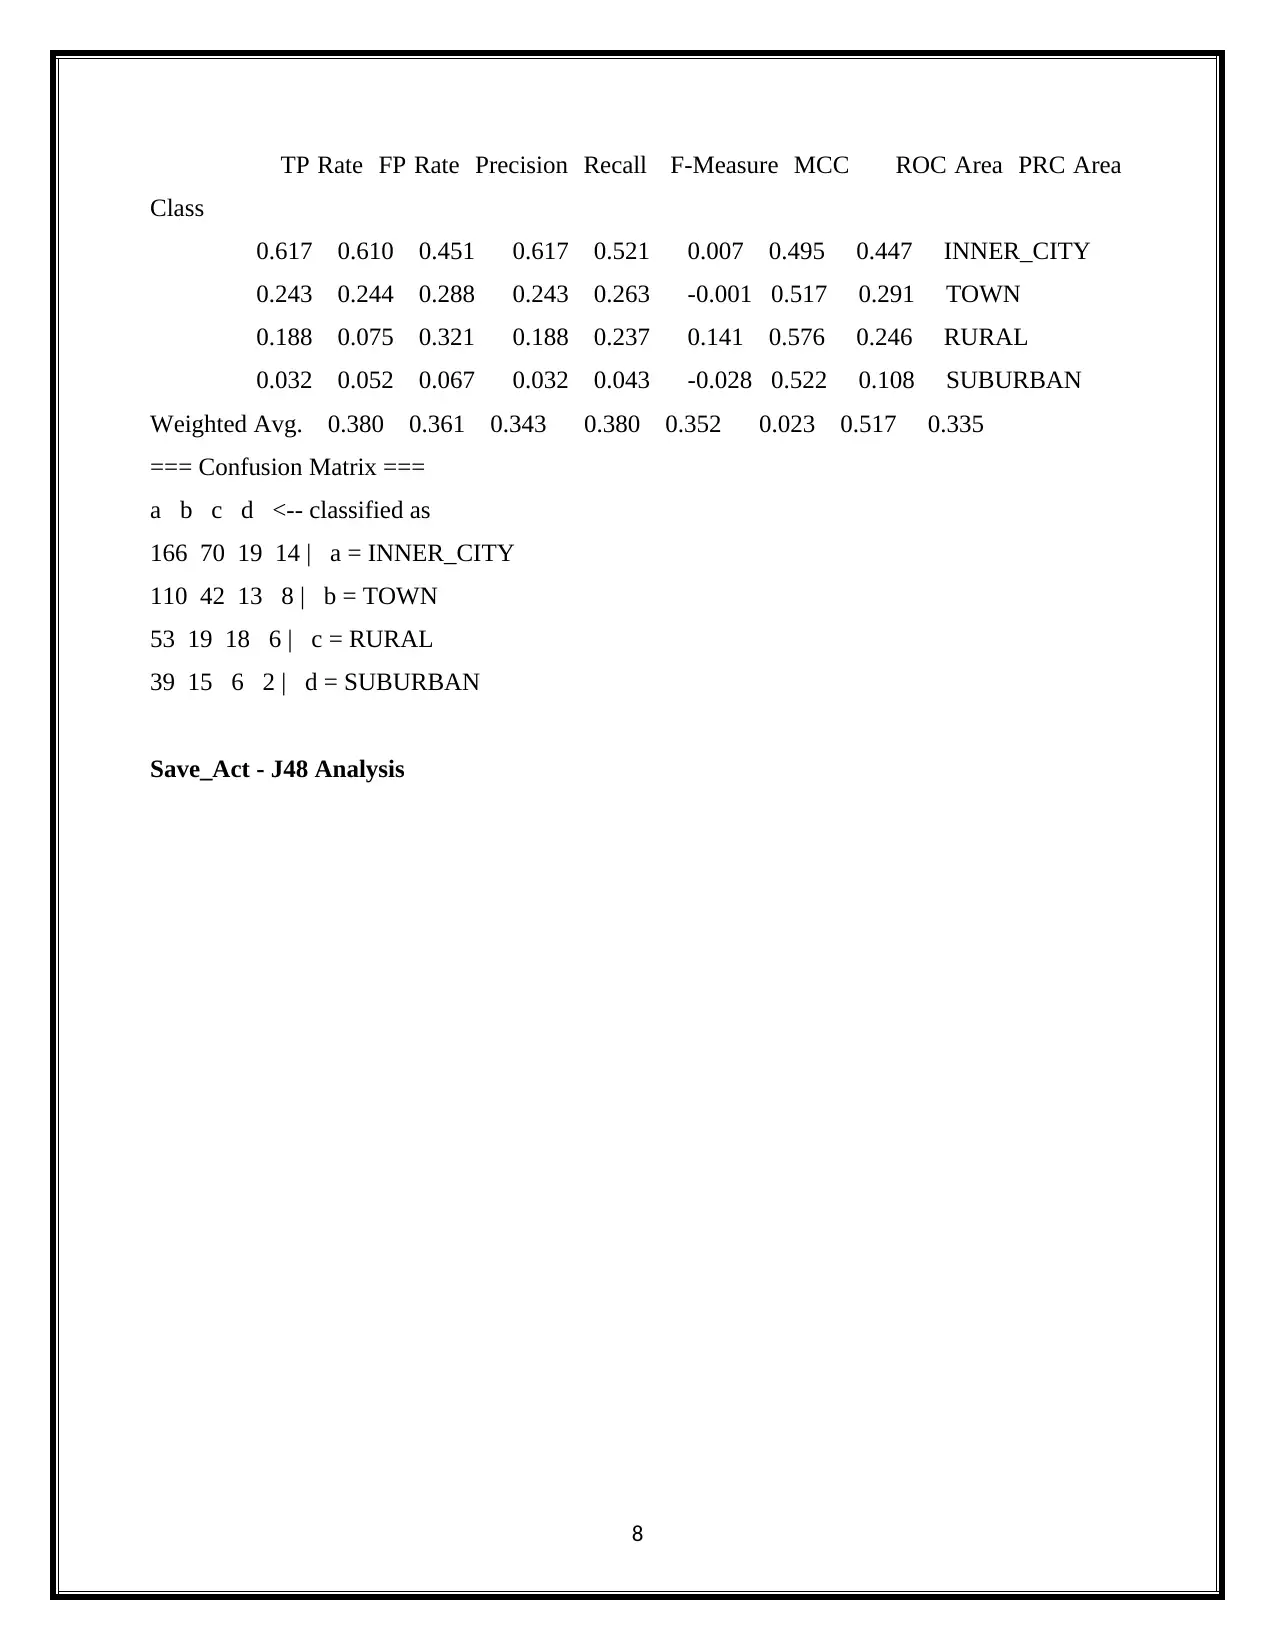
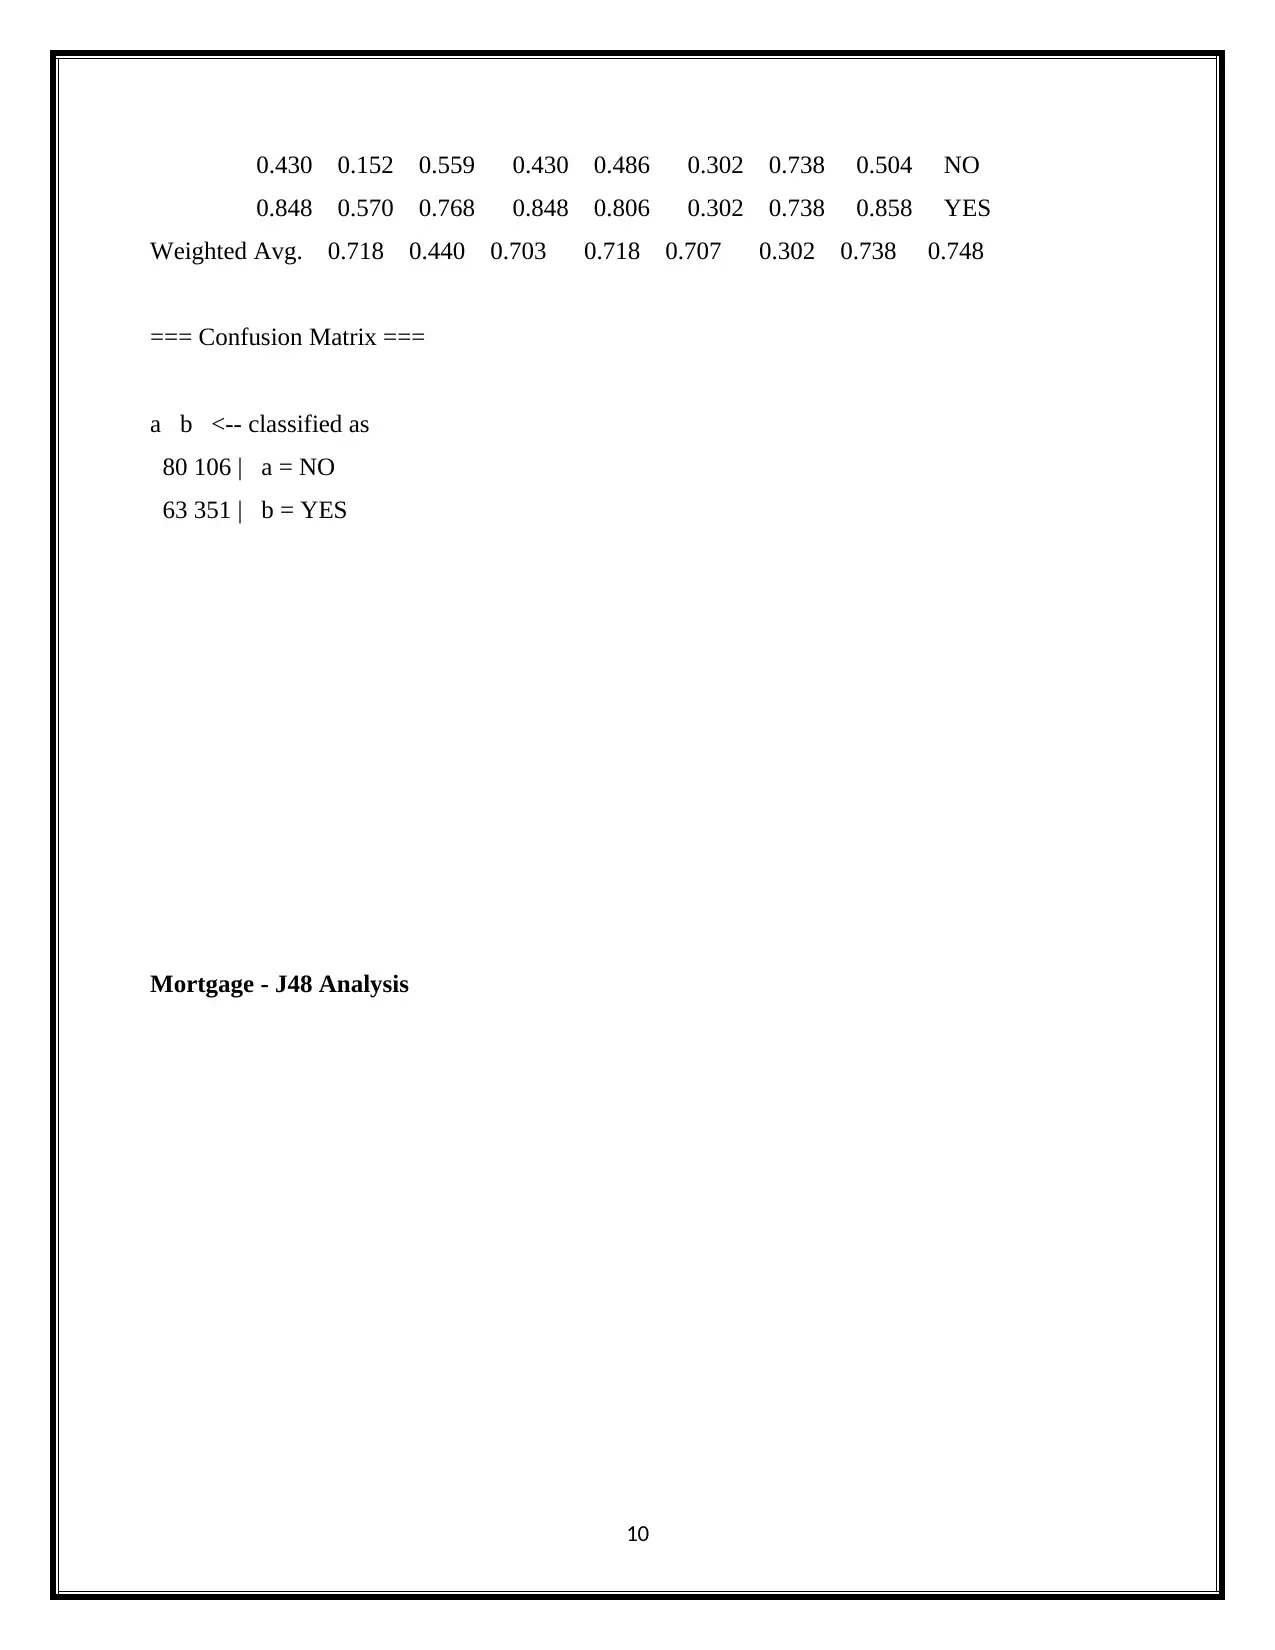
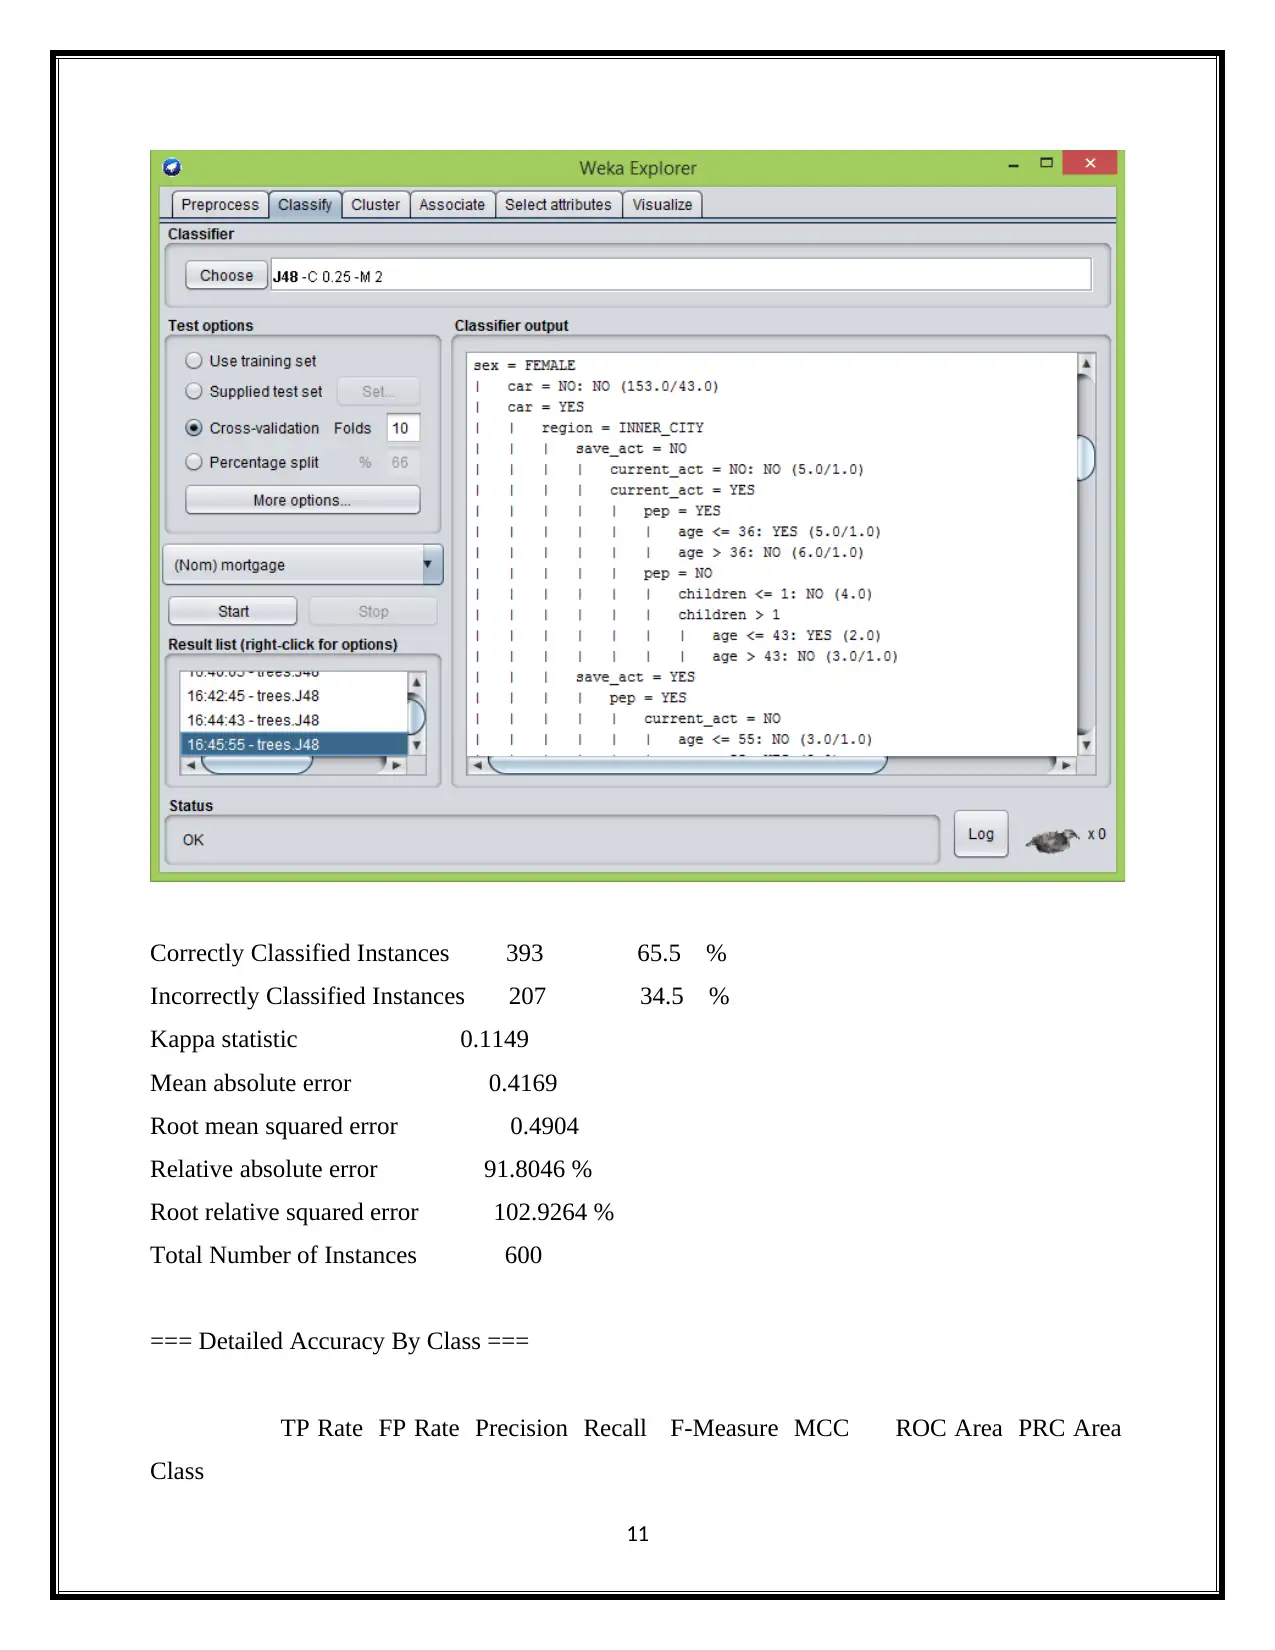
This report delves into the realm of business intelligence, commencing with a comprehensive definition of text mining and text analytics, highlighting their role in extracting valuable insights from unstructured data. It then differentiates text mining from data mining, elucidating their distinct methodologies and applications. The report further explores the application of Artificial Intelligence (AI) in business transformation, emphasizing its capacity to automate tasks, enhance existing systems, and drive data-driven decision-making. A significant portion of the report is dedicated to data analysis, utilizing the Weka data mining tool and the J48 algorithm to analyze bank data, including attributes like income, savings, current accounts, mortgage, and sex. The analysis provides detailed insights into these attributes, supported by the J48 algorithm's classification results, confusion matrices, and accuracy metrics. Finally, the report touches upon the importance of dashboards in visualizing and interpreting the analyzed data, providing a holistic overview of business intelligence concepts and techniques. The report provides a detailed overview of the data analysis process, including data pre-processing, model selection, and evaluation, with specific attention to the J48 decision tree algorithm and its application to the bank data.
Document Page
Business Intelligence
tabler-icon-diamond-filled.svg

Secure Best Marks with AI Grader

Need help grading? Try our AI Grader for instant feedback on your assignments.
Document Page
1. Q1
Definition of Text Mining
Text Analytics, generally called text mining, is the path toward taking a gander at
enormous collections of made resources for make new data, and to change the unstructured text
into sorted out data for use in energize examination (Tuffery, 2013). Text mining recognizes
substances, associations and statements that would somehow remain shrouded in the mass of
printed enormous data. These are evacuated and changed into sorted out data, for examination,
portrayal (e.g. through html tables, mind maps, charts), joining with sorted out data in databases
or conveyance focuses, and promote refinement using machine learning (ML) structures.
Distinction between Text mining and Data Mining
Data mining is fixated on data subordinate activities, for instance, accounting,
purchasing, creation system, CRM, et cetera. The required data is definitely not hard to get to
and homogeneous. At the point when assuming are described, the course of action can be quickly
passed on. The multifaceted idea of the data arranged make text mining wanders longer to pass
on. Text mining checks a couple go-between semantic periods of examination before it can
enhance text (vernacular theorizing, tokenization, division, morpho-syntactic examination,
disambiguation, cross-references, et cetera). Next, huge terms extraction and metadata
connection steps handle sorting out the unstructured substance to help territory specific
applications. Furthermore, errands may incorporate some heterogeneous lingos, associations or
spaces. Finally, couple of associations have their own logical classification (Carter, Dee and
Zuckman, 2014). In any case, this is necessary for starting a text mining endeavor and it can take
several months to be made
Techniques used in Text Mining
ï‚· Sentiment investigation apparatus
ï‚· Topic displaying method
Applications
ï‚· Distributing and media.
ï‚· Broadcast interchanges, essentialness and diverse organizations wanders.
ï‚· Data advancement part and Internet.
ï‚· Banks, assurance and fiscal markets.
1
Document Page
ï‚· Political establishments, political specialists, open association and definitive files.
ï‚· Pharmaceutical and research organizations and human administrations.
ï‚· Not at all like these headways, a mental development, for instance, Cogito is planned
to appreciate and dismember content not by hypothesizing the essentialness of
words, but instead by relying upon a significant semantic examination and a rich
information graph to ensure a correct, complete and additionally convincing
perception of content as a man would.
2. Q2
The reason to choose AI
AI automates tedious learning and disclosure through data. Regardless, AI isn't exactly
the same as hardware driven, mechanical robotization. As opposed to robotizing manual errands,
AI performs visit, high-volume, electronic endeavors constantly and without shortcoming. For
this kind of computerization, human demand is so far major to set up the structure and ask the
right request.
AI adds learning to existing things. A great part of the time, AI won't be sold as an
individual application. Or on the other hand perhaps, things you starting at now use will be
upgraded with AI limits, much like Siri was added as a component to another period of Apple
things Buttle, F. (2015). Customer Relationship Management. Taylor and Francis..
Robotization, conversational stages, bots and splendid machines can be joined with a ton
of data to improve various advances at home and in the workplace, from security learning to
hypothesis examination.
AI changes through powerful learning counts to allow the data to do the programming.
AI finds structure and regularities in data with the objective that the count gets a fitness: The
computation transforms into a classifier or a predicator. Along these lines, correspondingly as the
estimation can demonstrate to itself industry standards to play chess, it can demonstrate to itself
what thing to recommend next on the web. Additionally, the models modify when given new
data. Back expansion is an AI framework that empowers the model to change, through planning
and included data, when the principle answer isn't precisely right (Blokdijk, 2012).
AI in Small business transformation
AI changes organizations
2
Document Page
ï‚· proposals and substance curation
ï‚· personalization of news maintains
ï‚· example and picture affirmation
ï‚· dialect affirmation - to process unstructured data from customers and arrangements
prospects
ï‚· promotion concentrating on and streamlined, continuous advertising
ï‚· information examination and customer division
ï‚· social semantics and feeling examination
ï‚· robotized site structure
ï‚· prescient customer advantage
These are only a segment of the instances of AI uses as a piece of business. With the pace
of progression growing, there will presumably be significantly more to come within the near
future (Raab and Resko, 2016).
Limitations
With the snappy change of AI, different good issues have jumped up. These include:
ï‚· the capacity of computerization advancement to offer rising to work setbacks
ï‚· the need to redeploy or retrain delegates to keep them in occupations
ï‚· reasonable scattering of wealth made by machines
ï‚· the effect of machine relationship on human lead and thought
ï‚· the need to discard slant in AI that is made by individuals
ï‚· the security of AI structures (eg independent weapons) that can possibly cause
hurt
ï‚· the need to alleviate against unintended results, as sagacious machines are thought
to learn and develop self-sufficiently
While these risks can't be slighted, it justifies recollecting that advances in AI can - for
the most part - improve business and better lives for everyone. In case realized proficiently,
modernized thinking has enormous and accommodating potential (Luo, 2012).
3
tabler-icon-diamond-filled.svg

Secure Best Marks with AI Grader

Need help grading? Try our AI Grader for instant feedback on your assignments.
Document Page
3. Q3
3.1 Data analysis
The weka data mining tool is a collection of machine learning algorithms for data mining
tasks. The weka tool contains the visualization, data pre-processing, regression, classification,
association rules and clustering (Precup, 2012). The weka data analysis has following advantages
such as,
ï‚· Ease of use
ï‚· A comprehensive collection of data modeling and preprocessing techniques
ï‚· Portability
ï‚· Free availability
ï‚· Flexibility
It supports the various standard data mining tasks by using the various techniques and methods.
It is used to provide the access to data base connectivity and deep learning (Yeo, 2012).
Here, we will analysis the bank data by using the weka data mining tool. The bank data contains
the bank information. The bank data analysis uses the J48 analysis in Weka data mining tool.
Then, Do the data mining analysis by using following the below steps.
First, Open Weka data mining tool. It is shown below.
4
Document Page
Click Explorer to Load the bank data set.
It is shown below.
Once successfully load the data.
After, clicks classify tab and click choose to select the trees.
Then, click the J48 to do the J48 analysis.
The J48 analysis for each attributes is shown below (HAIR, 2018).
5
Document Page
J48 Analysis
Here, we will use the J48 decision tree algorithm to analysis the bank data set. Because, the J48
analysis is used to drill the database to provide the approachable data and it involves the
systematic analysis of large data sets. It is helps to make the predictions about the data. The J48
algorithm is used to create the univariate decision tress and it provide the process of multivariate
decision tress by using the process of classify instances with one or more attributes. It performs
the comparative analysis for the bank data sets. The J48 algorithm analysis is shown below
(FMIS als facilitaire tool, 2013).
6
tabler-icon-diamond-filled.svg

Paraphrase This Document

Need a fresh take? Get an instant paraphrase of this document with our AI Paraphraser
Document Page
Income - J48 Analysis
Correctly Classified Instances 228 38 %
Incorrectly Classified Instances 372 62 %
Kappa statistic 0.0233
Mean absolute error 0.3326
Root mean squared error 0.4748
Relative absolute error 97.8135 %
Root relative squared error 115.1822 %
Total Number of Instances 600
=== Detailed Accuracy By Class ===
7
Document Page
TP Rate FP Rate Precision Recall F-Measure MCC ROC Area PRC Area
Class
0.617 0.610 0.451 0.617 0.521 0.007 0.495 0.447 INNER_CITY
0.243 0.244 0.288 0.243 0.263 -0.001 0.517 0.291 TOWN
0.188 0.075 0.321 0.188 0.237 0.141 0.576 0.246 RURAL
0.032 0.052 0.067 0.032 0.043 -0.028 0.522 0.108 SUBURBAN
Weighted Avg. 0.380 0.361 0.343 0.380 0.352 0.023 0.517 0.335
=== Confusion Matrix ===
a b c d <-- classified as
166 70 19 14 | a = INNER_CITY
110 42 13 8 | b = TOWN
53 19 18 6 | c = RURAL
39 15 6 2 | d = SUBURBAN
Save_Act - J48 Analysis
8
Document Page
Correctly Classified Instances 431 71.8333 %
Incorrectly Classified Instances 169 28.1667 %
Kappa statistic 0.2968
Mean absolute error 0.3197
Root mean squared error 0.4565
Relative absolute error 74.6875 %
Root relative squared error 98.7075 %
Total Number of Instances 600
=== Detailed Accuracy By Class ===
TP Rate FP Rate Precision Recall F-Measure MCC ROC Area PRC Area
Class
9
tabler-icon-diamond-filled.svg

Secure Best Marks with AI Grader

Need help grading? Try our AI Grader for instant feedback on your assignments.
Document Page
0.430 0.152 0.559 0.430 0.486 0.302 0.738 0.504 NO
0.848 0.570 0.768 0.848 0.806 0.302 0.738 0.858 YES
Weighted Avg. 0.718 0.440 0.703 0.718 0.707 0.302 0.738 0.748
=== Confusion Matrix ===
a b <-- classified as
80 106 | a = NO
63 351 | b = YES
Mortgage - J48 Analysis
10
Document Page
Correctly Classified Instances 393 65.5 %
Incorrectly Classified Instances 207 34.5 %
Kappa statistic 0.1149
Mean absolute error 0.4169
Root mean squared error 0.4904
Relative absolute error 91.8046 %
Root relative squared error 102.9264 %
Total Number of Instances 600
=== Detailed Accuracy By Class ===
TP Rate FP Rate Precision Recall F-Measure MCC ROC Area PRC Area
Class
11
Document Page
0.898 0.799 0.678 0.898 0.772 0.137 0.568 0.704 NO
0.201 0.102 0.512 0.201 0.289 0.137 0.568 0.424 YES
Weighted Avg. 0.655 0.556 0.620 0.655 0.604 0.137 0.568 0.607
=== Confusion Matrix ===
a b <-- classified as
351 40 | a = NO
167 42 | b = YES
Sex - J48 Analysis
12
tabler-icon-diamond-filled.svg

Paraphrase This Document

Need a fresh take? Get an instant paraphrase of this document with our AI Paraphraser
Document Page
=== Stratified cross-validation ===
Correctly Classified Instances 321 53.5 %
Incorrectly Classified Instances 279 46.5 %
Kappa statistic 0.07
Mean absolute error 0.4994
Root mean squared error 0.5876
Relative absolute error 99.8804 %
Root relative squared error 117.5249 %
Total Number of Instances 600
13
Document Page
=== Detailed Accuracy by Class ===
TP Rate FP Rate Precision Recall F-Measure MCC ROC Area PRC Area
Class
0.493 0.423 0.538 0.493 0.515 0.070 0.494 0.491 FEMALE
0.577 0.507 0.532 0.577 0.554 0.070 0.494 0.487 MALE
Weighted Avg. 0.535 0.465 0.535 0.535 0.534 0.070 0.494 0.489
=== Confusion Matrix ===
a b <-- classified as
148 152 | a = FEMALE
127 173 | b = MALE
14
Document Page
J48 Analysis for Current_Act
Correctly Classified Instances 455 75.8333 %
Incorrectly Classified Instances 145 24.1667 %
Kappa statistic 0
Mean absolute error 0.3665
Root mean squared error 0.4281
Relative absolute error 99.8658 %
Root relative squared error 99.9998 %
Total Number of Instances 600
=== Detailed Accuracy By Class ===
15
tabler-icon-diamond-filled.svg

Secure Best Marks with AI Grader

Need help grading? Try our AI Grader for instant feedback on your assignments.
Document Page
TP Rate FP Rate Precision Recall F-Measure MCC ROC Area PRC Area
Class
0.000 0.000 0.000 0.000 0.000 0.000 0.489 0.238 NO
1.000 1.000 0.758 1.000 0.863 0.000 0.489 0.754 YES
Weighted Avg. 0.758 0.758 0.575 0.758 0.654 0.000 0.489 0.629
=== Confusion Matrix ===
a b <-- classified as
0 145 | a = NO
0 455 | b = YES
3.2 Discussion and Justification
The J48 algorithm performs the Analysis in following attributes like income, sex, saving
account, current account and mortgage. In Income J48 analysis is provides the details about the
inner city, town, rural and suburban incomes. Here, the inner city has the high incomes. The
income has the mean is 0.3326. In Saving account analysis, it has the mean 0.3197. The bank
data has two account saving and current account. The J48 analysis provides the detail about the
saving account that is most of users is having the Current account compared to saving account.
So, it is very useful the bank sector. In Mortgage, this analysis provides the detail about the
mortgage that is most of users does not have the mortgage in bank sector. In Sex attributes, the
J48 analysis provides the details about the user’s sex that is most of female users are having the
bank account (FMIS als facilitaire tool, 2013).
3.3 Conclusion of the Analysis
The Bank data is needs to analysis the data by using the weka data mining tool. The weka
data mining tool use the J48 algorithm to analysis the bank data. This algorithm is used to
provide the full details and justification about the bank data. It mainly used to provide the saving
account and current account information. These are discussed and analyzed in detail (Witten et
al., 2017).
16
Document Page
4. Q4
Dashboard
The above shown dashboard is explained below.
This administration dashboard illustration centers on income altogether and in addition
on a client level, in addition to the cost of getting new clients. It conveys this data by giving you
data with respect to Total Revenue and Average Revenue per Customer, and insights identifying
with the Number of New Customers and Customer Acquisition Cost (CAC).
17
Document Page
A standout amongst the most essential KPIs for every supervisor is the Actual Revenue
created inside a specific period, contrasted with the organization's Target Revenue and
additionally an outline of how the income has created amid the most recent months. As can be
seen on the administration dashboard format, there are straightforward and straightforward
representations relating the Actual Revenue against Target Revenue; this data is given
numerically for a successful and extensive photo of your activities (Check-listes pour cadres
dirigeants performants, 2012).
For most income pointers, the Net Revenue is utilized barring VAT charged to clients.
Regularly, looking at the income inside a specific period to a similar time of the earlier year
gives a decent sign of how business has built up; that is the reason our administration KPI
dashboard above surrenders a heads show of income examinations against the earlier year for
more compelling business checking. It is apparent that an effective business must meet their
Target Revenue objectives, anyway the continuous perceptions in this administration dashboard
are basic to always screen your circumstance and address any disparities.
The Average Revenue per Customer gives bits of knowledge about the achievement of
up-offering and strategically pitching exercises or the general esteem that an item or
administration produces for the client. Likewise, valuing affects this metric. The Average
Revenue per Customer is specifically associated with the Customer Lifetime Value (CLV), an
imperative metric for financial specialists and the general accomplishment of the plan of action.
The correct estimation of the Customer Lifetime Value incorporates every single future income
less the cost of producing these incomes, marked down by a characterized loan fee, considering
upselling and client stir (Dasarathy, 2004).
At the base of our first administration dashboard illustration you discover representations
of the Customer Acquisition Cost (CAC). This KPI incorporates all advertising and deals costs
that happened amid the procurement procedure and basically depicts the normal cost of picking
up another client. CAC is another imperative figure for speculators; joined with the CLV, it
appears if a plan of action is working or not. An essential decide is that the CLV must be higher
than the cost of winning a client, on the grounds that if more cash is being put into increasing
new clients than their support is paying off, it isn't justified regardless of the exertion and your
business endeavors are better utilized somewhere else (FMIS als facilitaire tool, 2013).
18
tabler-icon-diamond-filled.svg

Paraphrase This Document

Need a fresh take? Get an instant paraphrase of this document with our AI Paraphraser
Document Page
References
Azzalini, A. and Scarpa, B. (2012). Data Analysis and Data Mining. Oxford: Oxford University
Press, USA.
Blokdijk, G. (2012). CRM 100 Success Secrets - 100 Most Asked Questions on Customer
Relationship Management Software, Solutions, Systems, Applications and Services.
Dayboro: Emereo Publishing.
Buttle, F. (2015). Customer Relationship Management. Taylor and Francis.
Carter, T., Dee, J. and Zuckman, H. (2014). Mass Communication Law in a Nutshell, 7th. St.
Paul: West Academic.
Check-listes pour cadres dirigeants performants. (2012). Zurich: WEKA Business Media.
Dasarathy, B. (2004). Data mining and knowledge discovery. Bellingham, Wash.: SPIE.
FMIS als facilitaire tool. (2013). Amsterdam: WEKA uitgeverij BV.
HAIR, J. (2018). MULTIVARIATE DATA ANALYSIS. [S.l.]: CENGAGE LEARNING EMEA.
Luo, J. (2012). Soft computing in information communication technology. Berlin: Springer.
Precup, R. (2012). Applied computational intelligence in engineering and information
technology. Berlin: Springer.
Raab, G. and Resko, S. (2016). Customer relationship management. London: Routledge.
Tuffery, S. (2013). Data mining and statistics for decision making. Hoboken, N.J.: Wiley.
Witten, I., Frank, E., Hall, M. and Pal, C. (2017). Data mining. Amsterdam: Morgan Kaufmann.
Yeo, S. (2012). Computer science and its applications. New York: Springer.
19
chevron_up_icon
1 out of 20
circle_padding
hide_on_mobile
zoom_out_icon
logo.png

Your All-in-One AI-Powered Toolkit for Academic Success.

Available 24*7 on WhatsApp / Email

[object Object]