Semester Project: Business Intelligence Analysis and Report
VerifiedAdded on 2022/11/13
|26
|4567
|302
Report
AI Summary
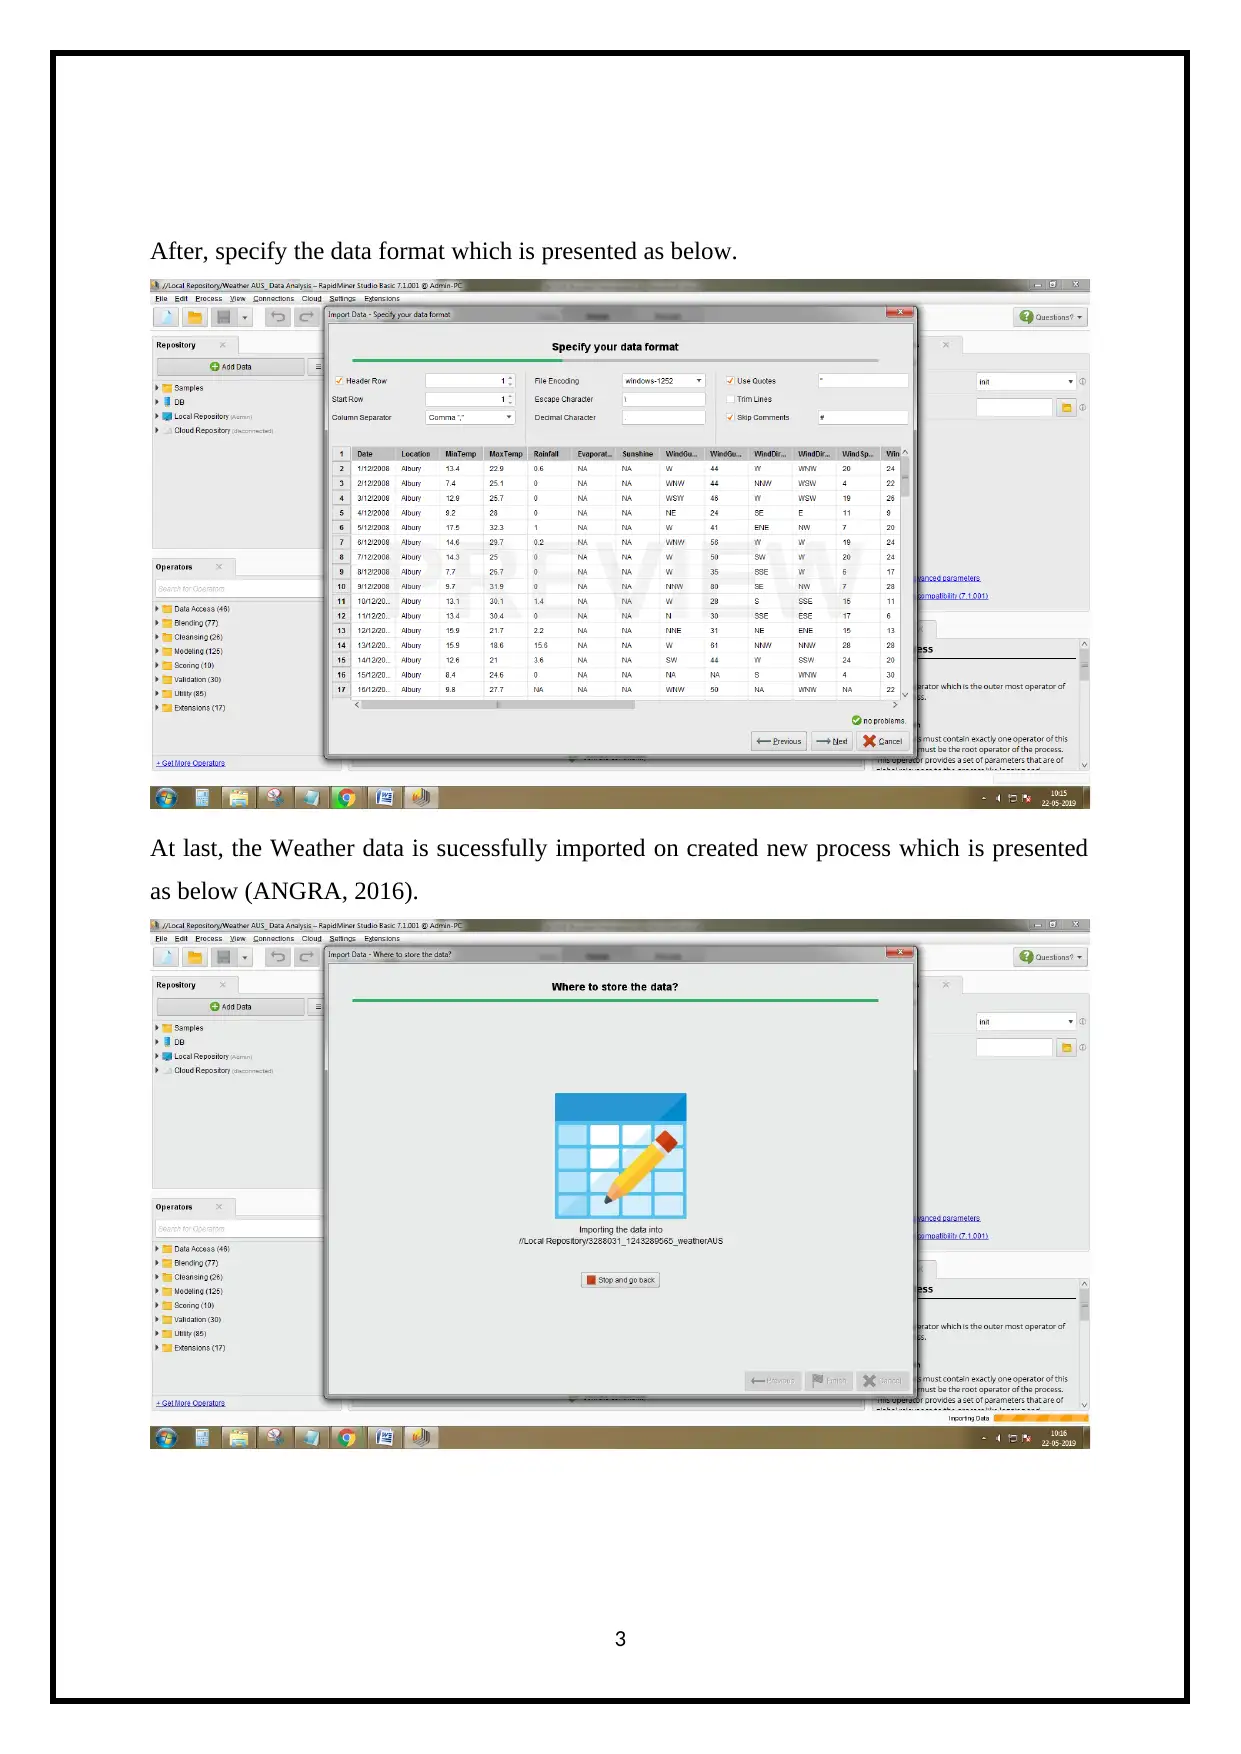
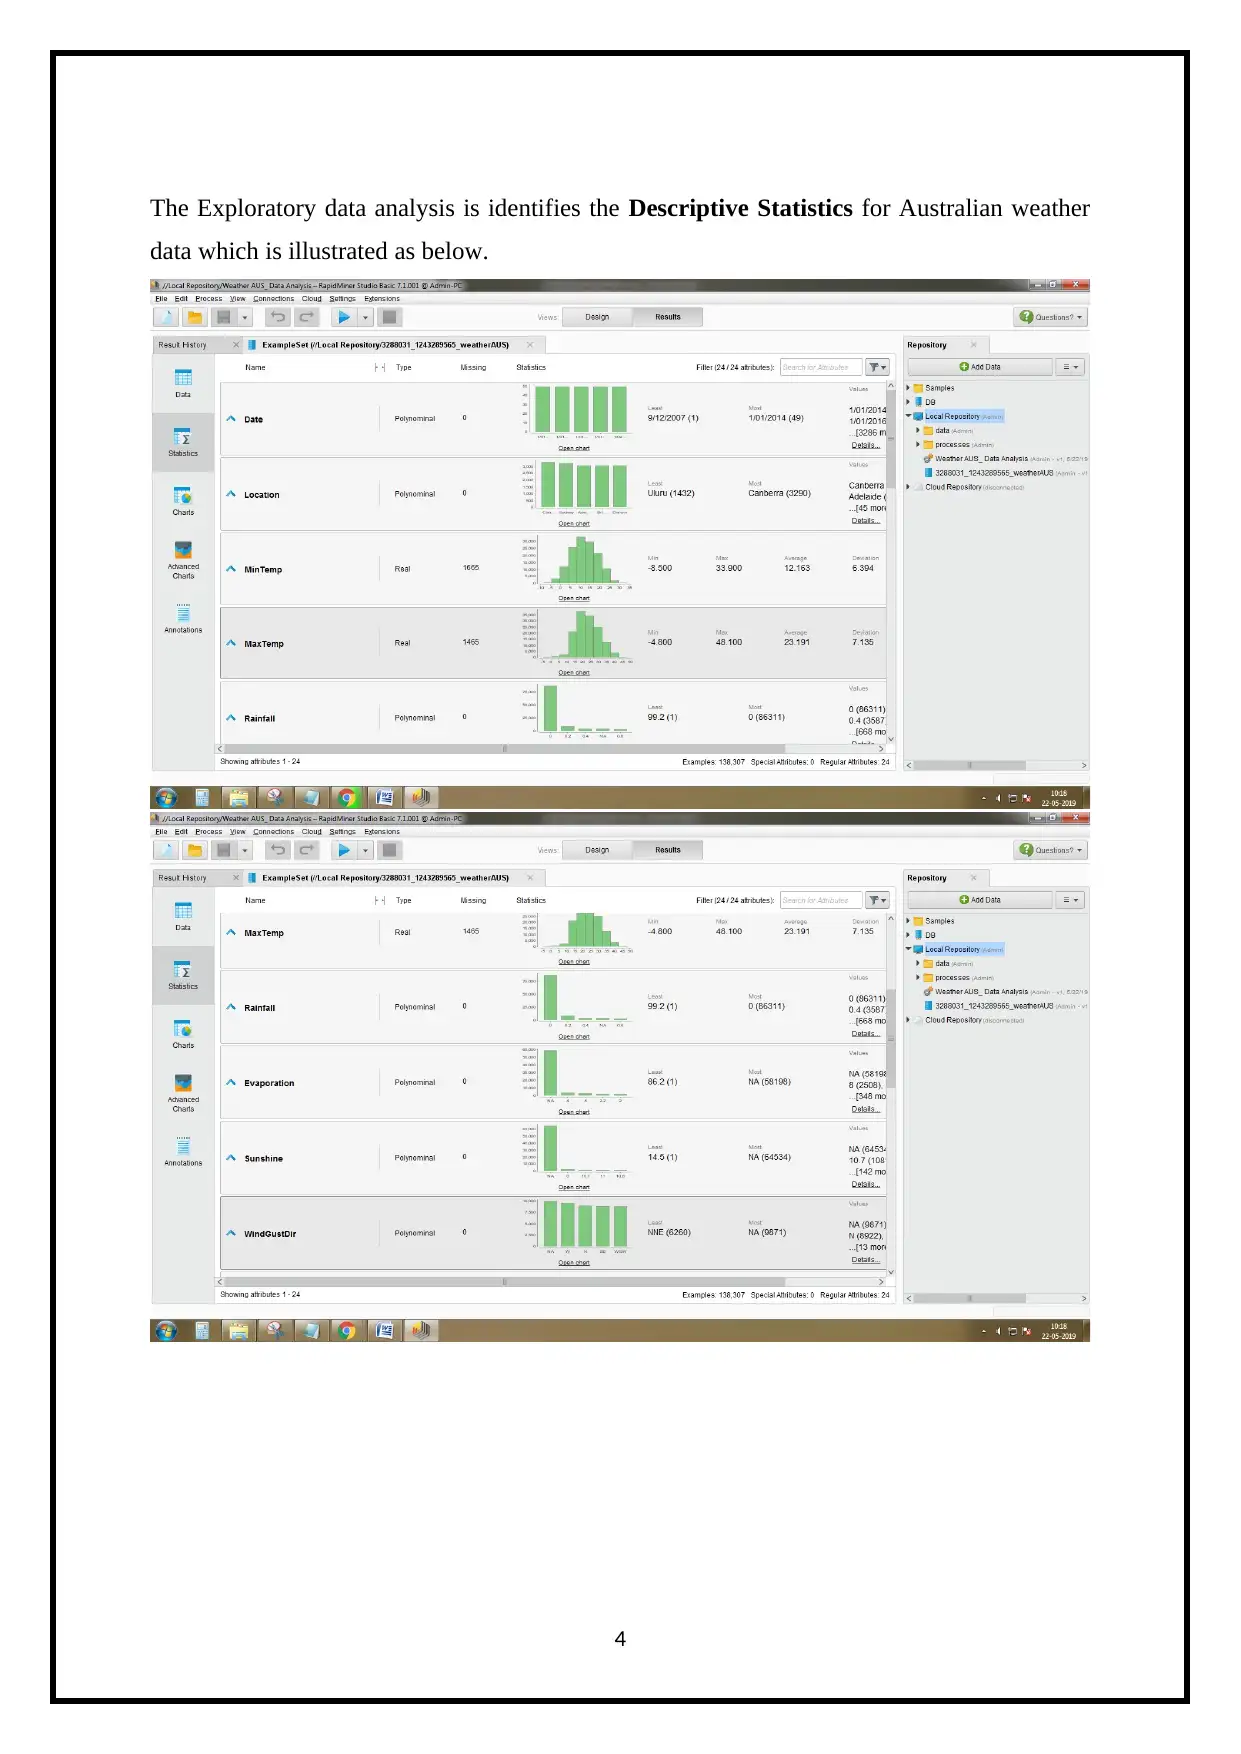
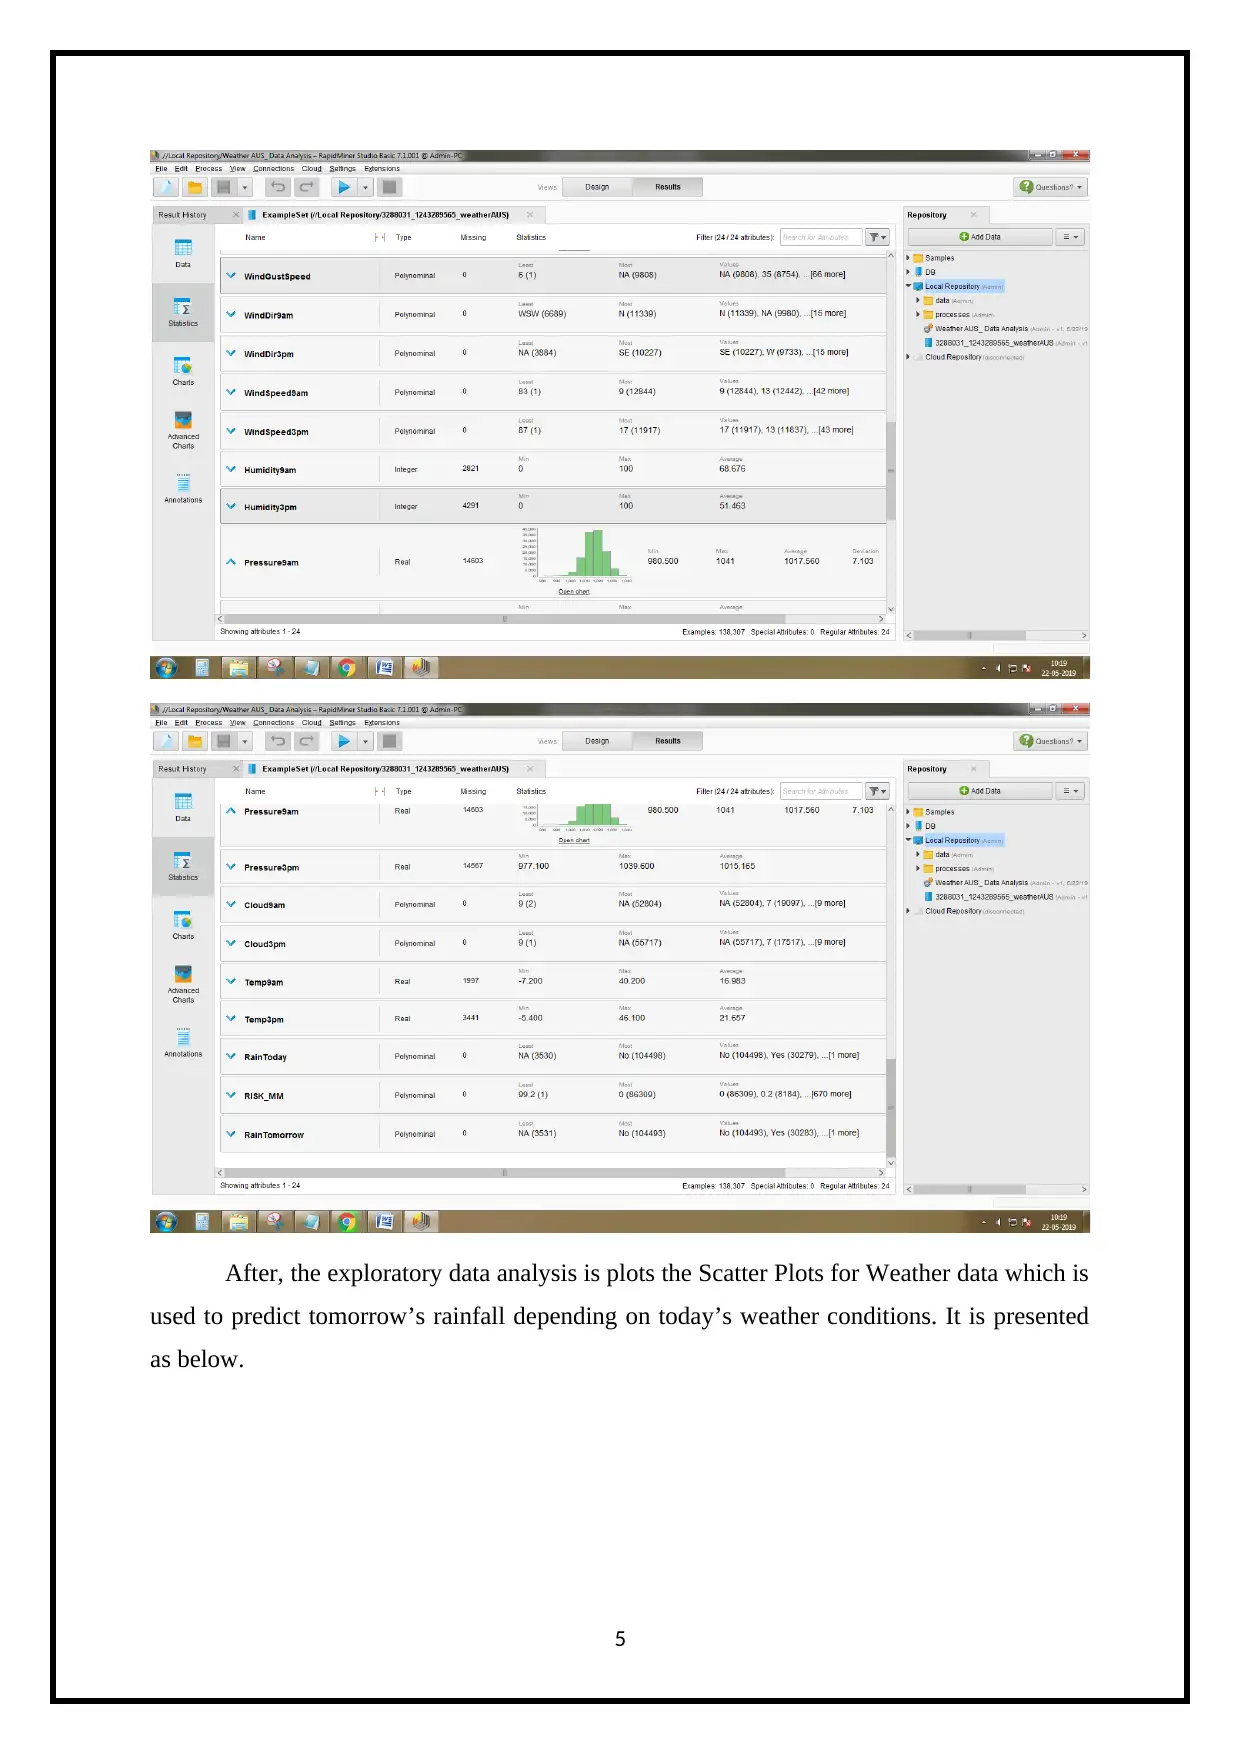
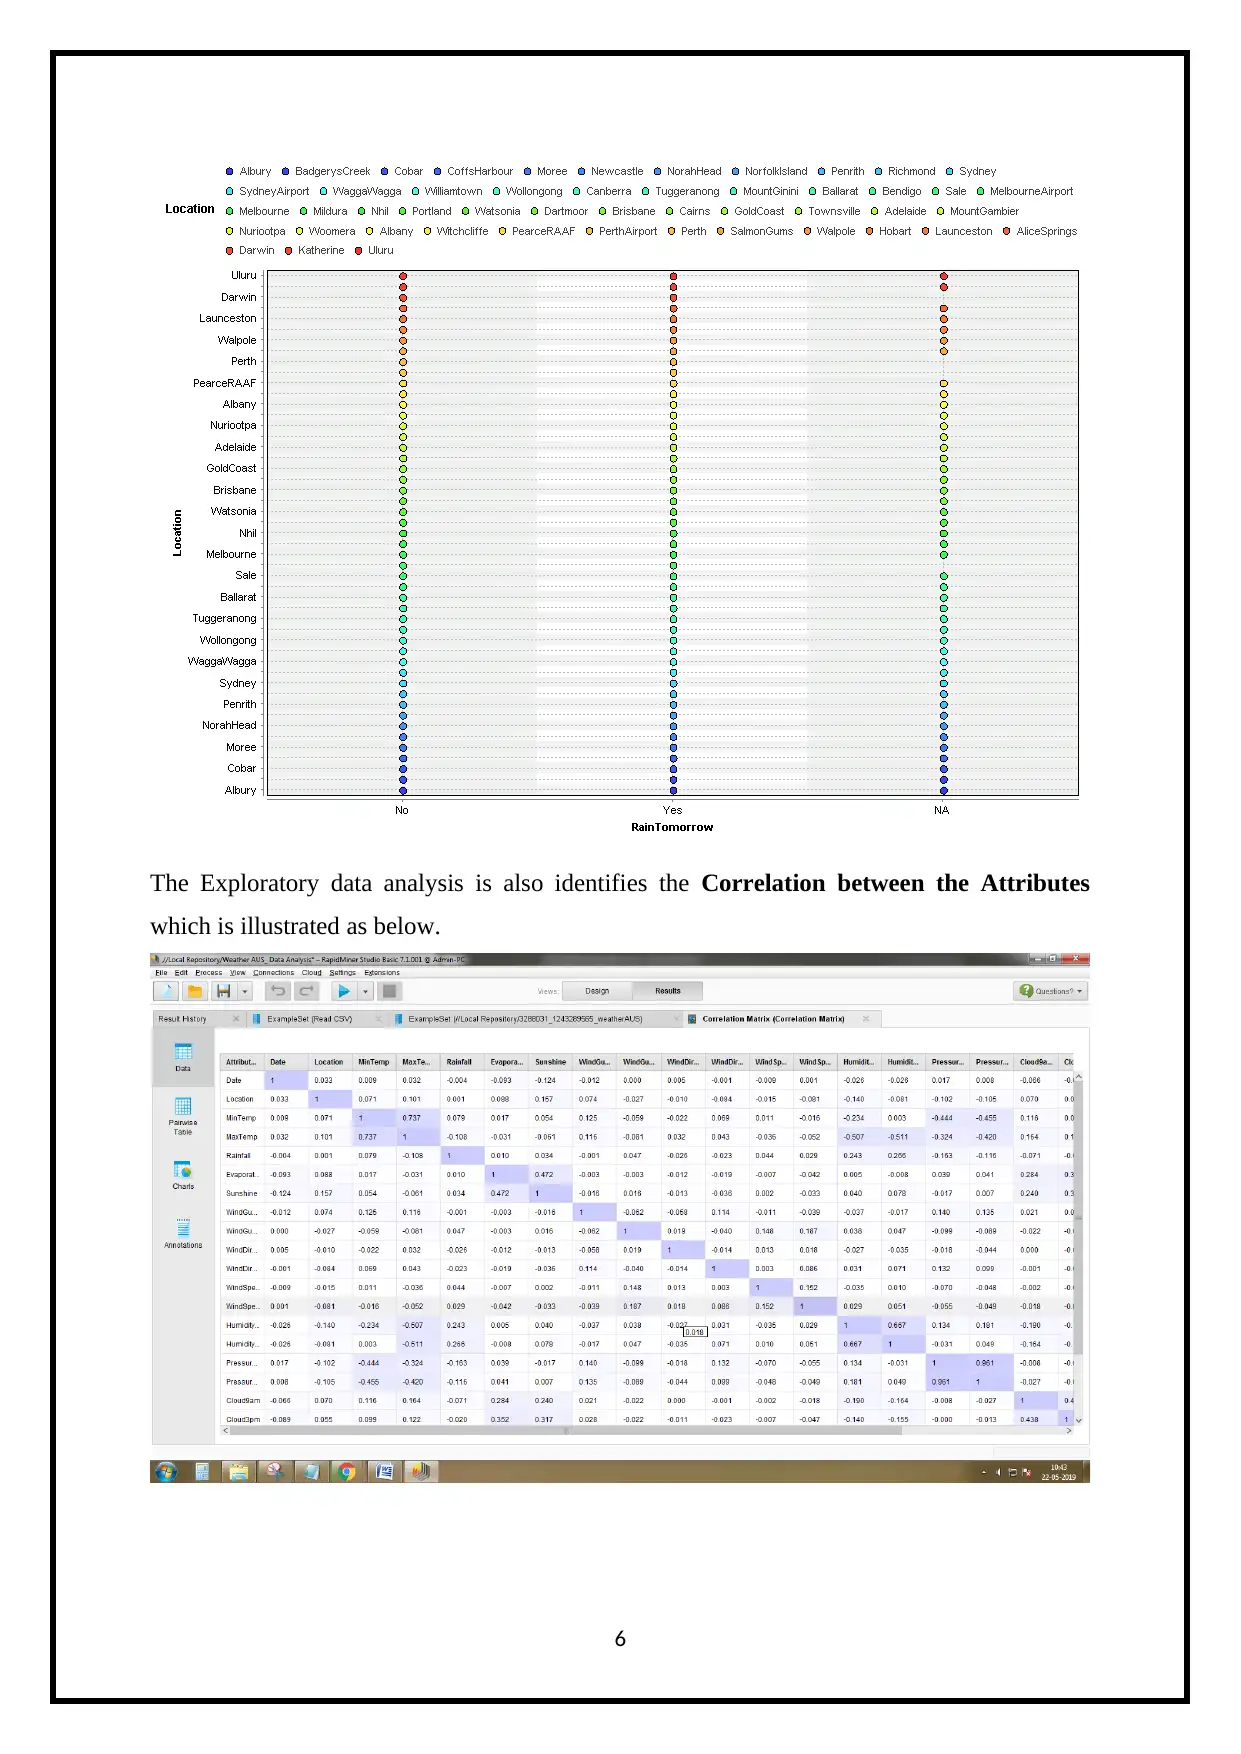
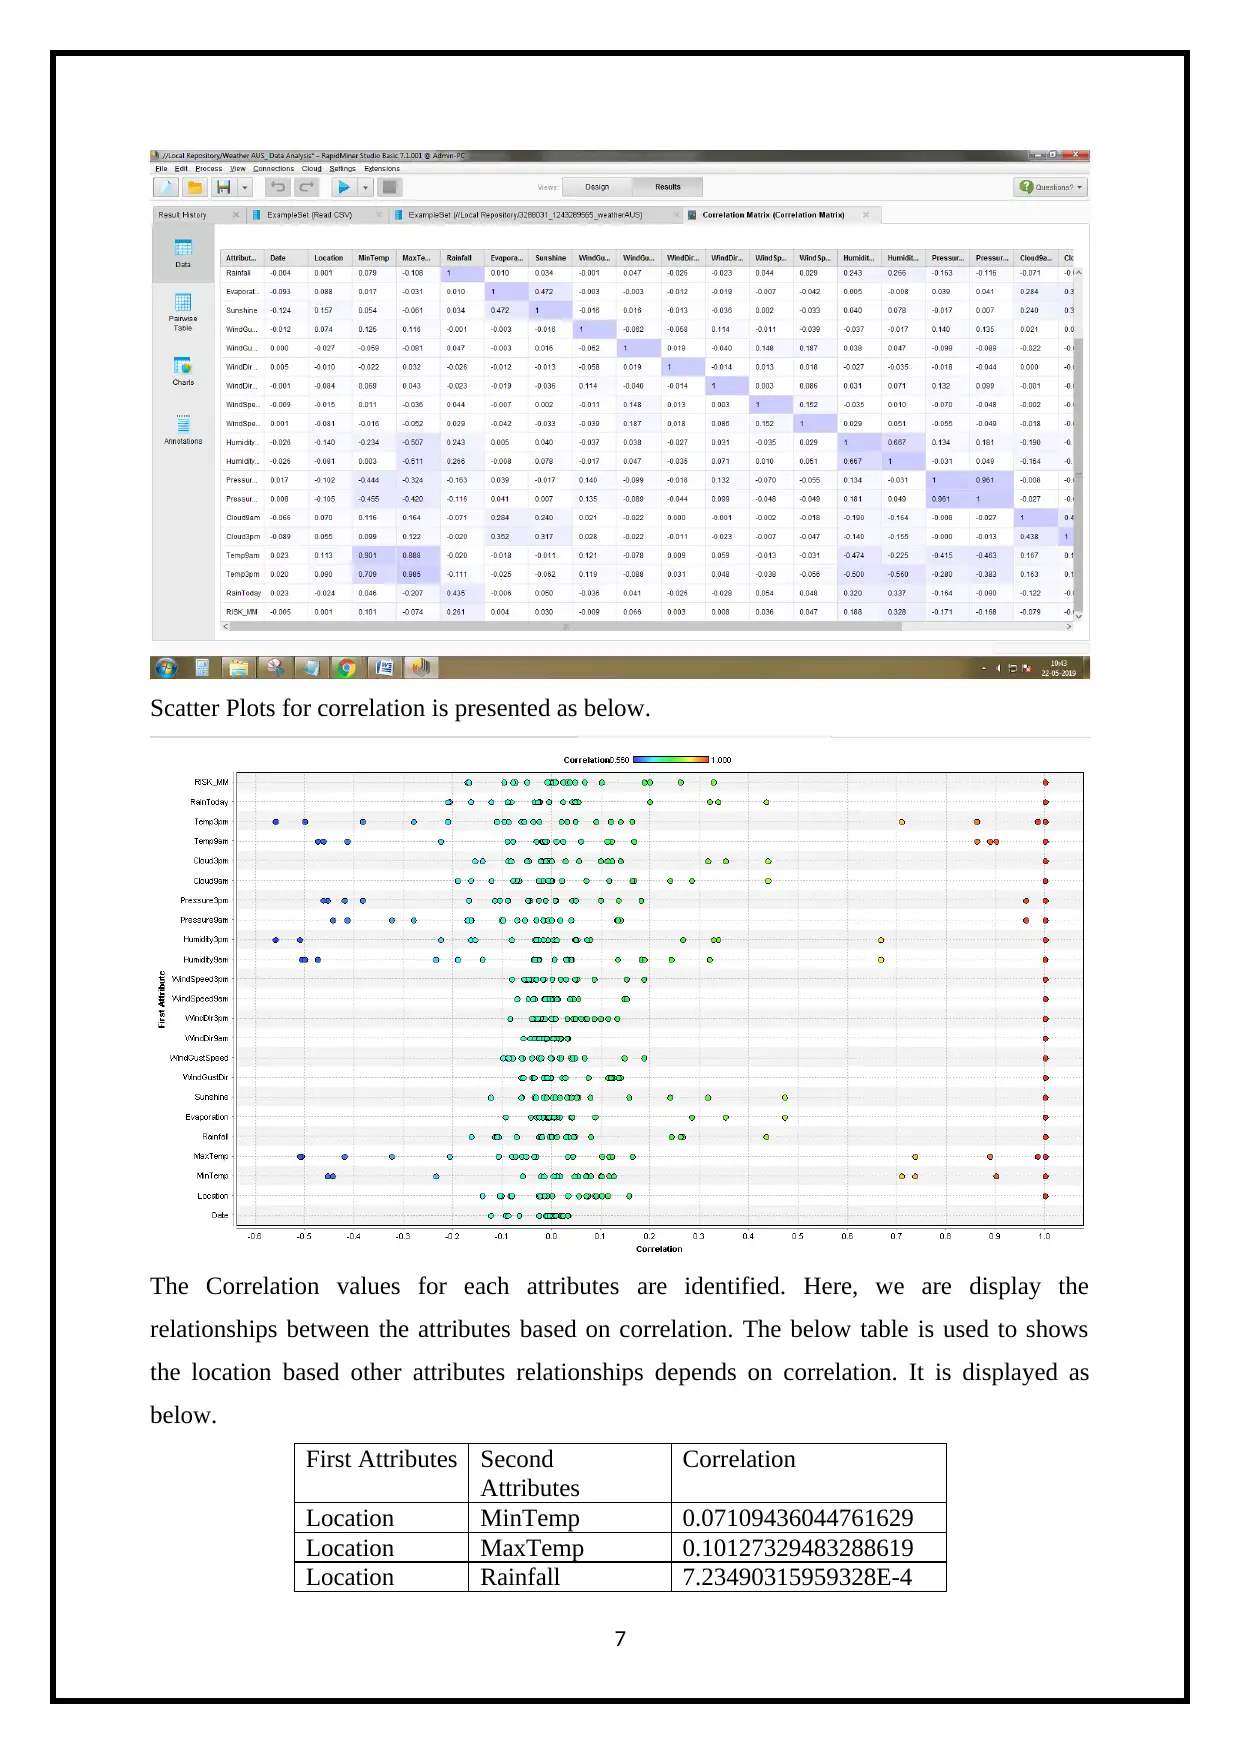
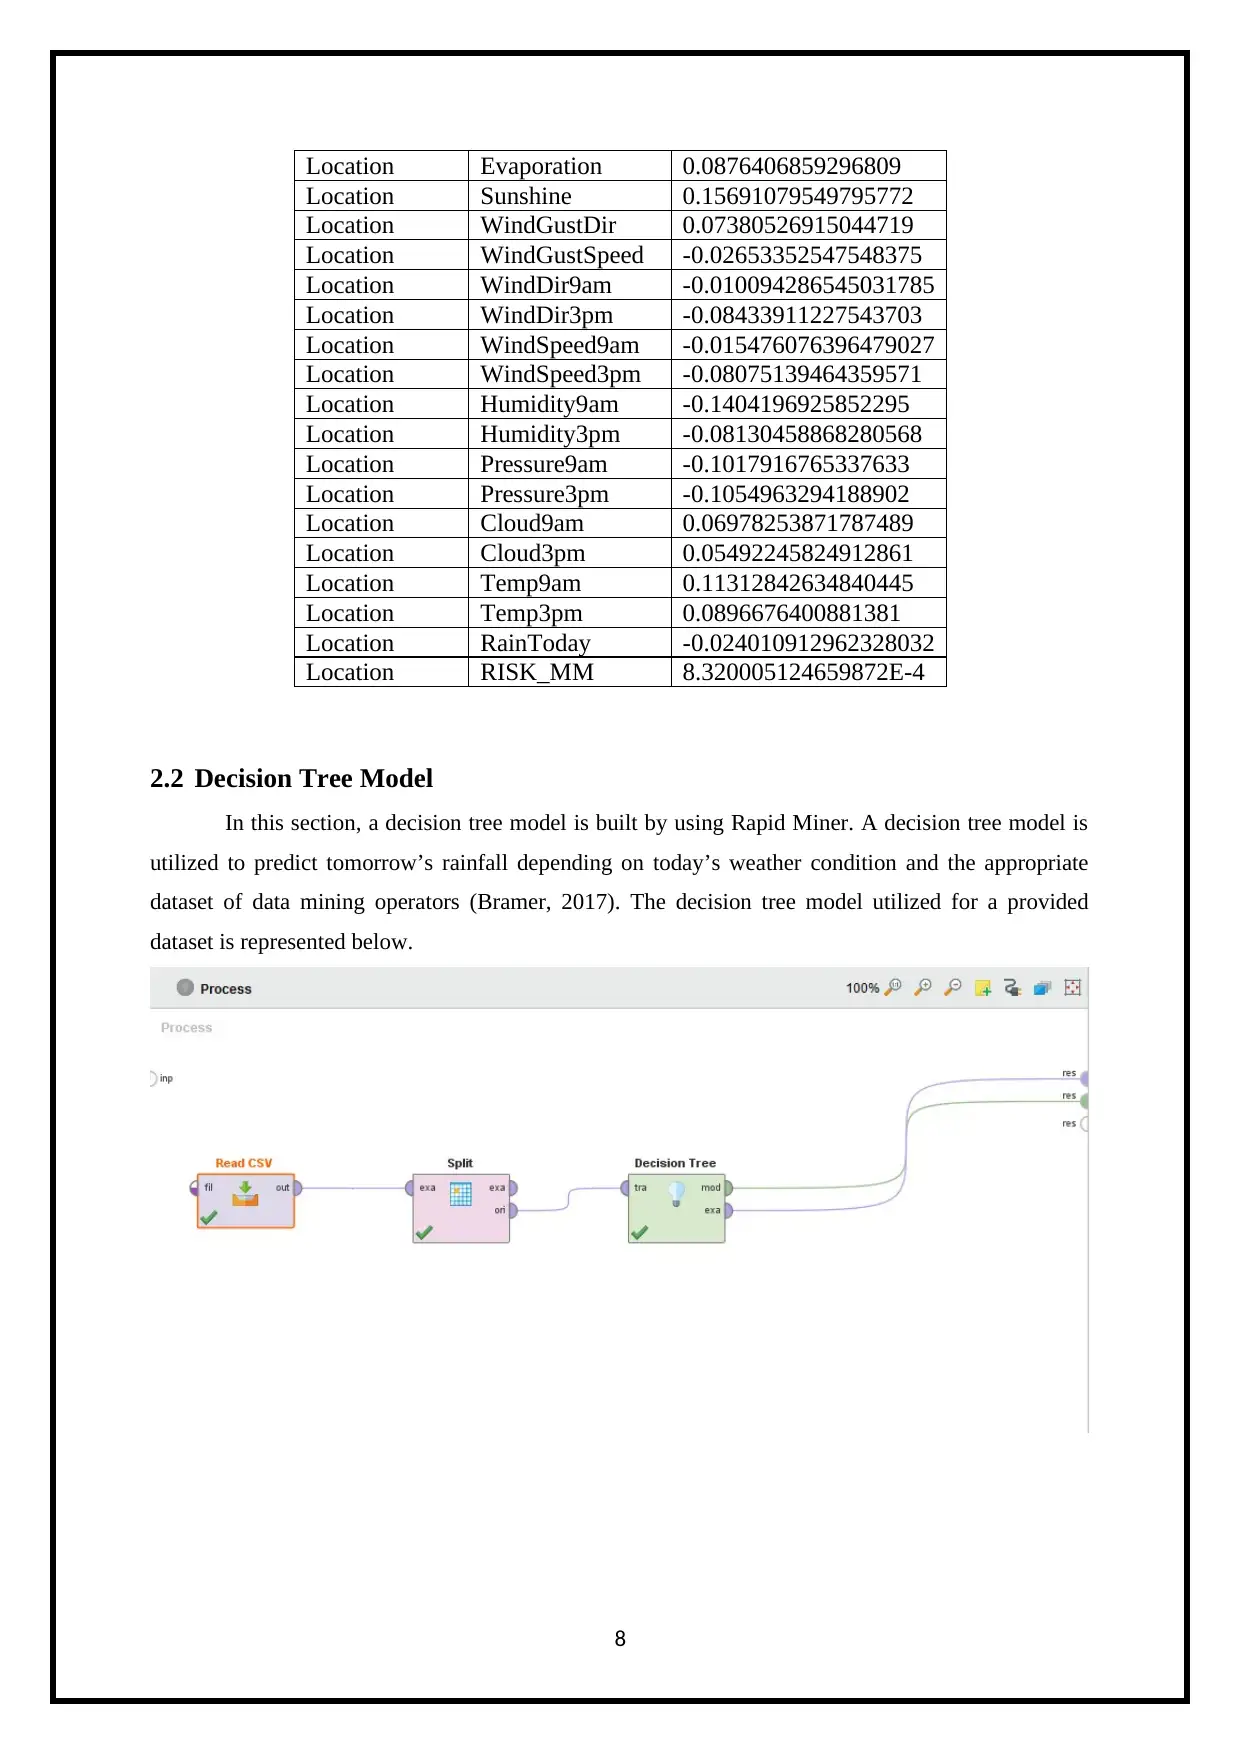
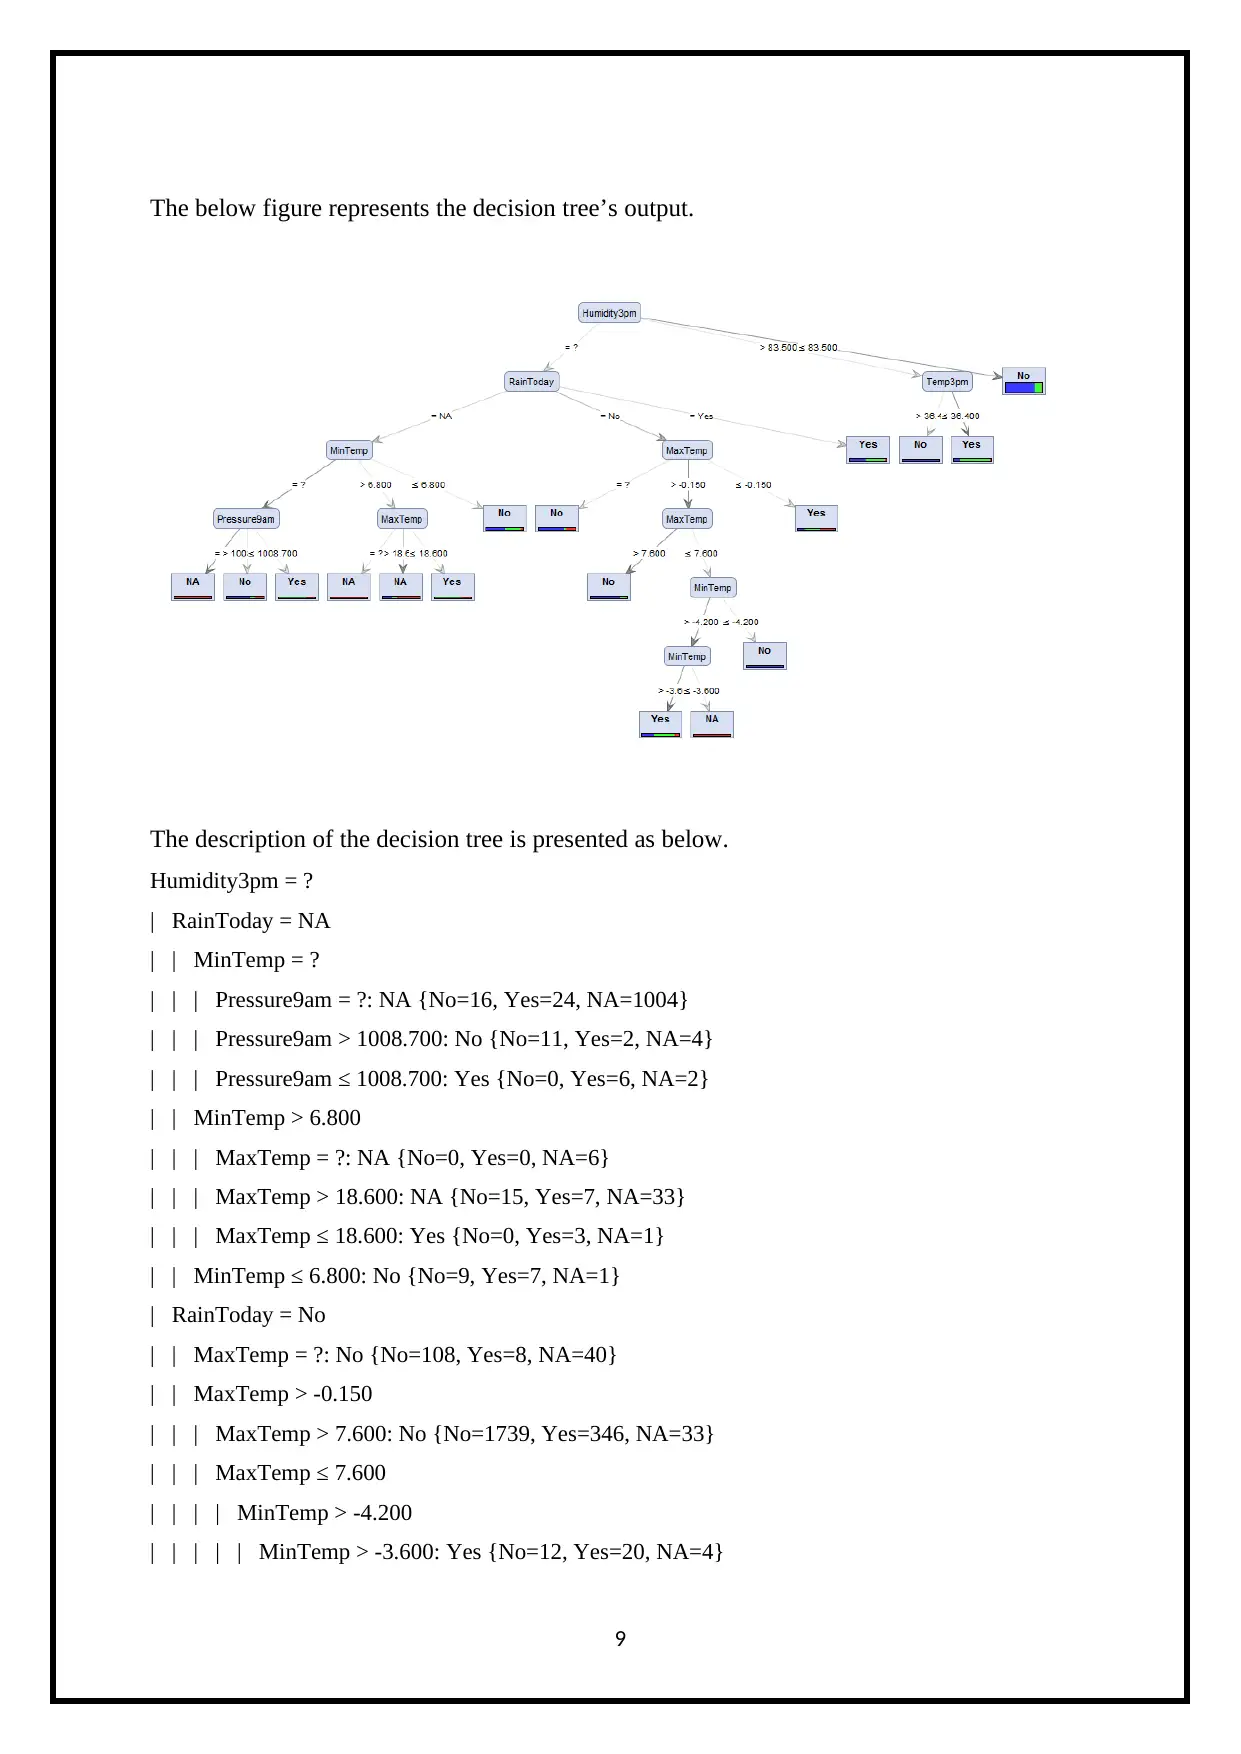
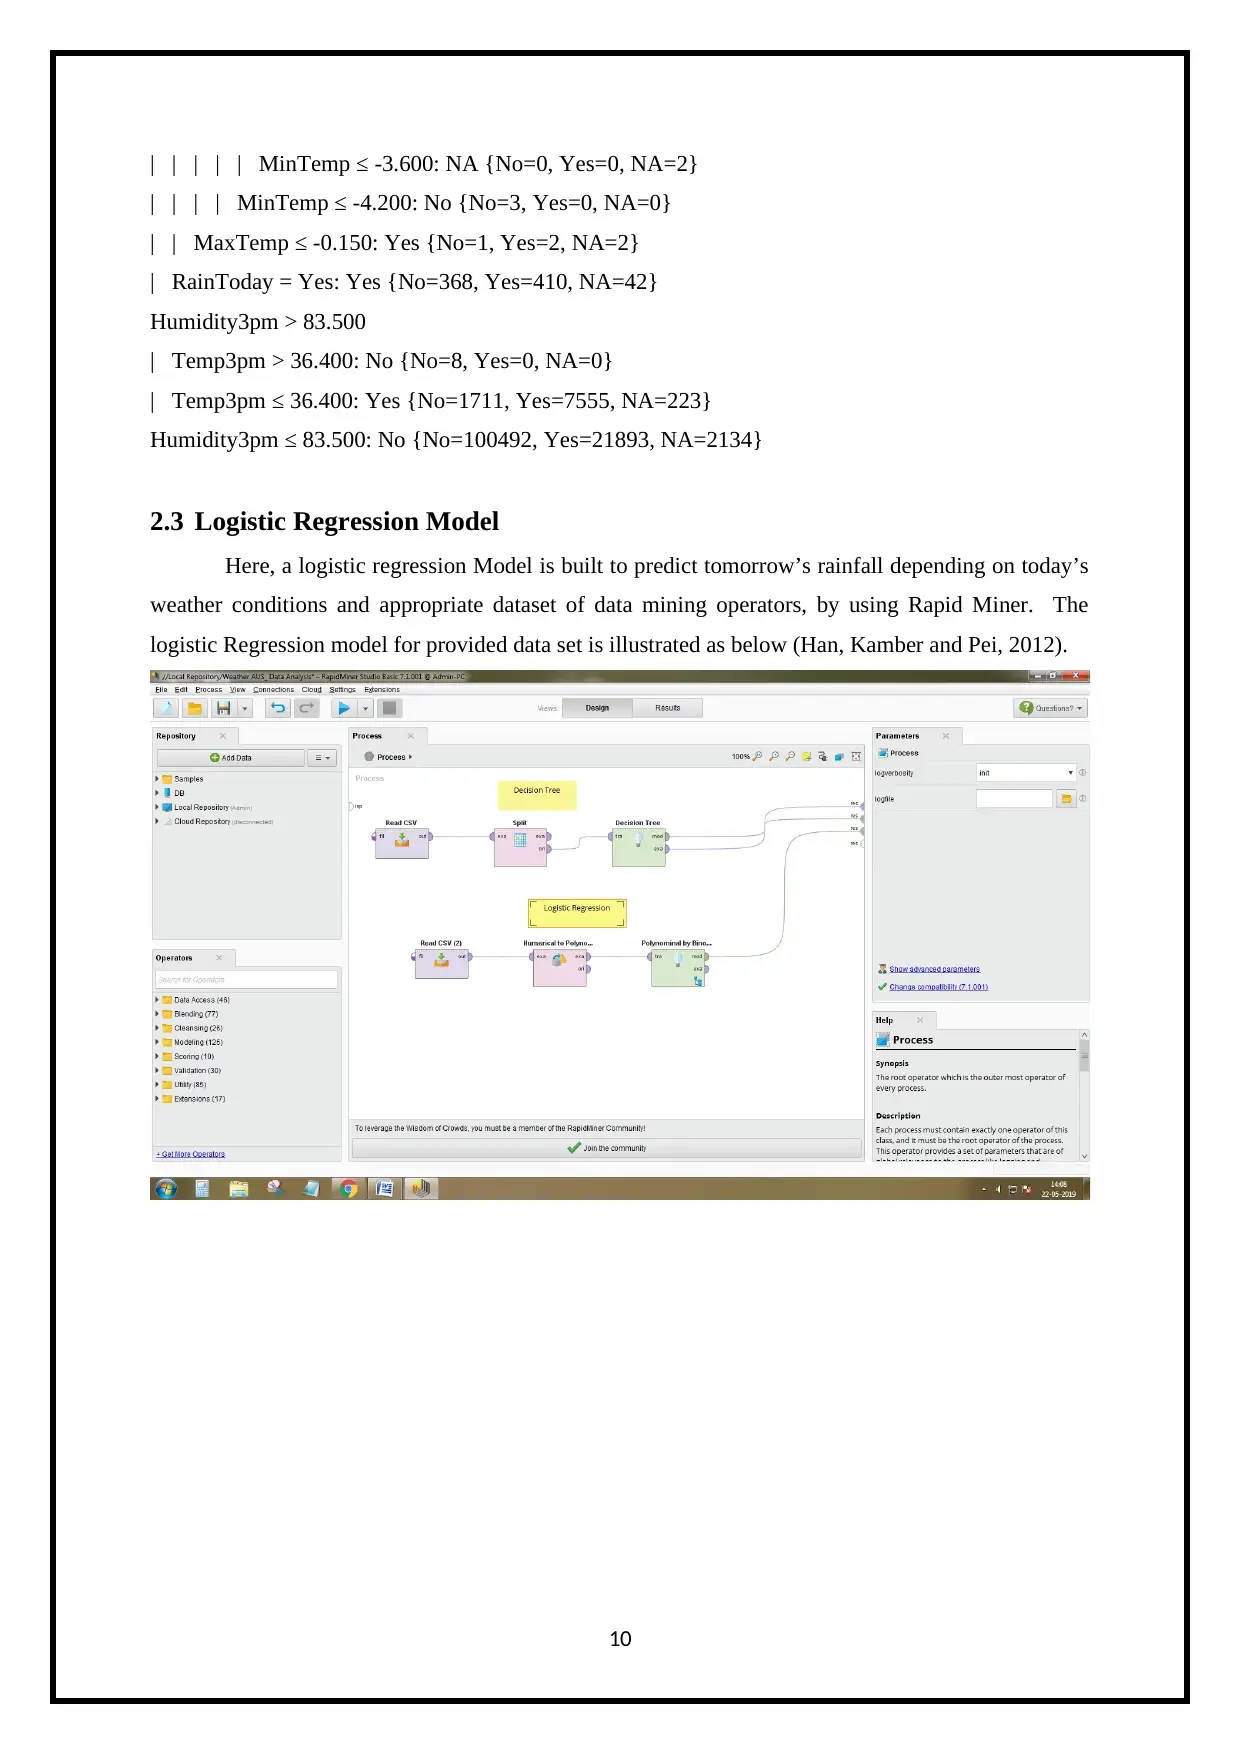
This report details a business intelligence project undertaken by a university student, focusing on the analysis of Australian weather data using RapidMiner. Task 1 involves exploratory data analysis, the construction and validation of Decision Tree and Logistic Regression models to predict rainfall. Task 2 delves into research on data warehousing, including the architecture design of a high-level data warehouse, its main components, and addresses security, privacy, and ethical concerns related to data management and business intelligence. The project demonstrates the application of business intelligence in organizational systems, problem-solving, and the effective use of data mining techniques. The report also covers ETL tools, metadata, and the components of a data warehouse. The student has effectively communicated the findings in a concise and clear manner, demonstrating an understanding of the course learning objectives.

University
Semester
Business Intelligence
Student ID
Student Name
Submission Date
Semester
Business Intelligence
Student ID
Student Name
Submission Date
Paraphrase This Document
Need a fresh take? Get an instant paraphrase of this document with our AI Paraphraser

Table of Contents
1. Project Description........................................................................................................................1
2. Task 1 - Rapid Miner.....................................................................................................................1
2.1 Exploratory Data Analysis on Weather AUS Data................................................................1
2.2 Decision Tree Model.............................................................................................................8
2.3 Logistic Regression Model..................................................................................................10
2.4 Final Decision Tree and Final Logistics Regression Models’ Validation............................11
3. Task 2 - Research the Relevant Literature...................................................................................12
3.1 Architecture Design of a High Level Data Warehouse........................................................12
3.2 Proposed High Level Data Warehouse Architecture Design’s Main Components...............15
3.3 Security Privacy and the Ethical Concerns..........................................................................19
References...........................................................................................................................................24

1. Project Description
This project's primary objective includes analyzing the provided data set by using the
Rapid Miner. The provided data set is based on Australian Weather data. This project applies
the business intelligence's implementation in organization's systems and in the business
processes. It identifies and solves the complex organizational problems practically and
creatively through the use of business intelligences. It also effectively addresses the real
world problems. This project is consists of three main tasks. In Task one, the likelihood of
rainfall for the next day's weather depending on today's weather conditions is predicted by
using the data mining tool like Rapid Miner which is used for analyzing and reporting to the
Australian weather data set. Here, the business understanding, data understanding, data
preparation, the CRISP DM data mining process’s modelling phase and evaluation phase will
be applied. In Task Two, the related literature on how the capabilities of big data analytics
can be implemented into a data warehouse architecture will be researched.
2. Task 1 - Rapid Miner
In task 1, the likelihood of rainfall for the next day depending on today’s weather
condition will be predicted by applying data preparation, data understanding, data modelling
and CRISP DM data mining process’s evaluation phases. Thus, the following steps are
followed for the prediction of weather:
First, we are exploratory data analysis on Australian Weather data.
Build a Decision Tree Model.
Build a Logistic Regression Model.
Validation on Final Decision Tree Model.
Validation on Logistic Regression Model.
2.1 Exploratory Data Analysis on Weather AUS Data
To exploratory data analysis on Australian weather data by using the Rapid Miner
which is used for understanding the characteristics of every single variable and their
relationships. It also addresses and describes the main characteristics of each variables in the
weather dataset like missing values, minimum values, maximum values, average, most
frequent values, invalid values, standard deviation and more. These are presented as below.
To exploratory provided Australian Weather data on Rapid Miner by using the below steps,
1
⊘ This is a preview!⊘
Do you want full access?
Subscribe today to unlock all pages.

Trusted by 1+ million students worldwide

First, open the Rapid Miner and click the new process which is illustrated as below (Ahmed
Sherif., 2016).
After, add the data on created process which is illustrated as below.
2
Sherif., 2016).
After, add the data on created process which is illustrated as below.
2
Paraphrase This Document
Need a fresh take? Get an instant paraphrase of this document with our AI Paraphraser

After, specify the data format which is presented as below.
At last, the Weather data is sucessfully imported on created new process which is presented
as below (ANGRA, 2016).
3
At last, the Weather data is sucessfully imported on created new process which is presented
as below (ANGRA, 2016).
3

The Exploratory data analysis is identifies the Descriptive Statistics for Australian weather
data which is illustrated as below.
4
data which is illustrated as below.
4
⊘ This is a preview!⊘
Do you want full access?
Subscribe today to unlock all pages.

Trusted by 1+ million students worldwide

After, the exploratory data analysis is plots the Scatter Plots for Weather data which is
used to predict tomorrow’s rainfall depending on today’s weather conditions. It is presented
as below.
5
used to predict tomorrow’s rainfall depending on today’s weather conditions. It is presented
as below.
5
Paraphrase This Document
Need a fresh take? Get an instant paraphrase of this document with our AI Paraphraser

The Exploratory data analysis is also identifies the Correlation between the Attributes
which is illustrated as below.
6
which is illustrated as below.
6

Scatter Plots for correlation is presented as below.
The Correlation values for each attributes are identified. Here, we are display the
relationships between the attributes based on correlation. The below table is used to shows
the location based other attributes relationships depends on correlation. It is displayed as
below.
First Attributes Second
Attributes
Correlation
Location MinTemp 0.07109436044761629
Location MaxTemp 0.10127329483288619
Location Rainfall 7.23490315959328E-4
7
⊘ This is a preview!⊘
Do you want full access?
Subscribe today to unlock all pages.

Trusted by 1+ million students worldwide

Location Evaporation 0.0876406859296809
Location Sunshine 0.15691079549795772
Location WindGustDir 0.07380526915044719
Location WindGustSpeed -0.02653352547548375
Location WindDir9am -0.010094286545031785
Location WindDir3pm -0.08433911227543703
Location WindSpeed9am -0.015476076396479027
Location WindSpeed3pm -0.08075139464359571
Location Humidity9am -0.1404196925852295
Location Humidity3pm -0.08130458868280568
Location Pressure9am -0.1017916765337633
Location Pressure3pm -0.1054963294188902
Location Cloud9am 0.06978253871787489
Location Cloud3pm 0.05492245824912861
Location Temp9am 0.11312842634840445
Location Temp3pm 0.0896676400881381
Location RainToday -0.024010912962328032
Location RISK_MM 8.320005124659872E-4
2.2 Decision Tree Model
In this section, a decision tree model is built by using Rapid Miner. A decision tree model is
utilized to predict tomorrow’s rainfall depending on today’s weather condition and the appropriate
dataset of data mining operators (Bramer, 2017). The decision tree model utilized for a provided
dataset is represented below.
8
Paraphrase This Document
Need a fresh take? Get an instant paraphrase of this document with our AI Paraphraser

The below figure represents the decision tree’s output.
The description of the decision tree is presented as below.
Humidity3pm = ?
| RainToday = NA
| | MinTemp = ?
| | | Pressure9am = ?: NA {No=16, Yes=24, NA=1004}
| | | Pressure9am > 1008.700: No {No=11, Yes=2, NA=4}
| | | Pressure9am ≤ 1008.700: Yes {No=0, Yes=6, NA=2}
| | MinTemp > 6.800
| | | MaxTemp = ?: NA {No=0, Yes=0, NA=6}
| | | MaxTemp > 18.600: NA {No=15, Yes=7, NA=33}
| | | MaxTemp ≤ 18.600: Yes {No=0, Yes=3, NA=1}
| | MinTemp ≤ 6.800: No {No=9, Yes=7, NA=1}
| RainToday = No
| | MaxTemp = ?: No {No=108, Yes=8, NA=40}
| | MaxTemp > -0.150
| | | MaxTemp > 7.600: No {No=1739, Yes=346, NA=33}
| | | MaxTemp ≤ 7.600
| | | | MinTemp > -4.200
| | | | | MinTemp > -3.600: Yes {No=12, Yes=20, NA=4}
9

| | | | | MinTemp ≤ -3.600: NA {No=0, Yes=0, NA=2}
| | | | MinTemp ≤ -4.200: No {No=3, Yes=0, NA=0}
| | MaxTemp ≤ -0.150: Yes {No=1, Yes=2, NA=2}
| RainToday = Yes: Yes {No=368, Yes=410, NA=42}
Humidity3pm > 83.500
| Temp3pm > 36.400: No {No=8, Yes=0, NA=0}
| Temp3pm ≤ 36.400: Yes {No=1711, Yes=7555, NA=223}
Humidity3pm ≤ 83.500: No {No=100492, Yes=21893, NA=2134}
2.3 Logistic Regression Model
Here, a logistic regression Model is built to predict tomorrow’s rainfall depending on today’s
weather conditions and appropriate dataset of data mining operators, by using Rapid Miner. The
logistic Regression model for provided data set is illustrated as below (Han, Kamber and Pei, 2012).
10
⊘ This is a preview!⊘
Do you want full access?
Subscribe today to unlock all pages.

Trusted by 1+ million students worldwide
1 out of 26
Related Documents

Your All-in-One AI-Powered Toolkit for Academic Success.
+13062052269
info@desklib.com
Available 24*7 on WhatsApp / Email
Unlock your academic potential
Copyright © 2020–2025 A2Z Services. All Rights Reserved. Developed and managed by ZUCOL.