Enterprise Resource Report: Data Warehouse, Excel, and Dashboards
VerifiedAdded on 2019/10/16
|10
|2253
|260
Report
AI Summary
This report provides a comprehensive overview of enterprise resource planning, focusing on data warehousing, Online Transactional Processing (OLTP) systems, and the advantages of using Excel for reporting and analysis. It details the structure of a data warehouse, including the creation of fact and dimension tables, and demonstrates how to build queries to retrieve data for decision-making. The report also covers the creation of dashboards using Excel, including the implementation of filters, joins between sheets, and the use of pivot tables for data visualization. It analyzes sales data, customer segments, and regional performance through charts and graphs, concluding with the application of these techniques to improve business insights and forecasting. The report references various sources to support the concepts discussed.
Enterprise Resource Report
Introduction:
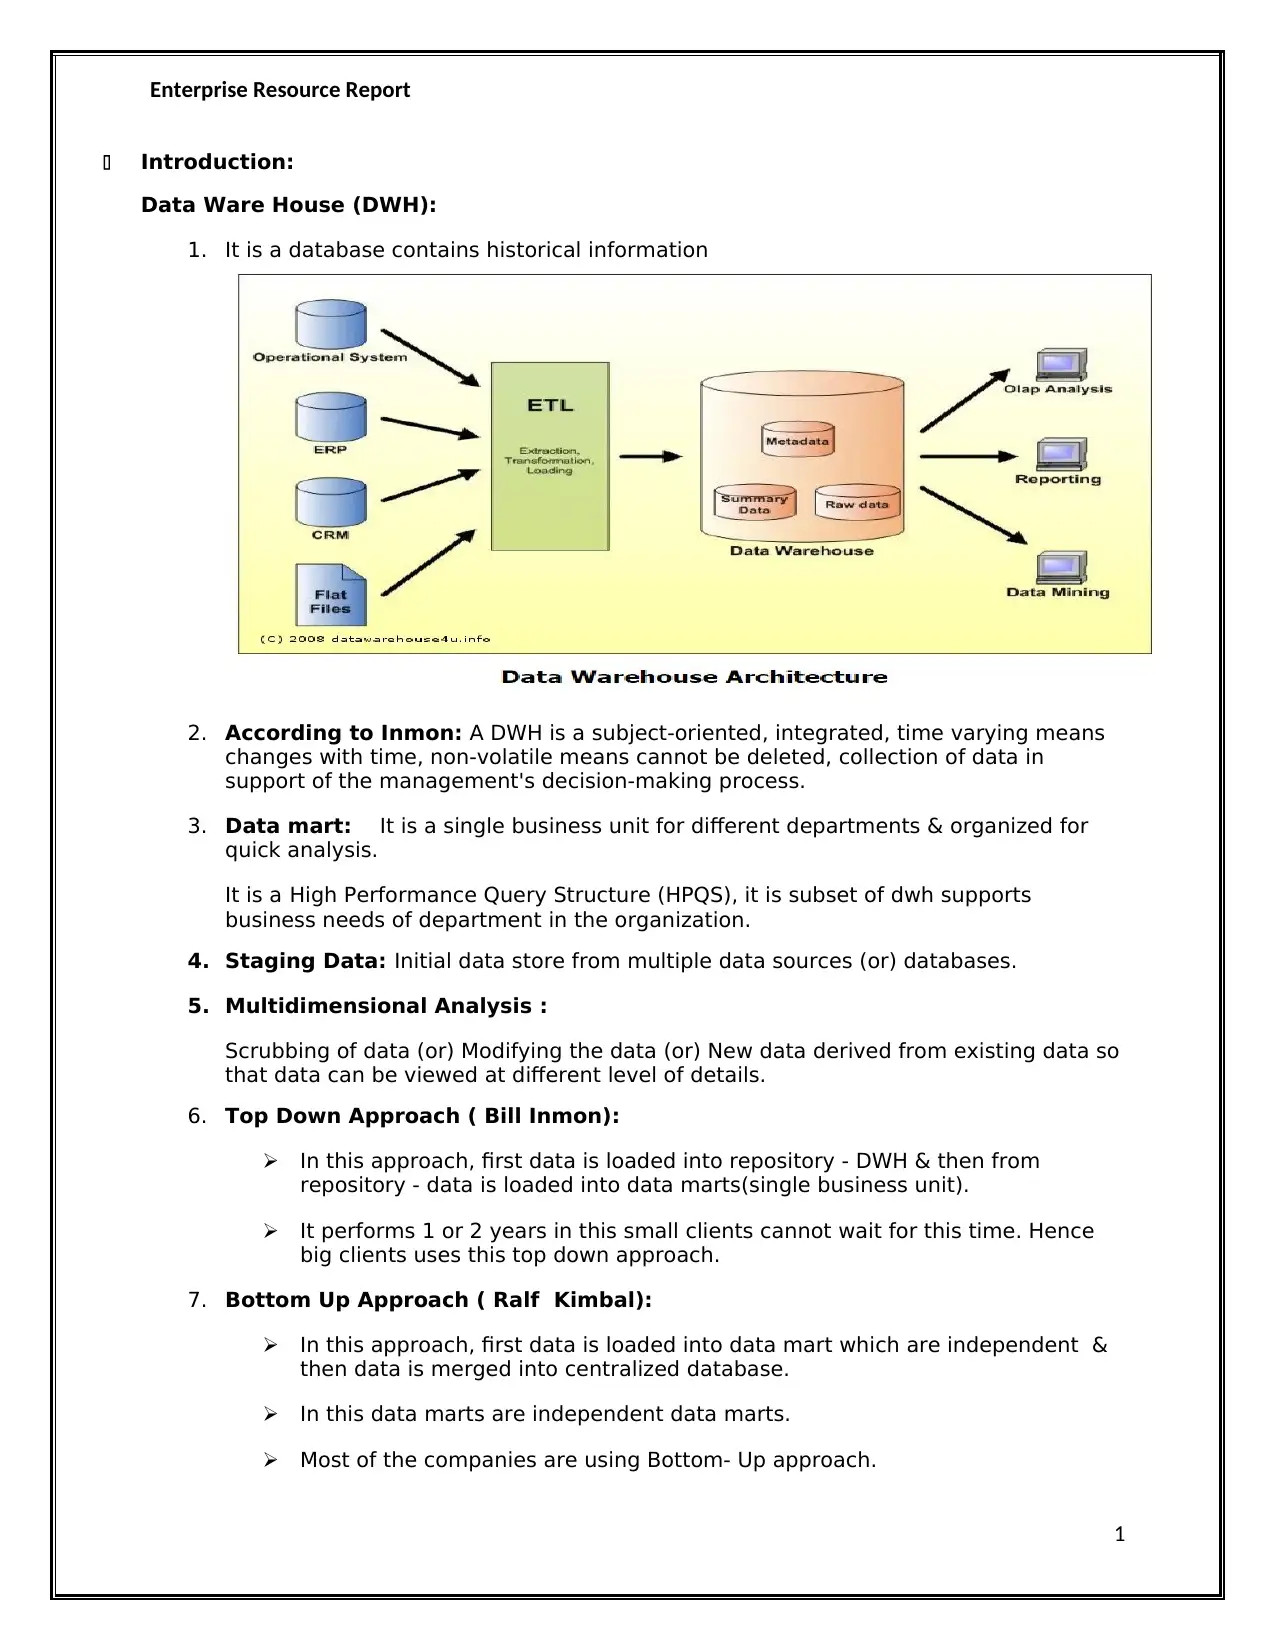
Data Ware House (DWH):
1. It is a database contains historical information
2. According to Inmon: A DWH is a subject-oriented, integrated, time varying means
changes with time, non-volatile means cannot be deleted, collection of data in
support of the management's decision-making process.
3. Data mart: It is a single business unit for different departments & organized for
quick analysis.
It is a High Performance Query Structure (HPQS), it is subset of dwh supports
business needs of department in the organization.
4. Staging Data: Initial data store from multiple data sources (or) databases.
5. Multidimensional Analysis :
Scrubbing of data (or) Modifying the data (or) New data derived from existing data so
that data can be viewed at different level of details.
6. Top Down Approach ( Bill Inmon):
In this approach, first data is loaded into repository - DWH & then from
repository - data is loaded into data marts(single business unit).
It performs 1 or 2 years in this small clients cannot wait for this time. Hence
big clients uses this top down approach.
7. Bottom Up Approach ( Ralf Kimbal):
In this approach, first data is loaded into data mart which are independent &
then data is merged into centralized database.
In this data marts are independent data marts.
Most of the companies are using Bottom- Up approach.
1
Introduction:
Data Ware House (DWH):
1. It is a database contains historical information
2. According to Inmon: A DWH is a subject-oriented, integrated, time varying means
changes with time, non-volatile means cannot be deleted, collection of data in
support of the management's decision-making process.
3. Data mart: It is a single business unit for different departments & organized for
quick analysis.
It is a High Performance Query Structure (HPQS), it is subset of dwh supports
business needs of department in the organization.
4. Staging Data: Initial data store from multiple data sources (or) databases.
5. Multidimensional Analysis :
Scrubbing of data (or) Modifying the data (or) New data derived from existing data so
that data can be viewed at different level of details.
6. Top Down Approach ( Bill Inmon):
In this approach, first data is loaded into repository - DWH & then from
repository - data is loaded into data marts(single business unit).
It performs 1 or 2 years in this small clients cannot wait for this time. Hence
big clients uses this top down approach.
7. Bottom Up Approach ( Ralf Kimbal):
In this approach, first data is loaded into data mart which are independent &
then data is merged into centralized database.
In this data marts are independent data marts.
Most of the companies are using Bottom- Up approach.
1
Paraphrase This Document
Need a fresh take? Get an instant paraphrase of this document with our AI Paraphraser
Enterprise Resource Report
OLTP (ONLINE TRANSACTIONAL PROCESSING)
It records daily operations & transactions of a business
OLTP System deals with operational data. Operational data are those data involved
in the operation of a particular system.
In an OLTP system data are frequently updated and queried. So quick response to a
request is highly expected. Since the OLTP systems involve large number of update
queries, the database tables are optimized for write operations.
Except DWH Tables other database tables are OLTP’s.
Part – A
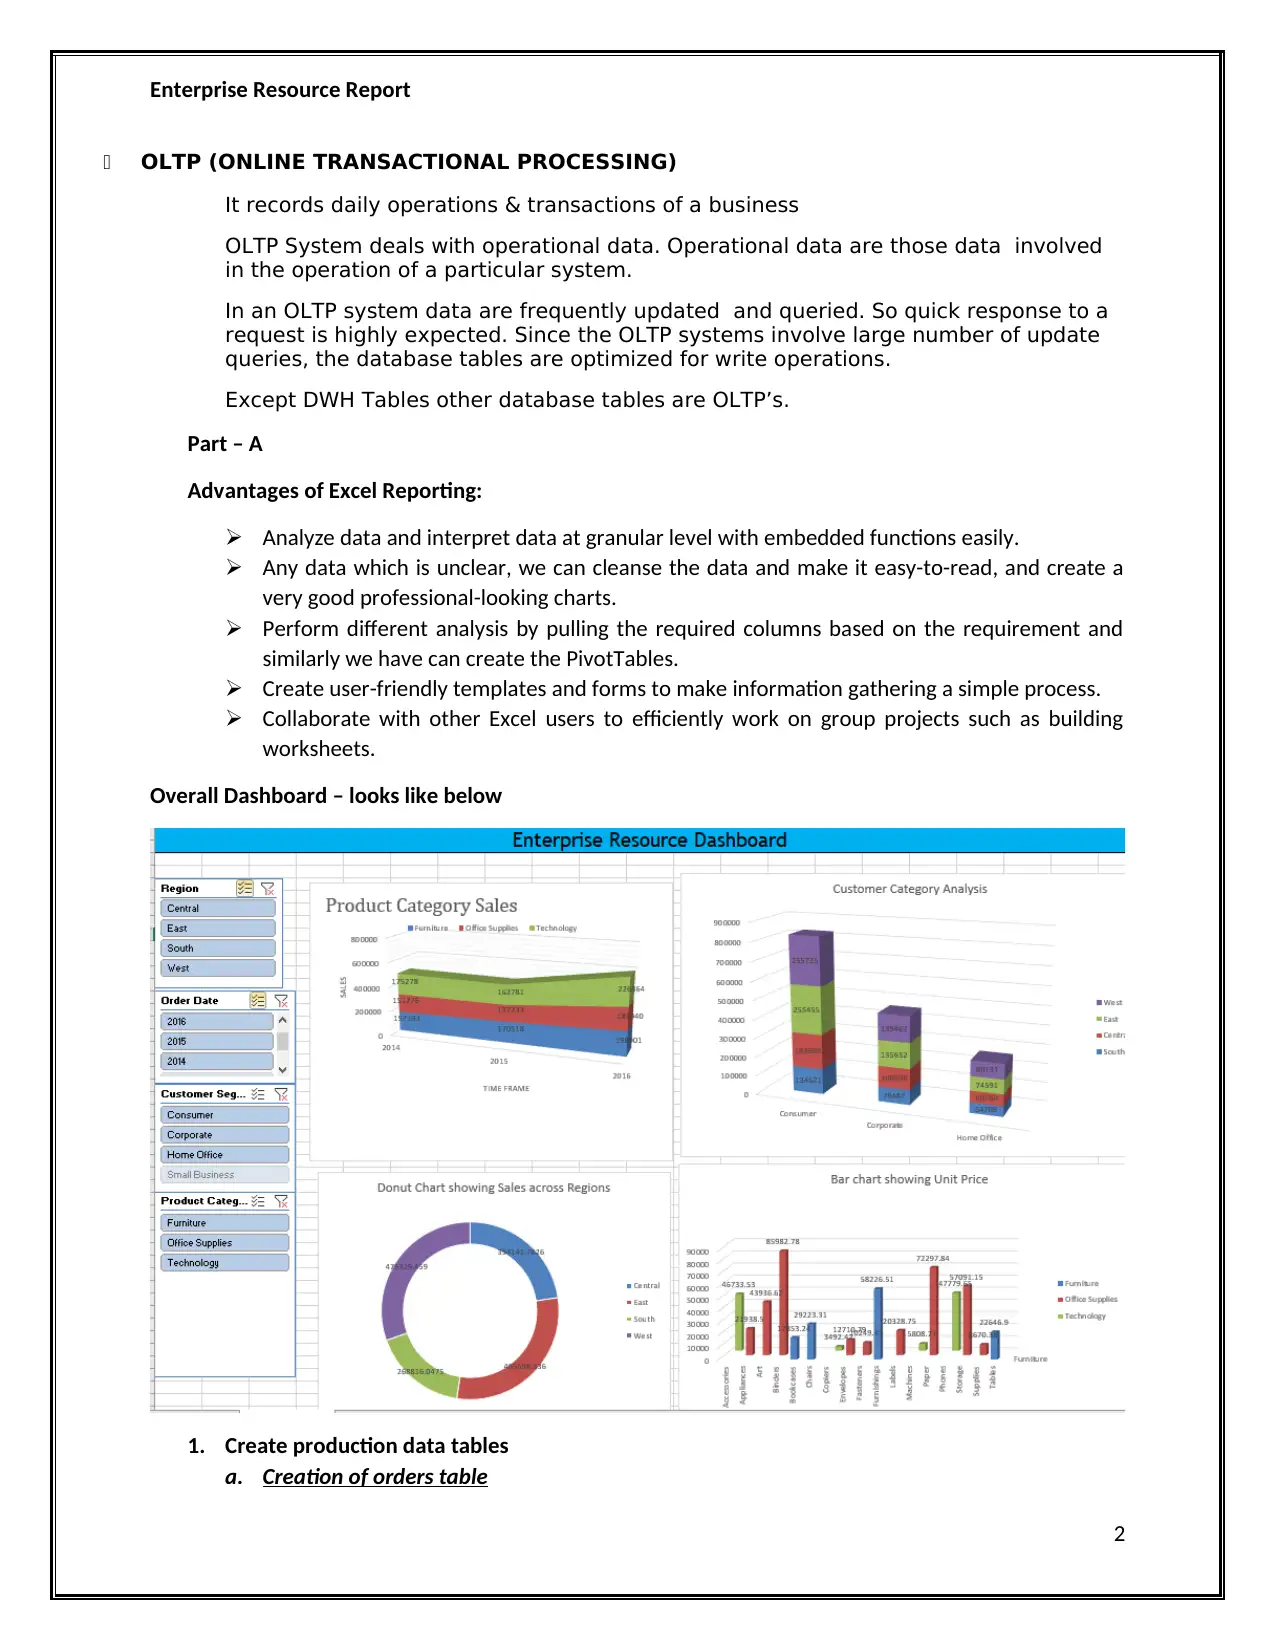
Advantages of Excel Reporting:
Analyze data and interpret data at granular level with embedded functions easily.
Any data which is unclear, we can cleanse the data and make it easy-to-read, and create a
very good professional-looking charts.
Perform different analysis by pulling the required columns based on the requirement and
similarly we have can create the PivotTables.
Create user-friendly templates and forms to make information gathering a simple process.
Collaborate with other Excel users to efficiently work on group projects such as building
worksheets.
Overall Dashboard – looks like below
1. Create production data tables
a. Creation of orders table
2
OLTP (ONLINE TRANSACTIONAL PROCESSING)
It records daily operations & transactions of a business
OLTP System deals with operational data. Operational data are those data involved
in the operation of a particular system.
In an OLTP system data are frequently updated and queried. So quick response to a
request is highly expected. Since the OLTP systems involve large number of update
queries, the database tables are optimized for write operations.
Except DWH Tables other database tables are OLTP’s.
Part – A
Advantages of Excel Reporting:
Analyze data and interpret data at granular level with embedded functions easily.
Any data which is unclear, we can cleanse the data and make it easy-to-read, and create a
very good professional-looking charts.
Perform different analysis by pulling the required columns based on the requirement and
similarly we have can create the PivotTables.
Create user-friendly templates and forms to make information gathering a simple process.
Collaborate with other Excel users to efficiently work on group projects such as building
worksheets.
Overall Dashboard – looks like below
1. Create production data tables
a. Creation of orders table
2
Enterprise Resource Report
create table orders_table ( Order_ID int, Order_Date Date, Customer_Name varchar,
Customer_Segment Short Text, City Short Text, State_or_Province Short Text,
Region Short Text, Product_Category Short Text, Product_Sub-Category Short Text,
Product_Name Short Text, Sales Int, Discount Int, Profit Int, Unit_Price Int)
b. In the above table we are creating the table with column names and declare the data type
for those columns with table name.
c. It includes Order_ID, which will be unique for every order, Order_Date will be same for the
customers who have ordered the products in different category.
d. Creation of order_returns table;
Create table Order_returns_table (OrderID int, flag varchar)
In the above table is created to old the OrderID and flag which show the status of the
Order.
2. Decide on the relevant dimensions required for the data warehouse, and then create tables
to store the dimensions of a data warehouse.
create table orders_dimension (OrderID int, OrderDate Date, CustomerCategory Short Text,
Region Short Text, ProductCategory Short Text)
In this case, this I am selecting the specific columns which are treated as dimensions and pulled
the column which act as primary key to make a join for any other table like return. And the table
name is orders_dimension table act as dimension.
In this table OrderID, OrderDate CustomerCategory, region, ProductCategory are pulled as
dimensions.
3. Decide what facts are required and then create tables to store these facts
create table orders_fact_sales (OrderID int, Sales Int, Discount Int, Profit Int, UnitPrice Int)
In this case, a table is created for the purpose of measures and the table name is
orders_fact_sales and the columns are OrderID which is used to make a join if required with the
other tabs like dimension table and also pulled the other columns like sales, discount, profit and
Unit_Price as different measures.
4. Create a data warehouse via a query that joins the dimension and fact tables.
create table orders_dim_fact_vw(OrderID int, OrderDate Date, CustomerCategory Short Text,
Region Short Text, ProductCategory Short Text, , Sales Int, Discount Int, Profit Int, Unit_Price
Int) as
(select a.Order_ID, a.Order_Date, a.Customer_Segment, a.Region, a.Product_Category, a.status
from orders_dimension a left outer join orders_fact_sales b on a.OrderID = b.OrderID
3
⊘ This is a preview!⊘
Do you want full access?
Subscribe today to unlock all pages.
Trusted by 1+ million students worldwide
Enterprise Resource Report
5. Create queries designed to retrieve data (for use in forms or reports) from the data
warehouse in support of specific decision-making activities.
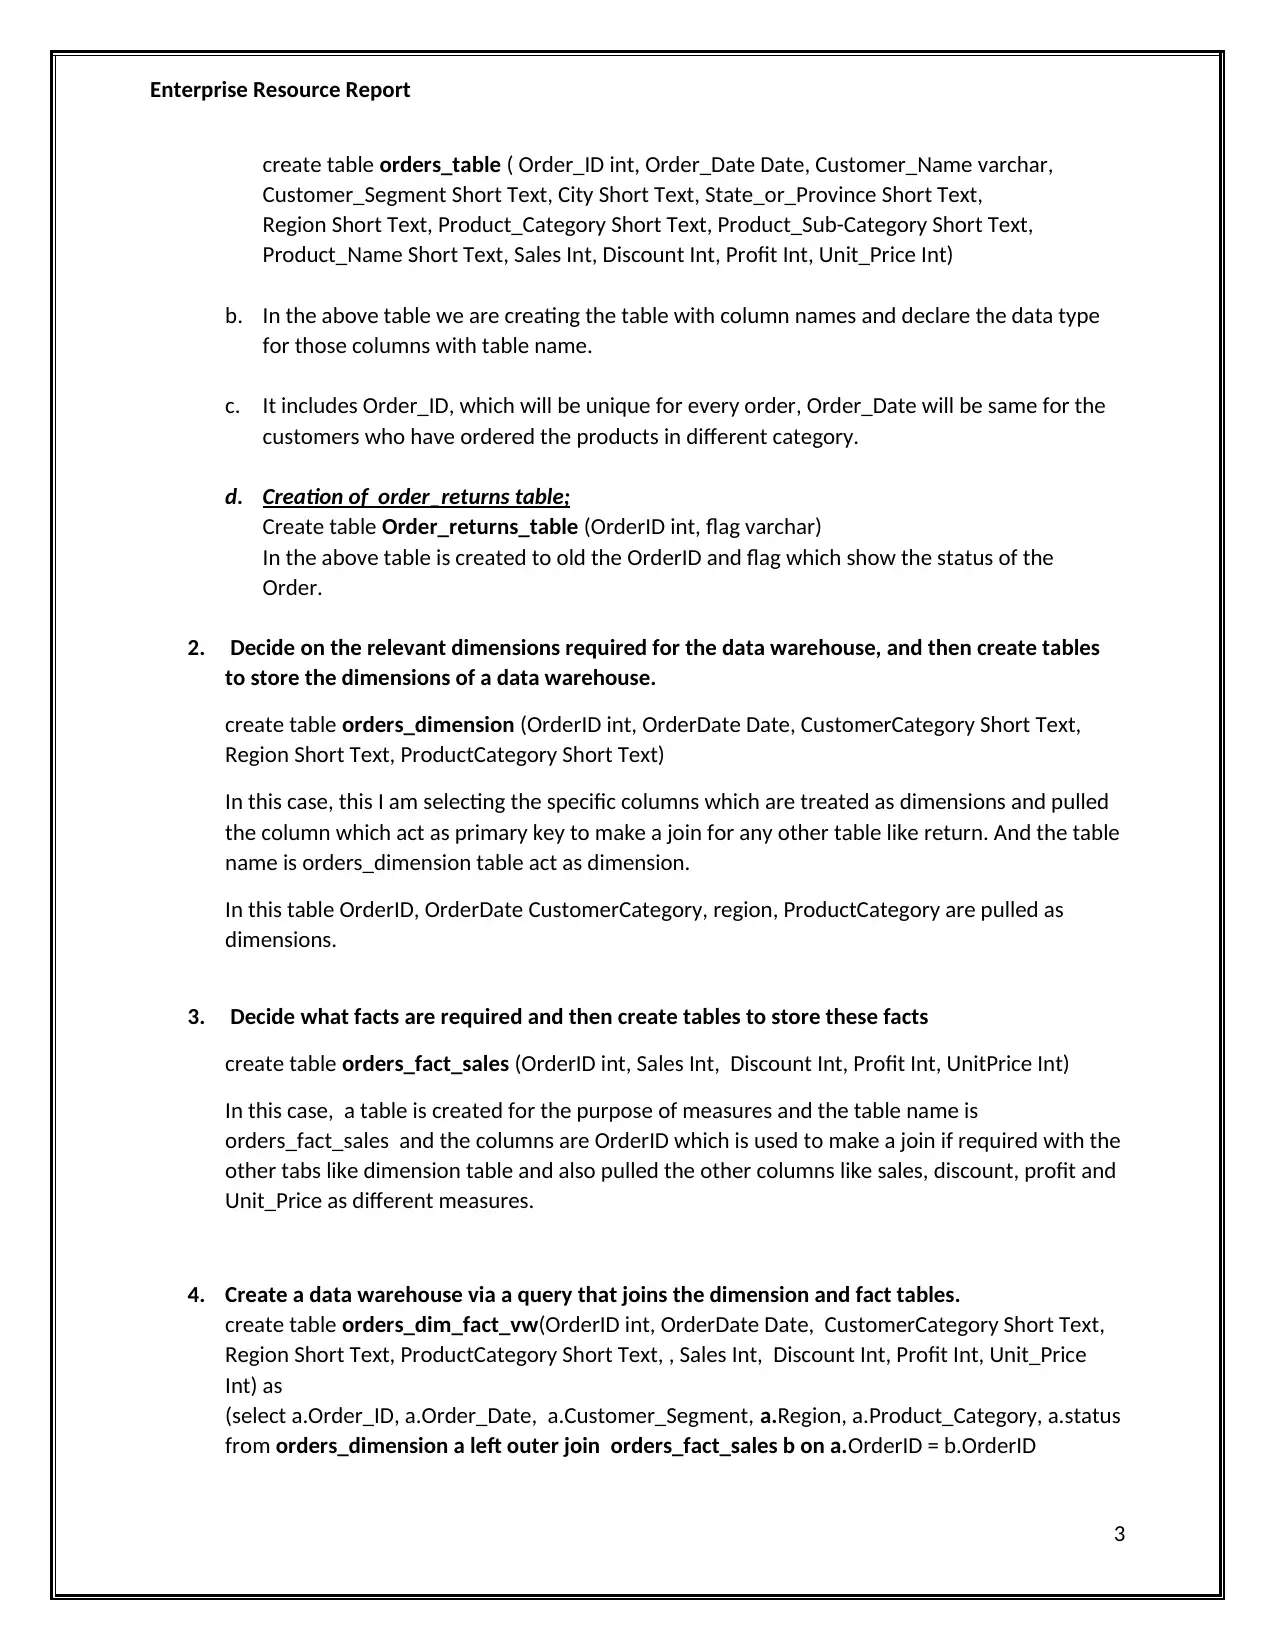
Line chart analysis:
select year(Order_Date),quarter(Order_Date),Product_Category, sum(sales) from
orders_dim_fact
group by year(Order_Date),quarter(Order_Date),Product_Category
It shows product category sales, we are able to see the data year wise - quarter wise for the
product category how the sales are present
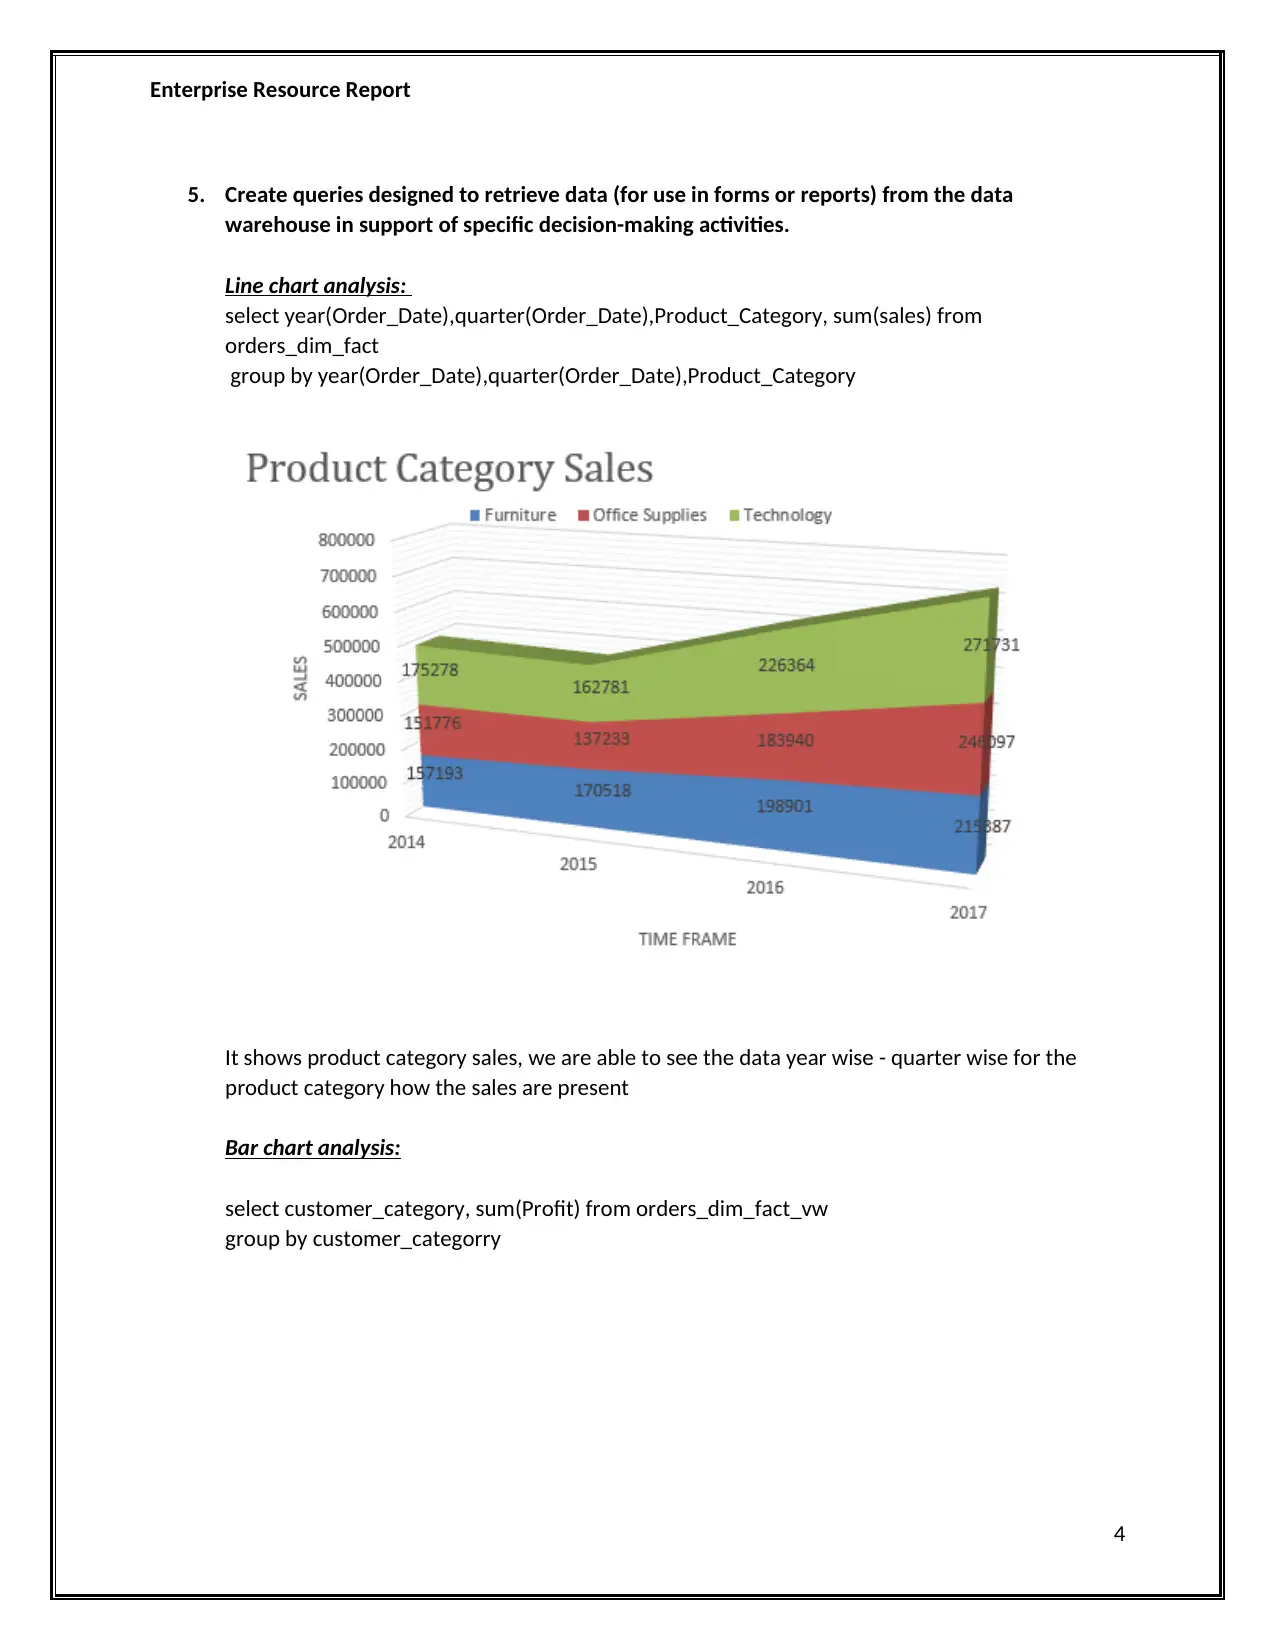
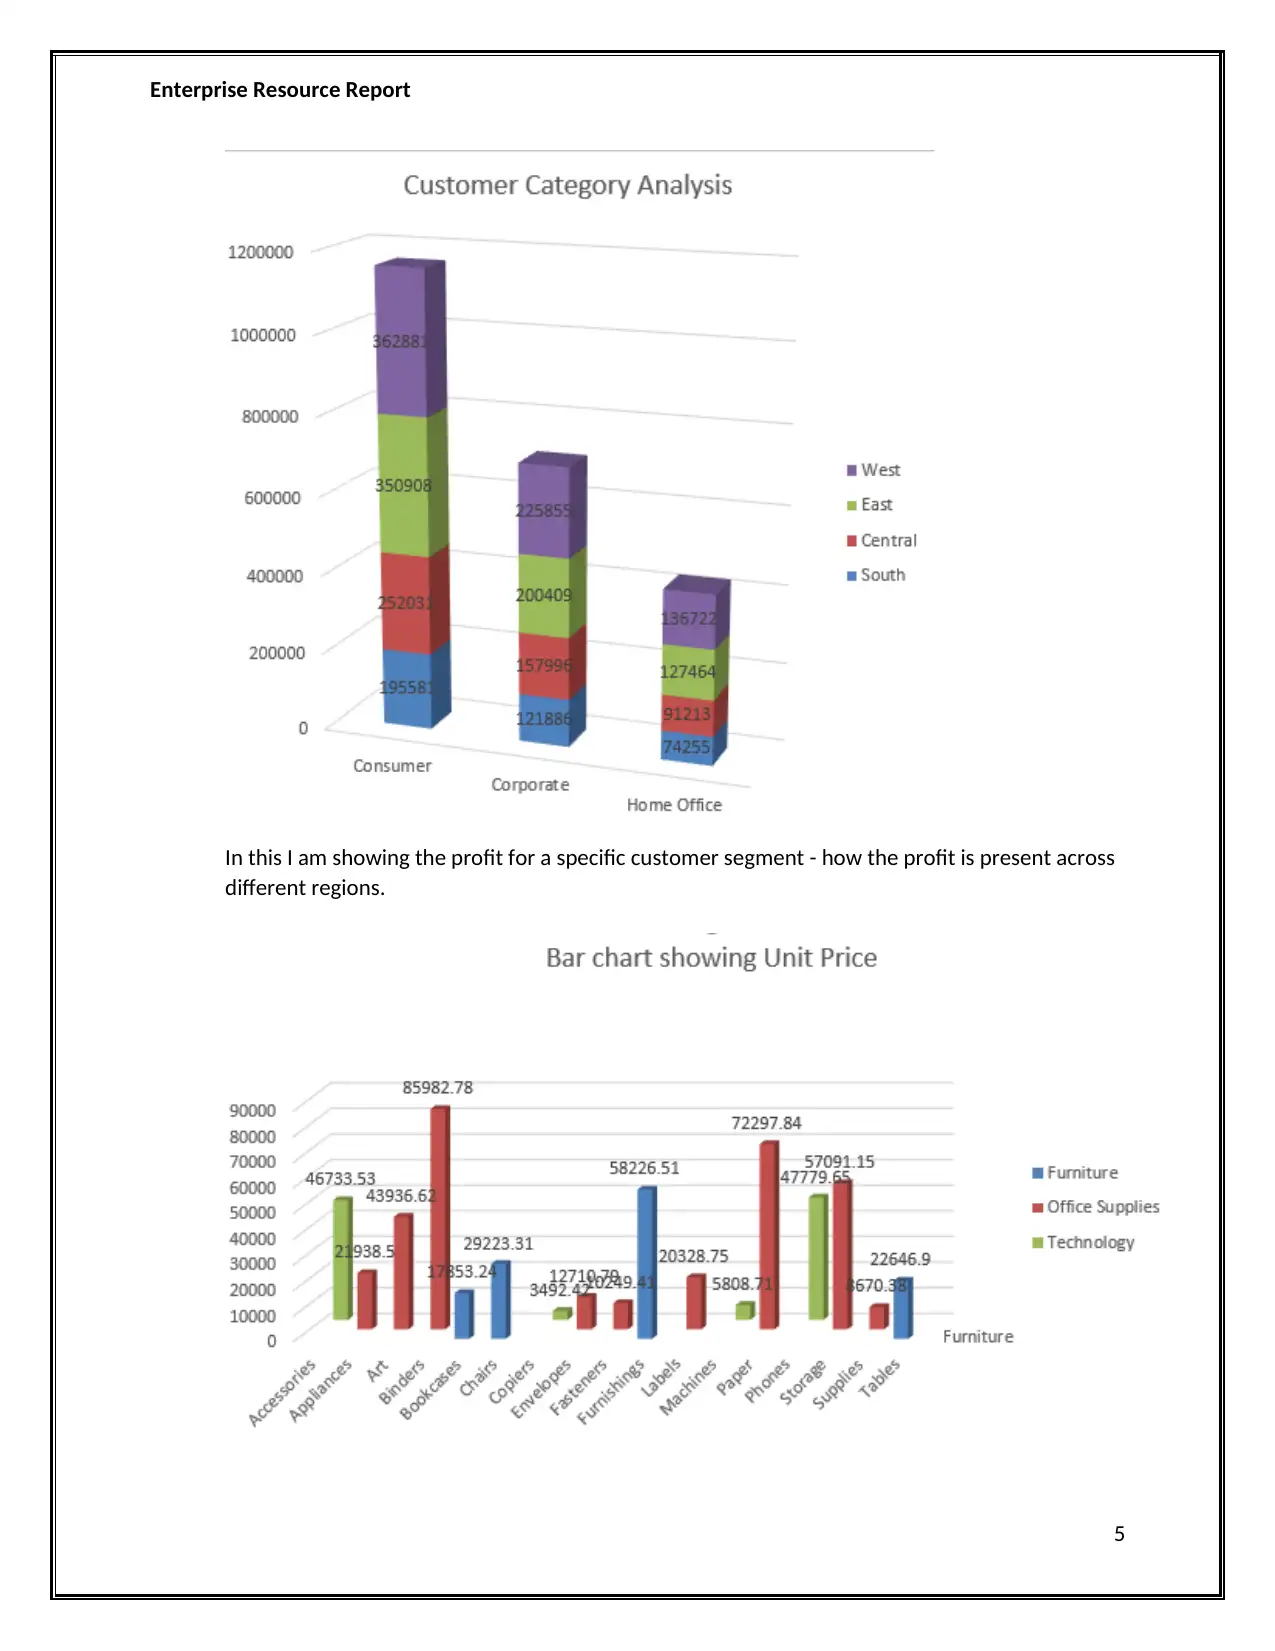
Bar chart analysis:
select customer_category, sum(Profit) from orders_dim_fact_vw
group by customer_categorry
4
5. Create queries designed to retrieve data (for use in forms or reports) from the data
warehouse in support of specific decision-making activities.
Line chart analysis:
select year(Order_Date),quarter(Order_Date),Product_Category, sum(sales) from
orders_dim_fact
group by year(Order_Date),quarter(Order_Date),Product_Category
It shows product category sales, we are able to see the data year wise - quarter wise for the
product category how the sales are present
Bar chart analysis:
select customer_category, sum(Profit) from orders_dim_fact_vw
group by customer_categorry
4
Paraphrase This Document
Need a fresh take? Get an instant paraphrase of this document with our AI Paraphraser
Enterprise Resource Report
In this I am showing the profit for a specific customer segment - how the profit is present across
different regions.
5
In this I am showing the profit for a specific customer segment - how the profit is present across
different regions.
5
Enterprise Resource Report
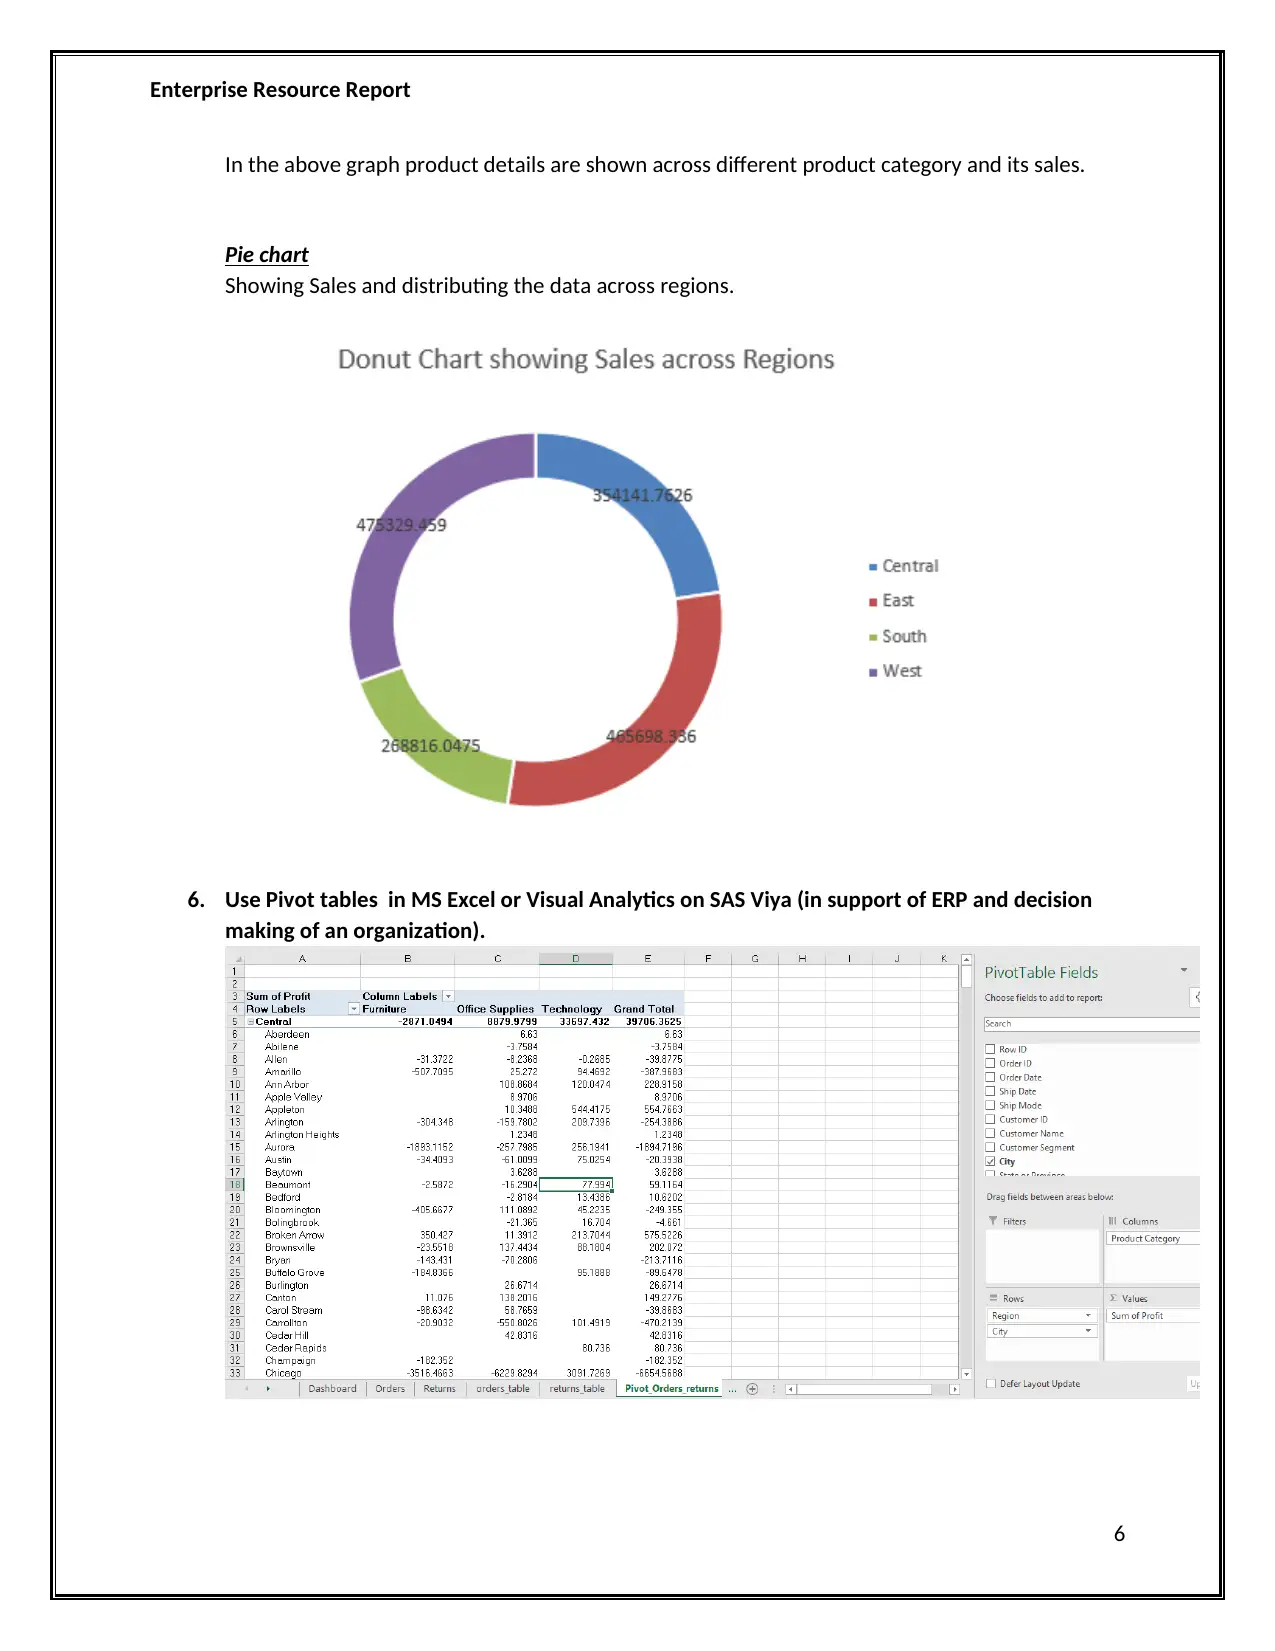
In the above graph product details are shown across different product category and its sales.
Pie chart
Showing Sales and distributing the data across regions.
6. Use Pivot tables in MS Excel or Visual Analytics on SAS Viya (in support of ERP and decision
making of an organization).
6
In the above graph product details are shown across different product category and its sales.
Pie chart
Showing Sales and distributing the data across regions.
6. Use Pivot tables in MS Excel or Visual Analytics on SAS Viya (in support of ERP and decision
making of an organization).
6
⊘ This is a preview!⊘
Do you want full access?
Subscribe today to unlock all pages.
Trusted by 1+ million students worldwide
Enterprise Resource Report
I have created a separate pivot on the two tables orders and returns after make a join and
merging to a table orders_returns and i have done pivot on this table and the sheet name is
Pivot_Orders_Returns.
In this sheet, you can able to pull the required columns as dimension either in rows /columns
and put the fact/measure values in the Values to show the distribution of metrics across
different dimensions
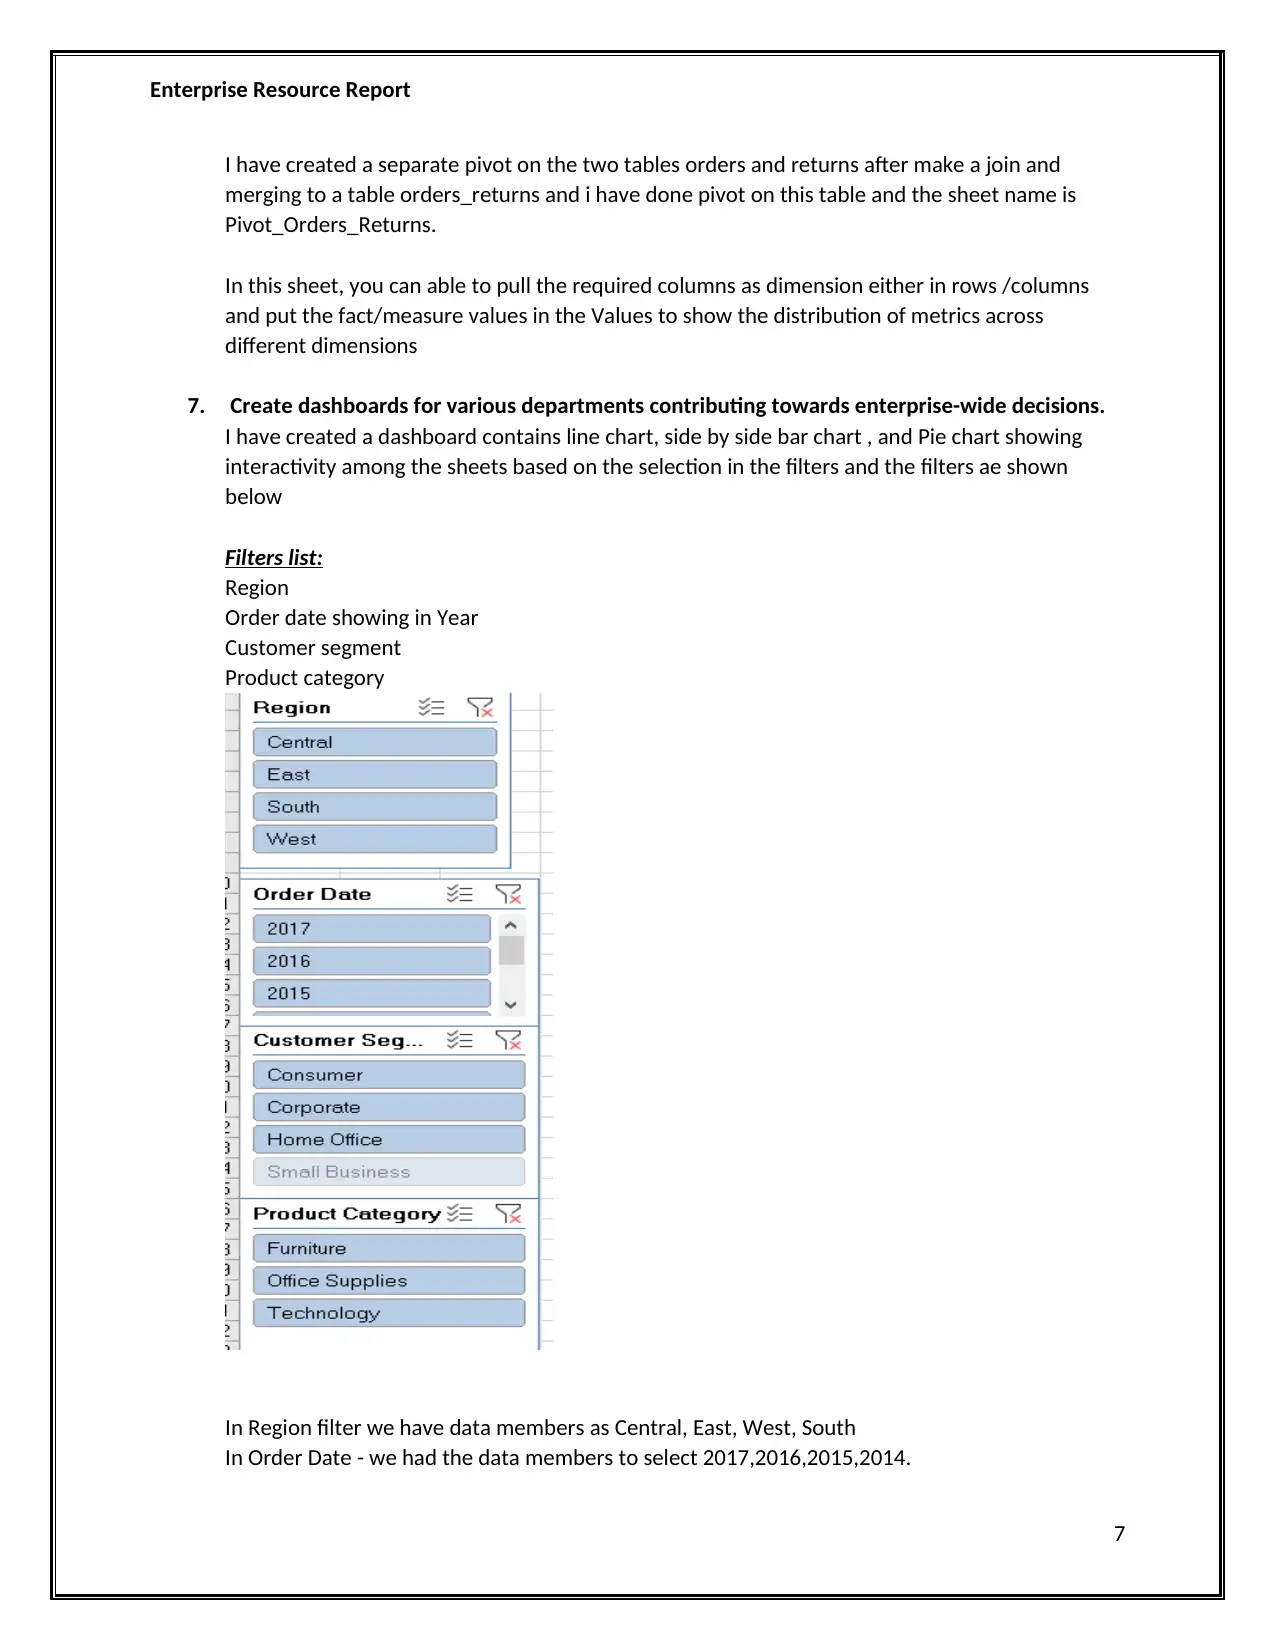
7. Create dashboards for various departments contributing towards enterprise-wide decisions.
I have created a dashboard contains line chart, side by side bar chart , and Pie chart showing
interactivity among the sheets based on the selection in the filters and the filters ae shown
below
Filters list:
Region
Order date showing in Year
Customer segment
Product category
In Region filter we have data members as Central, East, West, South
In Order Date - we had the data members to select 2017,2016,2015,2014.
7
I have created a separate pivot on the two tables orders and returns after make a join and
merging to a table orders_returns and i have done pivot on this table and the sheet name is
Pivot_Orders_Returns.
In this sheet, you can able to pull the required columns as dimension either in rows /columns
and put the fact/measure values in the Values to show the distribution of metrics across
different dimensions
7. Create dashboards for various departments contributing towards enterprise-wide decisions.
I have created a dashboard contains line chart, side by side bar chart , and Pie chart showing
interactivity among the sheets based on the selection in the filters and the filters ae shown
below
Filters list:
Region
Order date showing in Year
Customer segment
Product category
In Region filter we have data members as Central, East, West, South
In Order Date - we had the data members to select 2017,2016,2015,2014.
7
Paraphrase This Document
Need a fresh take? Get an instant paraphrase of this document with our AI Paraphraser
Enterprise Resource Report
In Customer Segment - we had the data members to select Consumer, Corporate, Home Offices,
Small Business
In Product category - we had the data members to select Furniture, Office Supplies, Technology.
We can make single select and also multi select which are shown in the filter options
If we go with multiple selection at a time we can able to select multiple data members in the
filter.
Join implementation between the sheets:
In making the joins between the sheets, i have converted the order sheet into Table
with name orders_table and similarly do for the returns sheet conversion to
returns_table
In order to maintain the join between the tables - i go to the query tab - make sure at
least one cell should be selected and chosen the orders_table as table 1 and selected
one of the column Order_ID as primary key and then select the other table
returns_table and also select the common column with almost common data Order_ID
select the join condition as Left outer join/right outer join /inner join/ full outer join
make sure how we need to pull the data.
I have selected left outer join to pull all the records from orders_table and common
records from returns_table.
Before making join on specific /common column between tables orders_table and
returns_table we should also make sure the data and the datatype should be same, else
it throws the error. and join will not able to make.
Getting Data into Excel – Analyze – Reporting – Conclusion
In general, I get the data from the internet sources, and copy the data to text file or
excel and understand or analyze the data slowly end to end.
After analysis I will try to segregate the data as dimensions, facts, attributes, master
data etc.
Based on that next level will be identifying the common or important columns which
play the role in deciding the business decision.
Make them as primary key and if required make a join with other data source.
For example we have filters like region, customer segment, year, product, product
category etc, when we apply filter then entire objects in the dashboard like bar chart,
line chart, stacked bar, donut chart etc should vary
And some of the filters is selected already then, its information will get hosing in the
dashboard on top of that we can apply other filters in order to get slice/insight of data.
Currently we have different measures like sales, unit price, profit, discount, margin etc
which helps the business to see the insight of their business across different dimensions
like region, year, product category, product sub-category etc.
In the graph designed I have made the graph visual good and with the help of legend I
can able to segregate the different products which helps easy to recognize the sales
across different products.
8
Enterprise Resource Report
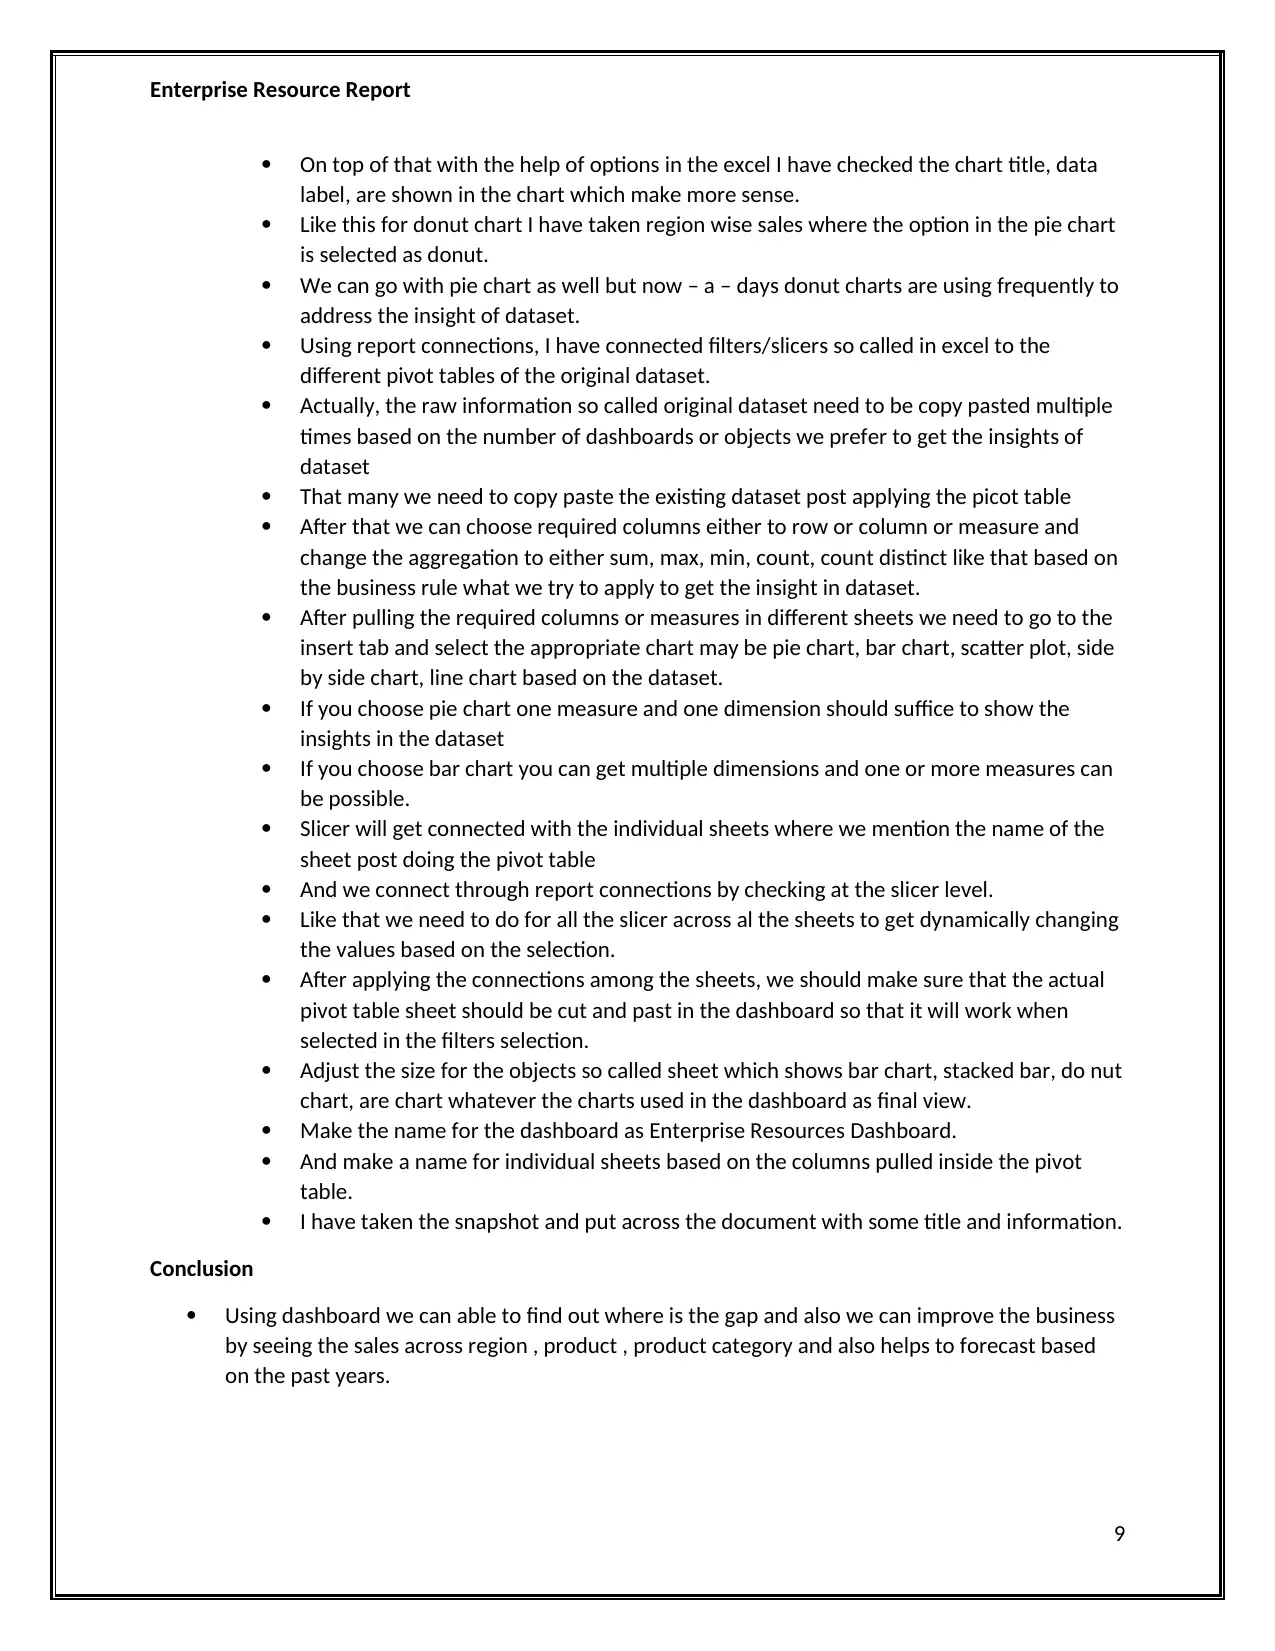
On top of that with the help of options in the excel I have checked the chart title, data
label, are shown in the chart which make more sense.
Like this for donut chart I have taken region wise sales where the option in the pie chart
is selected as donut.
We can go with pie chart as well but now – a – days donut charts are using frequently to
address the insight of dataset.
Using report connections, I have connected filters/slicers so called in excel to the
different pivot tables of the original dataset.
Actually, the raw information so called original dataset need to be copy pasted multiple
times based on the number of dashboards or objects we prefer to get the insights of
dataset
That many we need to copy paste the existing dataset post applying the picot table
After that we can choose required columns either to row or column or measure and
change the aggregation to either sum, max, min, count, count distinct like that based on
the business rule what we try to apply to get the insight in dataset.
After pulling the required columns or measures in different sheets we need to go to the
insert tab and select the appropriate chart may be pie chart, bar chart, scatter plot, side
by side chart, line chart based on the dataset.
If you choose pie chart one measure and one dimension should suffice to show the
insights in the dataset
If you choose bar chart you can get multiple dimensions and one or more measures can
be possible.
Slicer will get connected with the individual sheets where we mention the name of the
sheet post doing the pivot table
And we connect through report connections by checking at the slicer level.
Like that we need to do for all the slicer across al the sheets to get dynamically changing
the values based on the selection.
After applying the connections among the sheets, we should make sure that the actual
pivot table sheet should be cut and past in the dashboard so that it will work when
selected in the filters selection.
Adjust the size for the objects so called sheet which shows bar chart, stacked bar, do nut
chart, are chart whatever the charts used in the dashboard as final view.
Make the name for the dashboard as Enterprise Resources Dashboard.
And make a name for individual sheets based on the columns pulled inside the pivot
table.
I have taken the snapshot and put across the document with some title and information.
Conclusion
Using dashboard we can able to find out where is the gap and also we can improve the business
by seeing the sales across region , product , product category and also helps to forecast based
on the past years.
9
⊘ This is a preview!⊘
Do you want full access?
Subscribe today to unlock all pages.
Trusted by 1+ million students worldwide
Enterprise Resource Report
References:
1. https://en.wikipedia.org/wiki/Business_intelligence
2. https://whatis.techtarget.com/reference/Business-Intelligence-BI-Guides
3. https://www.tableau.com/learn/articles/business-intelligence-books
4. https://www.investopedia.com/terms/b/business-intelligence-bi.asp
5. https://ieeexplore.ieee.org/document/6923704
6. https://journals.sagepub.com/doi/abs/10.1177/1525822x08323985
7. http://www.elijournals.com/products/showproduct.asp?prodID=24&catID=1
10
1 out of 10
Related Documents


Your All-in-One AI-Powered Toolkit for Academic Success.
+13062052269
info@desklib.com
Available 24*7 on WhatsApp / Email
![[object Object]](/_next/static/media/star-bottom.7253800d.svg)
Unlock your academic potential
Copyright © 2020–2026 A2Z Services. All Rights Reserved. Developed and managed by ZUCOL.