Analysis of Business Intelligence and Reporting for Enterprises
VerifiedAdded on 2023/02/01
|9
|1225
|22
Report
AI Summary
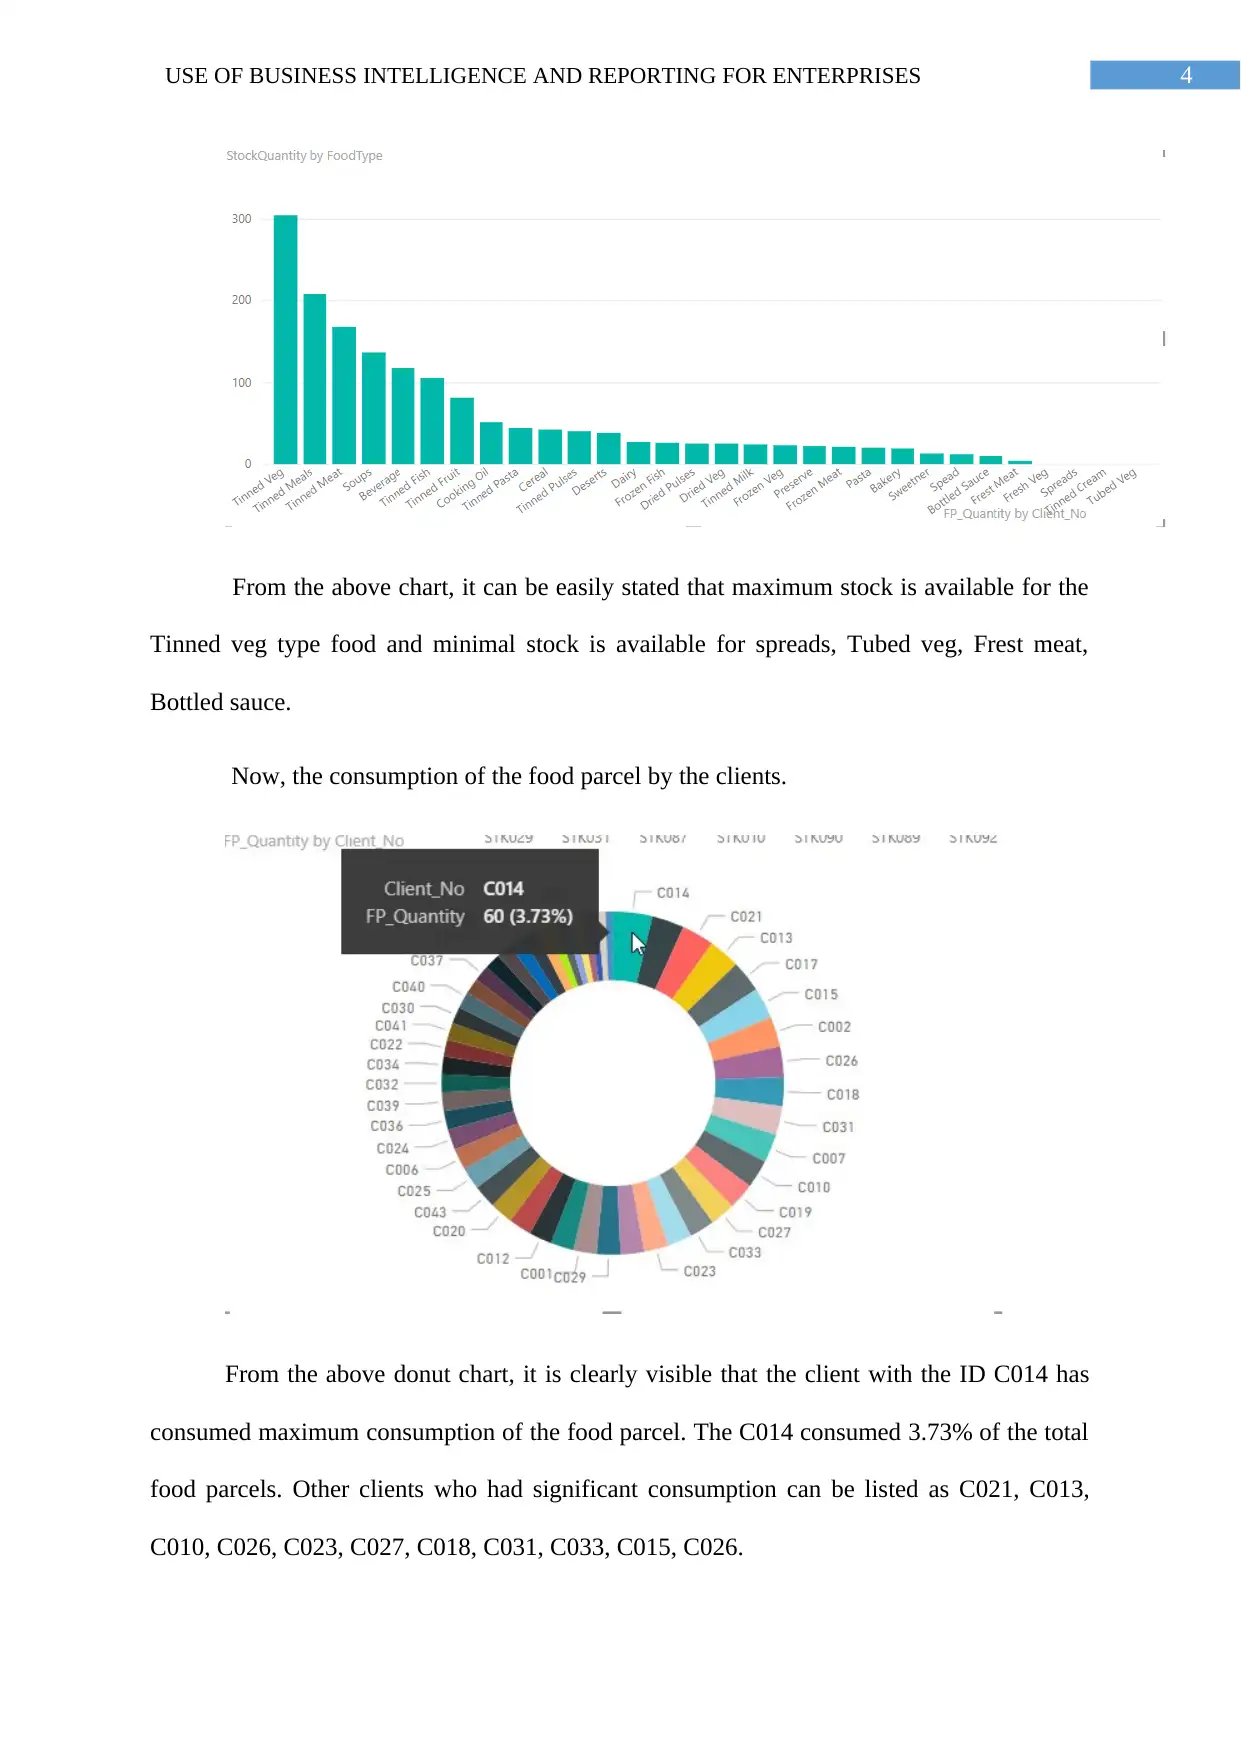
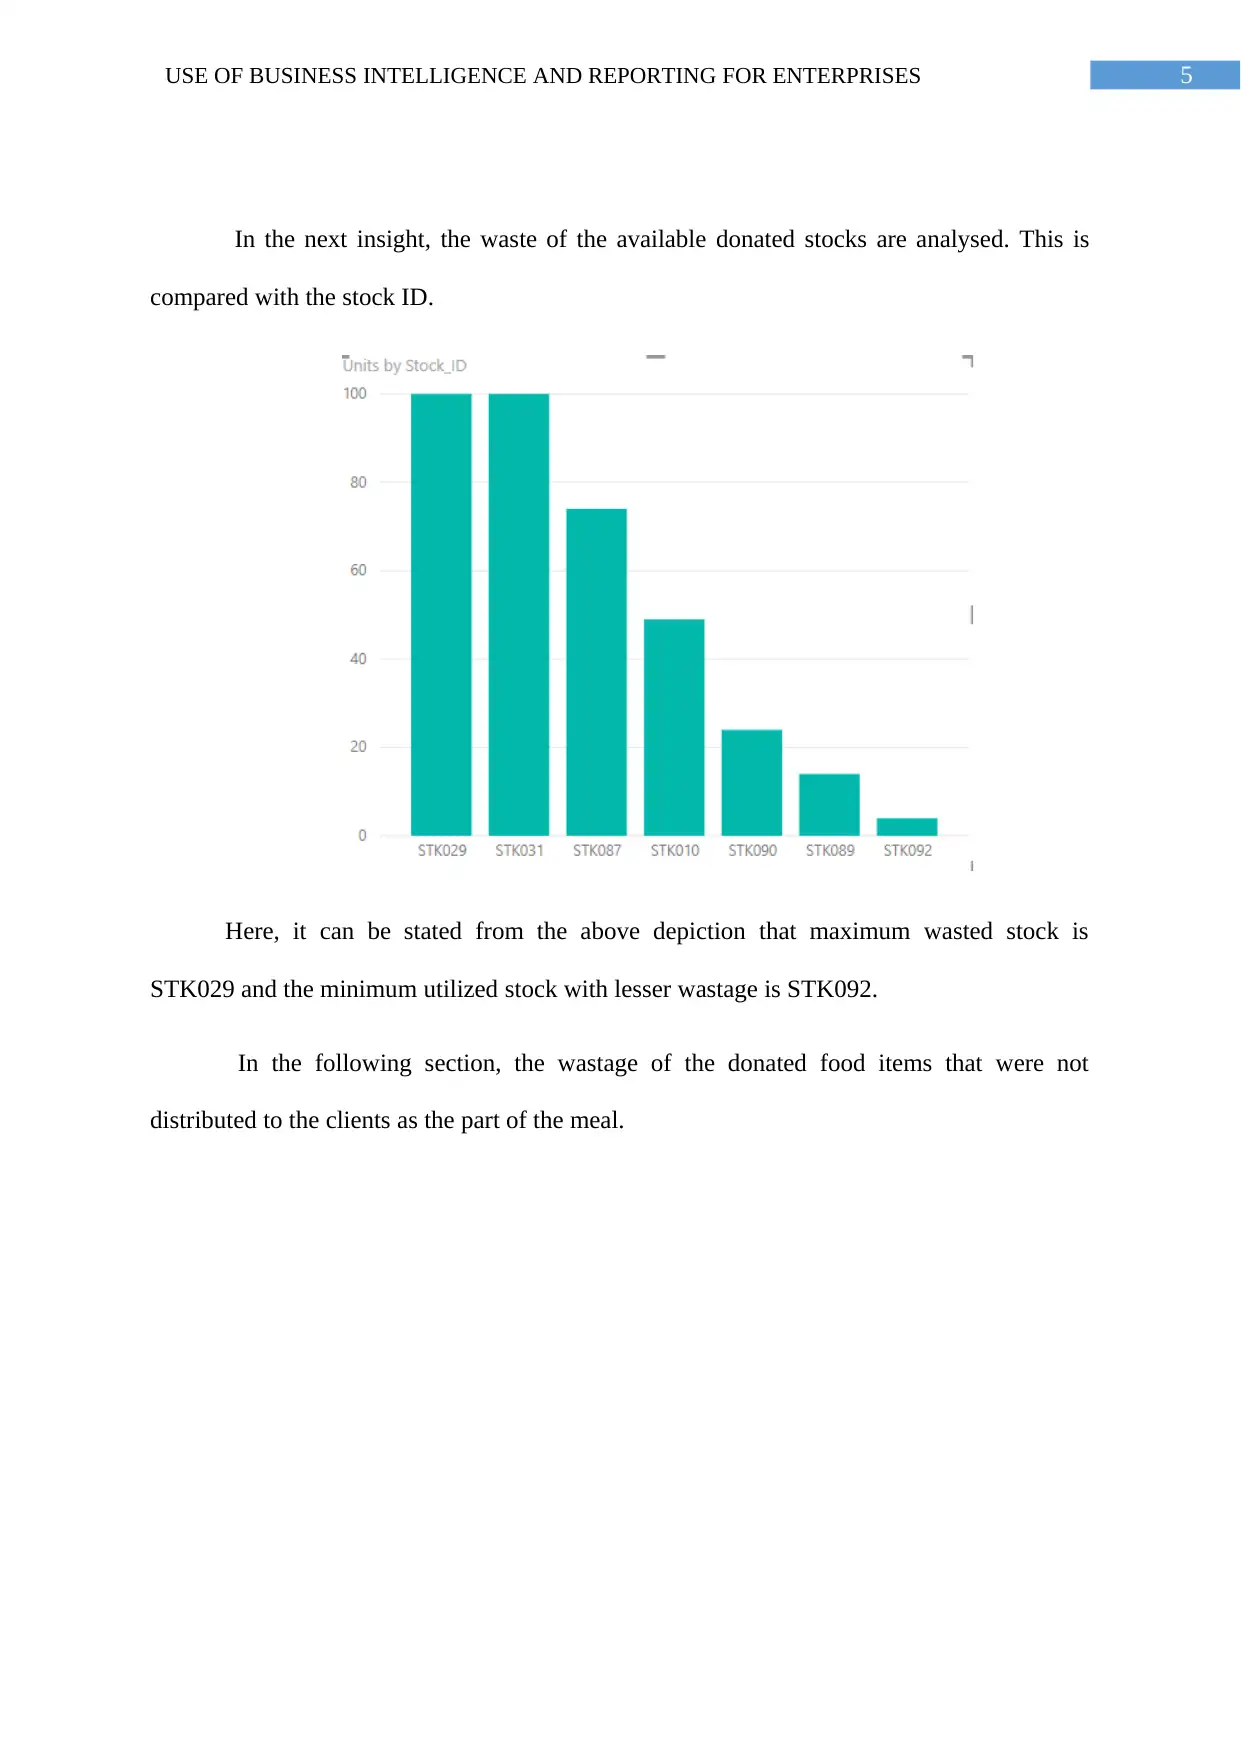
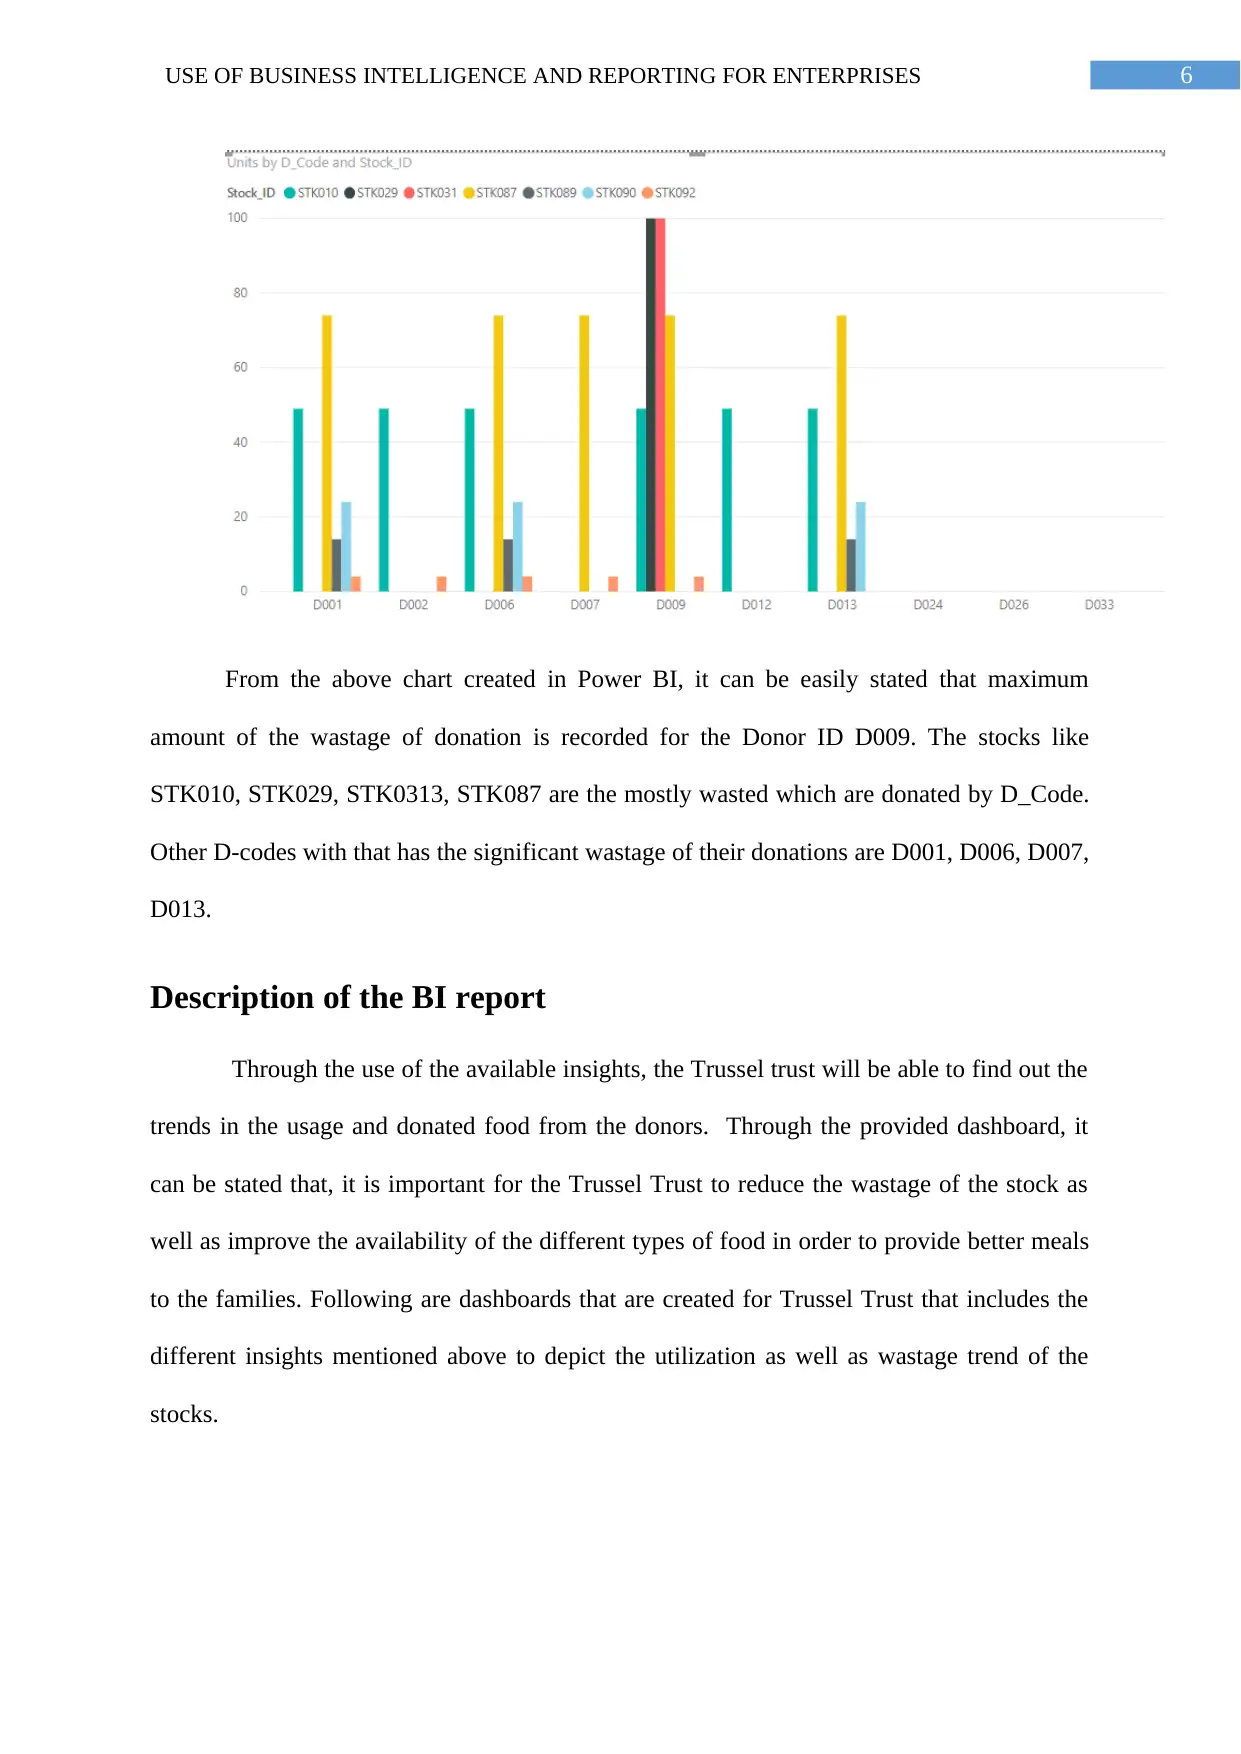
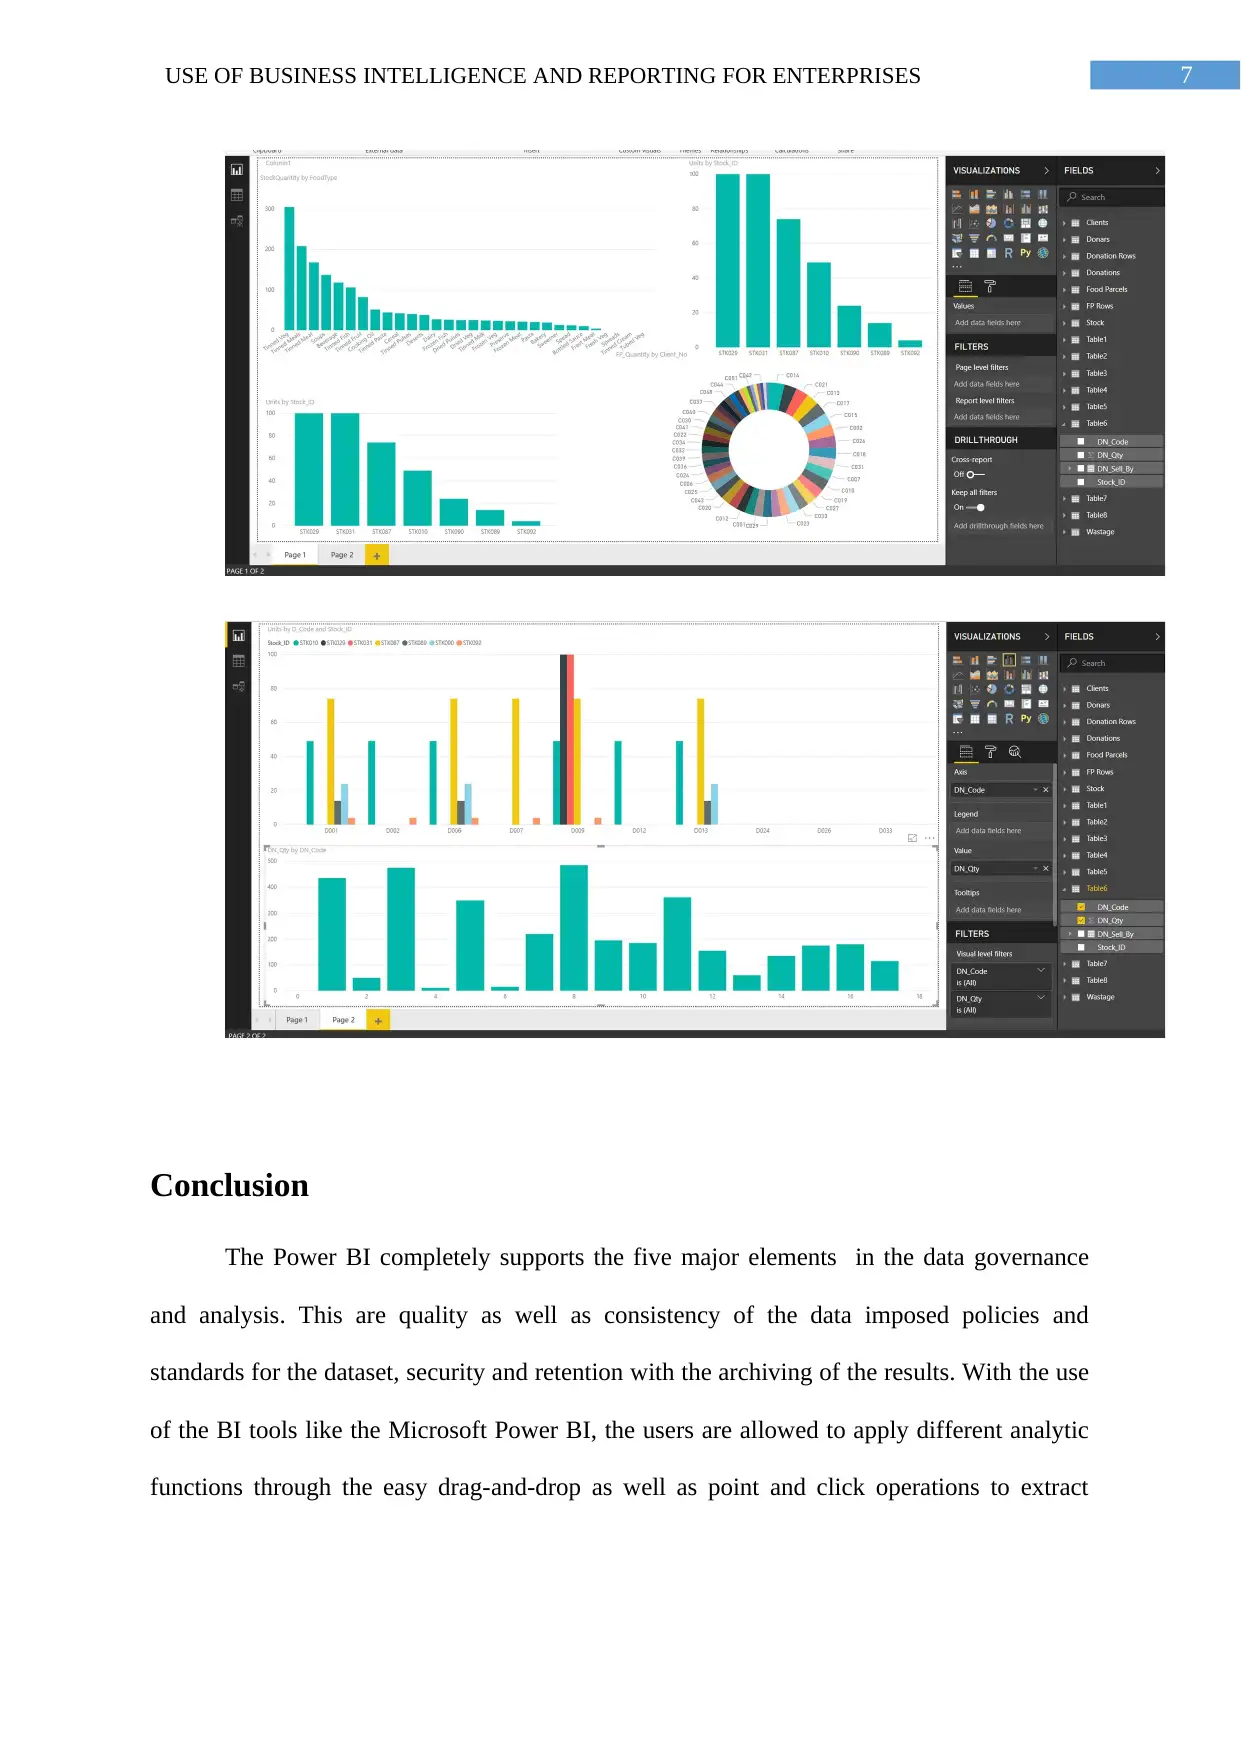
This report provides a comprehensive overview of Business Intelligence (BI) and Reporting for Enterprises. It begins with an introduction to BI, emphasizing its integration and ease of use due to pre-packaged applications. The report explores various BI tools and technologies, including Oracle BI, Microsoft Power BI, and Tableau, detailing their features and functionalities. A significant portion of the report focuses on the development of sheets and dashboards for the Trussel Trust, analyzing stock quantities, client consumption patterns, and food wastage. The analysis uses data visualizations to identify trends and insights, aiming to help the Trussel Trust optimize its operations. The report concludes by summarizing the key findings and emphasizing the importance of BI tools in data governance and analysis, highlighting their role in extracting valuable insights for informed decision-making.
1 out of 9
Related Documents


Your All-in-One AI-Powered Toolkit for Academic Success.
+13062052269
info@desklib.com
Available 24*7 on WhatsApp / Email
![[object Object]](/_next/static/media/star-bottom.7253800d.svg)
Copyright © 2020–2026 A2Z Services. All Rights Reserved. Developed and managed by ZUCOL.