University Report: Business Intelligence and Reporting for Enterprises

Verified

Added on  2023/01/23

|9
|1188
|22
Report
AI Summary
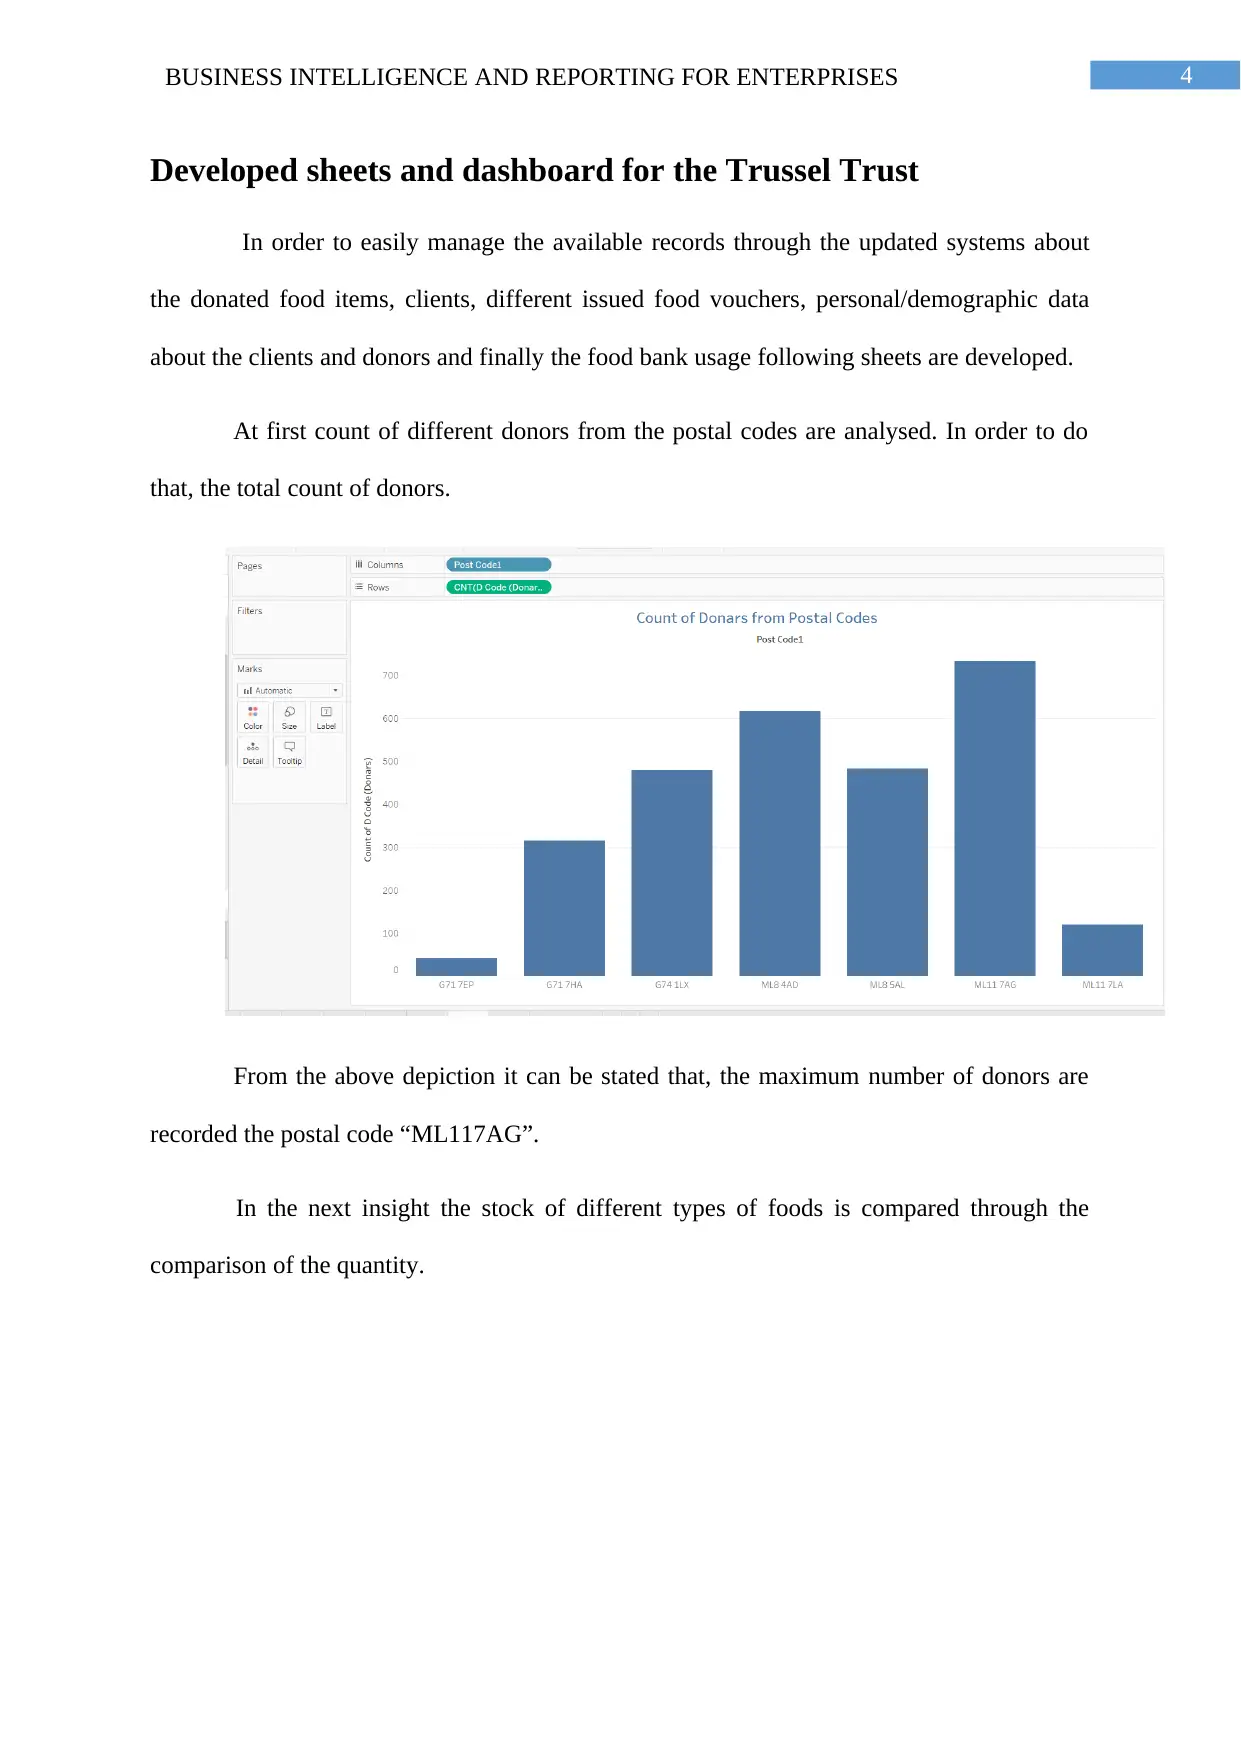
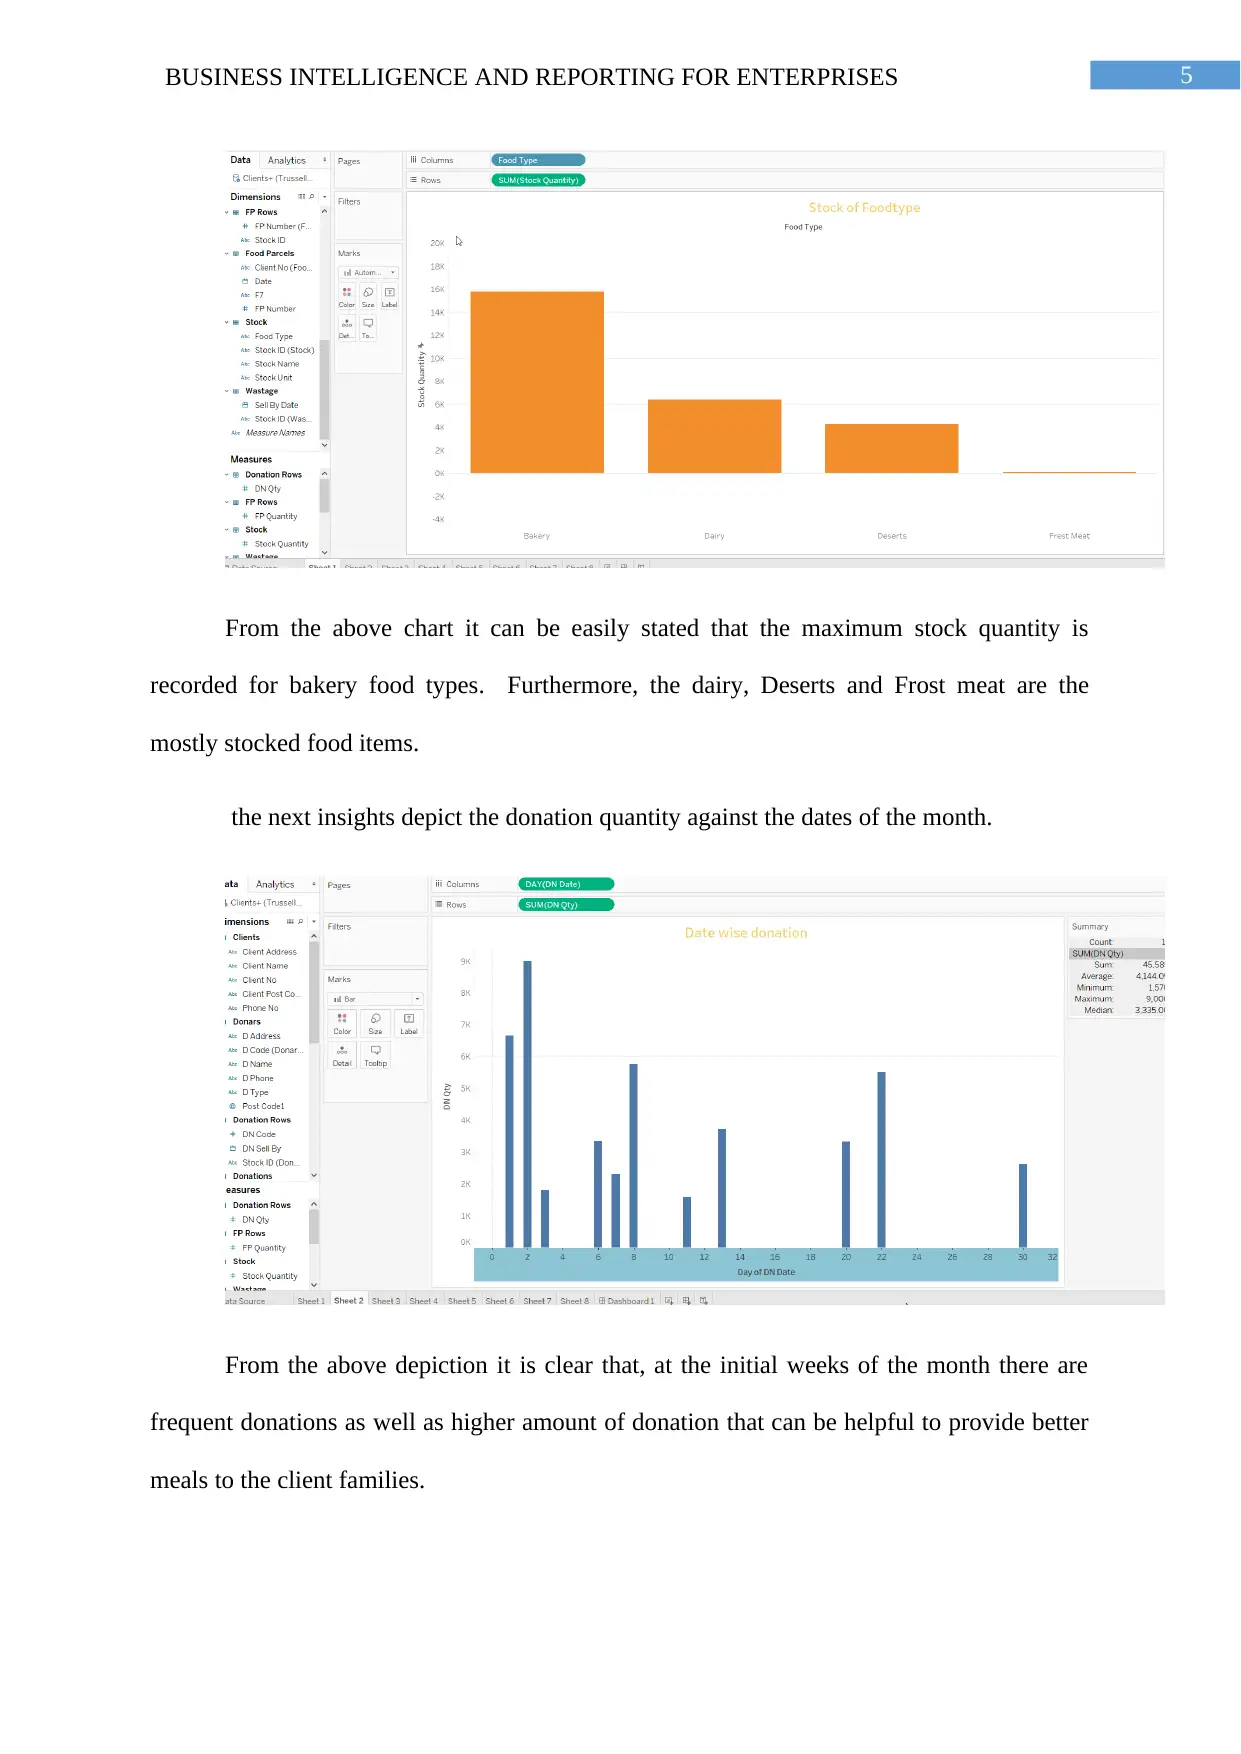
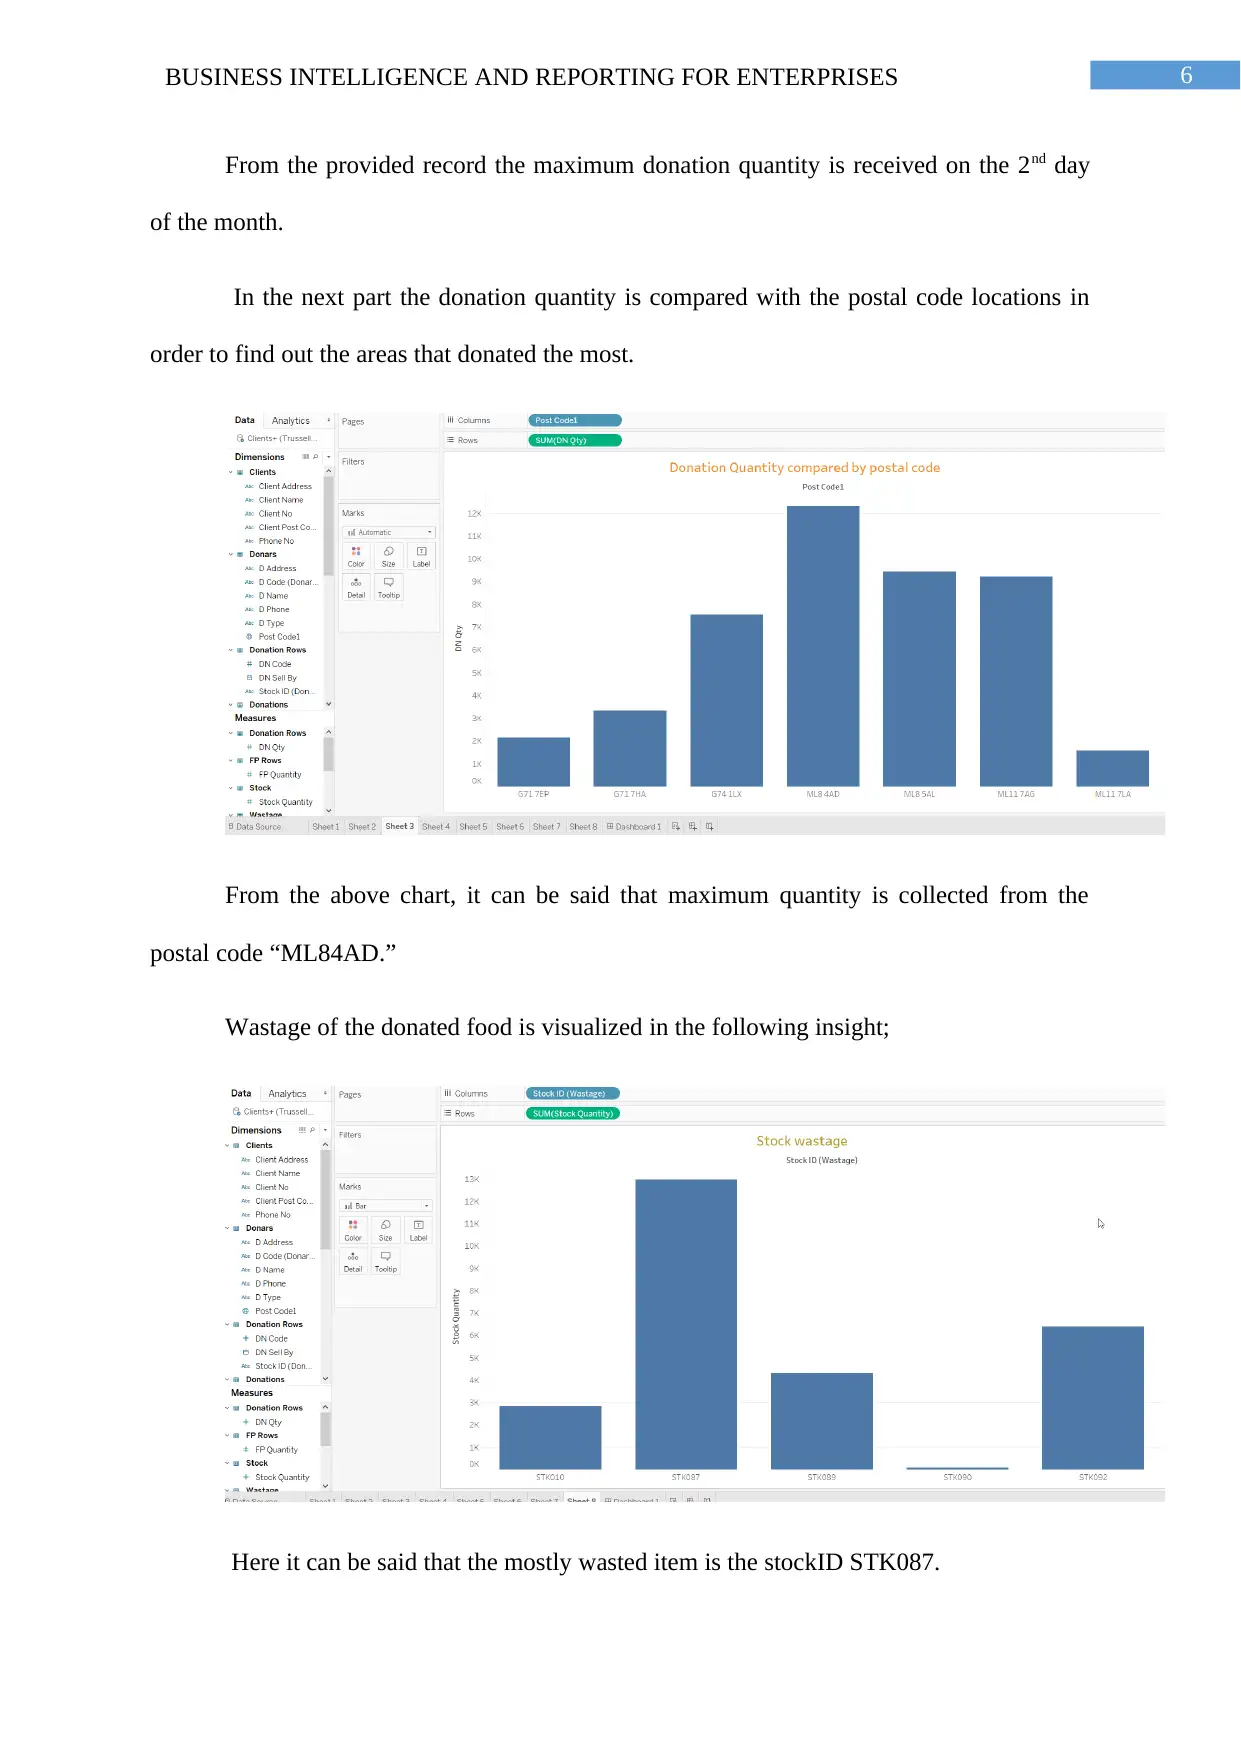
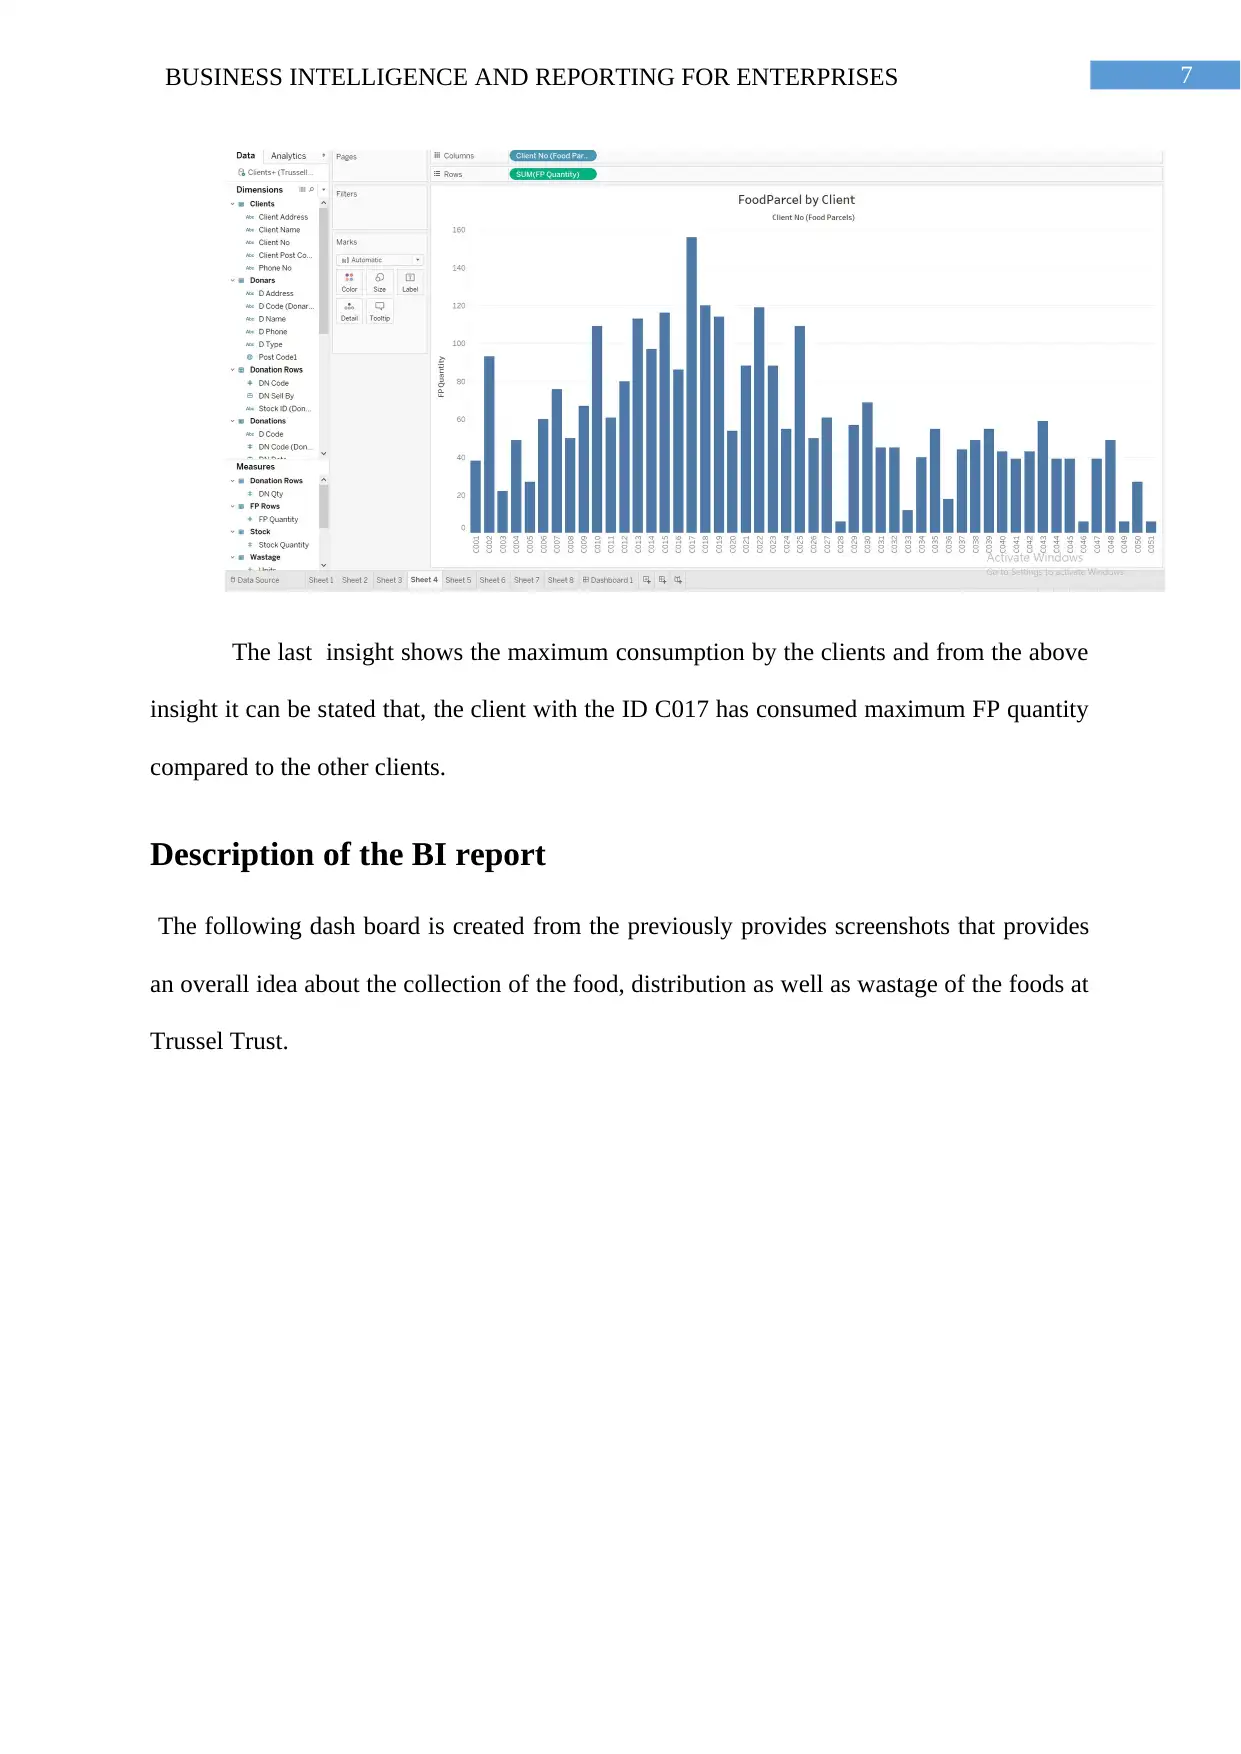
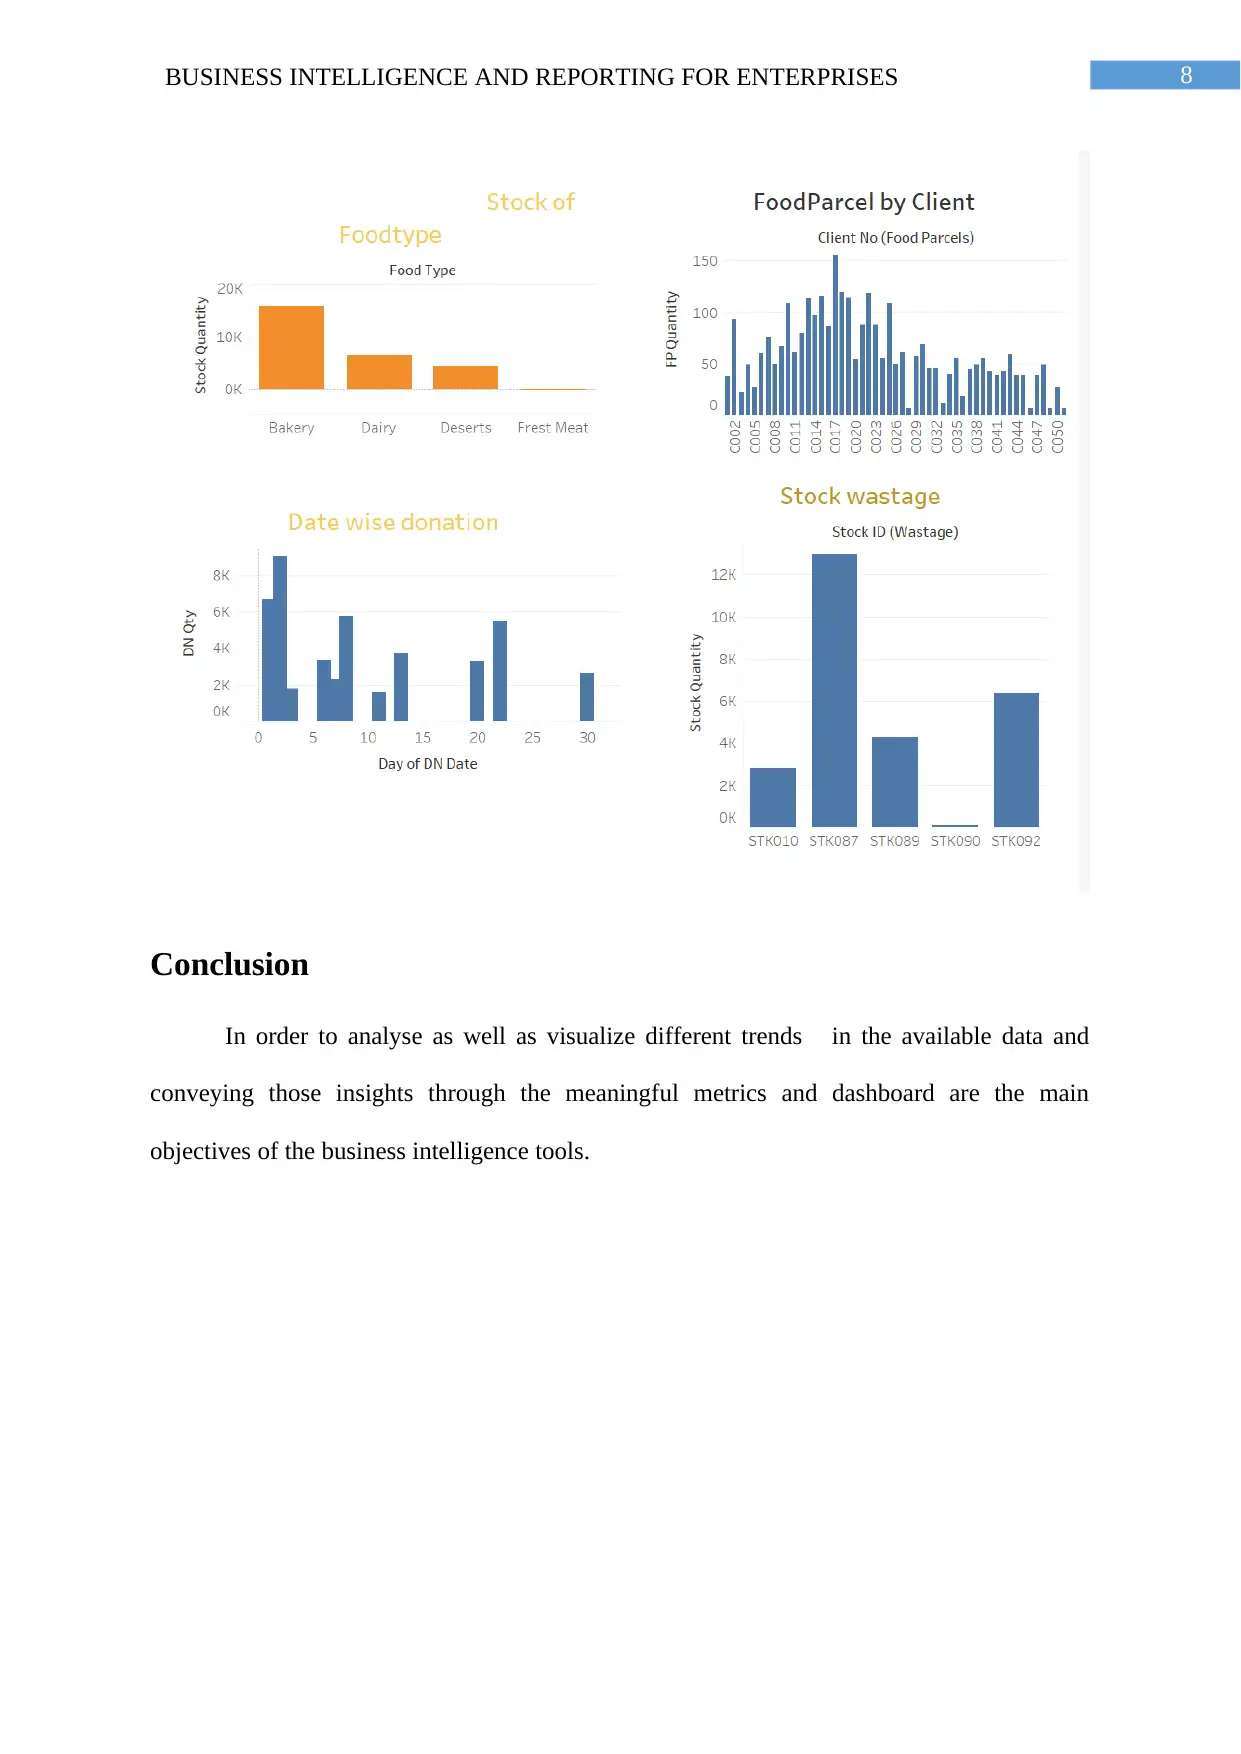
This report, prepared for the Business Intelligence and Reporting for Enterprises module (CSI11100) at Edinburgh Napier University, explores the application of Business Intelligence (BI) tools for data analysis and reporting. The report begins with an introduction to the benefits of BI in extracting valuable insights from big data. It then delves into various BI tools and technologies, including SAP Business Intelligence, Microsoft Power BI, Tableau, and Oracle BI, highlighting their functionalities and features. The core of the report focuses on the development of data sheets and dashboards for the Trussel Trust, analyzing donor data, food stock, donation quantities, and food wastage. The report provides visualizations of these data sets, offering insights into donation patterns, food distribution, and client consumption. The report concludes with a description of the developed dashboard, providing an overview of food collection, distribution, and wastage at the Trussel Trust, emphasizing the role of BI tools in data visualization and trend analysis. The student has utilized Tableau to create visualizations and dashboards to present the data insights.
Document Page
Running head: BUSINESS INTELLIGENCE AND REPORTING FOR ENTERPRISES
Business Intelligence and Reporting for Enterprises
Name of the Student
Name of the University
Authors note
tabler-icon-diamond-filled.svg

Paraphrase This Document

Need a fresh take? Get an instant paraphrase of this document with our AI Paraphraser
Document Page
1BUSINESS INTELLIGENCE AND REPORTING FOR ENTERPRISES
Table of Contents
Introduction................................................................................................................................2
BI tools and technologies...........................................................................................................2
Developed sheets and dashboard for the Trussel Trust..............................................................4
Description of the BI report.......................................................................................................7
Conclusion..................................................................................................................................8
Document Page
2BUSINESS INTELLIGENCE AND REPORTING FOR ENTERPRISES
Introduction
With the exponential growth of the big data, through the use of the business
intelligence tools (Hereafter mentioned as the BI tools) organizations can extract the valuable
insights. Through the use of these valuable insights, the organizations can have better
decision making process for its different operations as well as other procedures.
BI tools and technologies
For the analysis of the provided data set of the Trussel Trust, the Tableau tool is used.
There are multiple BI tools are available that provides numerous functionalities and are used
by the organizations according to their needs. Some of these tools are described below;
SAP Business Intelligence: The SAP analytics tool provides large scale analytics.
With the highly scalable user interface, the users are capable of processing of the small as
well as large sized datasets. Thus it can be stated that, this tool is perfect for the growing
business organizations that are trying to expand their reach to enhance their business.
Furthermore, it also provides easy Report Sharing capability. It offers businesses
organizations with organization-wide report sharing functionalities. Through the use of this
functionality it is possible to instantly share reports with others in the organization through a
secure platform.
In addition to that, most of the organizations uses Microsoft office suits as the part of
operations. SAP Business Intelligence tool seamlessly integrates with MS Office suite in
order to import data faster than ever as well as share the data through the tools.
Microsoft Power BI: The Microsoft PowerBI is packed with the powerful analytics
capabilities as well as sharing functionalities. Through the use of the Power BI users can
share live dashboards/reports, can get data-driven alert in order to get the mobile insights. It
Document Page
3BUSINESS INTELLIGENCE AND REPORTING FOR ENTERPRISES
also enables the users to connect, unify and access data from different sources while
exploring up-to-date analytics from real-time data. It also provides the functionality of
querying the acquired data through the natural language questioning.
Tableau: The Tableau is one of the leading BI tools used by the organizations in
order to provide an easy to-use data visualization software tool. Presently, tableau tool is
able to support up to 40 different data sources. This data sources includes simple file-based
data source, web data source, SQL/MDX databases as well as Hadoop clusters. Through the
use of the intuitive interface, tableau allows rich analysis of the selected dataset that includes
operations like the custom calculations, filtering depending on the conditions in addition. In
addition to that, potentially at different levels of detail, window and statistical functions and
many others.
Oracle BI: The Oracle BI is the suite of applications that includes business analytics
and calculations that are framed in Enterprise Information Model. The users of the tool can
access information through multiple ways such as collaborative workplace or using multiple
applications. This tool is also well known for its ability in providing in-depth and accurate
insights from the selected dataset. Through use of the tool It is possible to maintain balance
of business along with the IT collaboration in order to leverage the benefits from the insights.
One of the most important features of Oracle Business Intelligence is its Mobile
features that enables the users to access the intelligence data through the smartphones/tablets.
This mobile friendly feature is completely integrated along with Oracle Business Intelligence
Suite. This enables the users to provides immediate accessibility to existing content (like
scorecards, dashboards and reports). In this way the it helps in rapid accessibility to the da
along with the reduced time consumption. In this way, it helps in making accurate business
decisions in with better and ready to go insights.
tabler-icon-diamond-filled.svg

Paraphrase This Document

Need a fresh take? Get an instant paraphrase of this document with our AI Paraphraser
Document Page
4BUSINESS INTELLIGENCE AND REPORTING FOR ENTERPRISES
Developed sheets and dashboard for the Trussel Trust
In order to easily manage the available records through the updated systems about
the donated food items, clients, different issued food vouchers, personal/demographic data
about the clients and donors and finally the food bank usage following sheets are developed.
At first count of different donors from the postal codes are analysed. In order to do
that, the total count of donors.
From the above depiction it can be stated that, the maximum number of donors are
recorded the postal code “ML117AG”.
In the next insight the stock of different types of foods is compared through the
comparison of the quantity.
Document Page
5BUSINESS INTELLIGENCE AND REPORTING FOR ENTERPRISES
From the above chart it can be easily stated that the maximum stock quantity is
recorded for bakery food types. Furthermore, the dairy, Deserts and Frost meat are the
mostly stocked food items.
the next insights depict the donation quantity against the dates of the month.
From the above depiction it is clear that, at the initial weeks of the month there are
frequent donations as well as higher amount of donation that can be helpful to provide better
meals to the client families.
Document Page
6BUSINESS INTELLIGENCE AND REPORTING FOR ENTERPRISES
From the provided record the maximum donation quantity is received on the 2nd day
of the month.
In the next part the donation quantity is compared with the postal code locations in
order to find out the areas that donated the most.
From the above chart, it can be said that maximum quantity is collected from the
postal code “ML84AD.”
Wastage of the donated food is visualized in the following insight;
Here it can be said that the mostly wasted item is the stockID STK087.
tabler-icon-diamond-filled.svg

Paraphrase This Document

Need a fresh take? Get an instant paraphrase of this document with our AI Paraphraser
Document Page
7BUSINESS INTELLIGENCE AND REPORTING FOR ENTERPRISES
The last insight shows the maximum consumption by the clients and from the above
insight it can be stated that, the client with the ID C017 has consumed maximum FP quantity
compared to the other clients.
Description of the BI report
The following dash board is created from the previously provides screenshots that provides
an overall idea about the collection of the food, distribution as well as wastage of the foods at
Trussel Trust.
Document Page
8BUSINESS INTELLIGENCE AND REPORTING FOR ENTERPRISES
Conclusion
In order to analyse as well as visualize different trends in the available data and
conveying those insights through the meaningful metrics and dashboard are the main
objectives of the business intelligence tools.
chevron_up_icon
1 out of 9
circle_padding
hide_on_mobile
zoom_out_icon
[object Object]