BUSM4409: Business Intelligence System Report, September 2018
VerifiedAdded on 2023/06/07
|18
|6850
|181
Report
AI Summary
This report, prepared for a senior leadership team, delves into the realm of Business Intelligence (BI) systems. It begins with an executive summary highlighting the core aspects of BI, emphasizing its role in improving financial visibility and streamlining organizational operations. The report then provides a comprehensive overview of BI, including its features, such as executive dashboards, location intelligence, and what-if analysis, and its various functions, like reporting, analysis, and predictive analytics. The report elucidates how these features and functions align with various business operations and functional areas, offering insights into how BI can drive business improvement through fact-based decision-making, identification of new revenue opportunities, and enhanced customer understanding. Furthermore, the report explores the application of BI in project management, showcasing its potential to assist project managers in making informed decisions and optimizing resource allocation. In conclusion, the report underscores the significance of BI in modern business environments, emphasizing its ability to transform data into actionable insights, thereby fostering improved performance and competitive advantage. The report includes an introduction, discussion, and conclusion, along with a table of contents and references.

Running head: INFORMATION AND TECHNOLOGY MANAGEMENT
Information and Technology Management
(Business Intelligence System)
Name of the student:
Name of the university:
Author Note
Information and Technology Management
(Business Intelligence System)
Name of the student:
Name of the university:
Author Note
Paraphrase This Document
Need a fresh take? Get an instant paraphrase of this document with our AI Paraphraser
1INFORMATION AND TECHNOLOGY MANAGEMENT
Executive summary
Business intelligence is the assessment, presentation and assimilation of business information. It
helps in improving the visibility of financial status. Further, the organisational operations are also
developed through managing business. The following study explains the various features and
functions of business intelligence. The methods in with these elements are being aligned towards
financial sectors are analysed. Further, ways to develop business operations and assisting project
managers in managing projects are also examined in this report.
2INFORMATION AND TECHNOLOGY MANAGEMENT
Table of Contents
1. Introduction:......................................................................................................................................4
2. Discussion on the features and functions of business intelligence and ways they have been
aligning to the business operations and areas:.......................................................................................4
2.1. Features of business intelligence system:...................................................................................4
2.2. Functions of business intelligence:.............................................................................................5
2.3. Methods of features and functions helpful to business operations and functional areas:...........6
3. Ways in which business intelligence is helpful for business improvement:.....................................8
4. Implementation of business intelligence in project management:...................................................11
5. Conclusion:......................................................................................................................................14
6. References:......................................................................................................................................15
⊘ This is a preview!⊘
Do you want full access?
Subscribe today to unlock all pages.
Trusted by 1+ million students worldwide
3INFORMATION AND TECHNOLOGY MANAGEMENT
1. Introduction:
Information technology management is the method where every resource regarding
information technology has been managed. This is done as per the needs and priorities of the
business. Here, this comprises tangible resources such as computers and individuals, networking
hardware and real resources such as data and software.
On the other hand, business intelligence refers to analysis, budgeting, presentation,
accumulation of business data. Here the aim is to develop visibility of economic status and
organisational operations for managing a business.
In this report, a detailed explanation of functions and features and ways to align towards the
functional operational and areas are discussed. Next, how the information system has been assisting
the business in developing business operations are analysed. Lastly, how his information system has
been helping project managers to manage projects are demonstrated.
2. Discussion on the features and functions of business intelligence and ways they
have been aligning to the business operations and areas:
2.1. Features of business intelligence system:
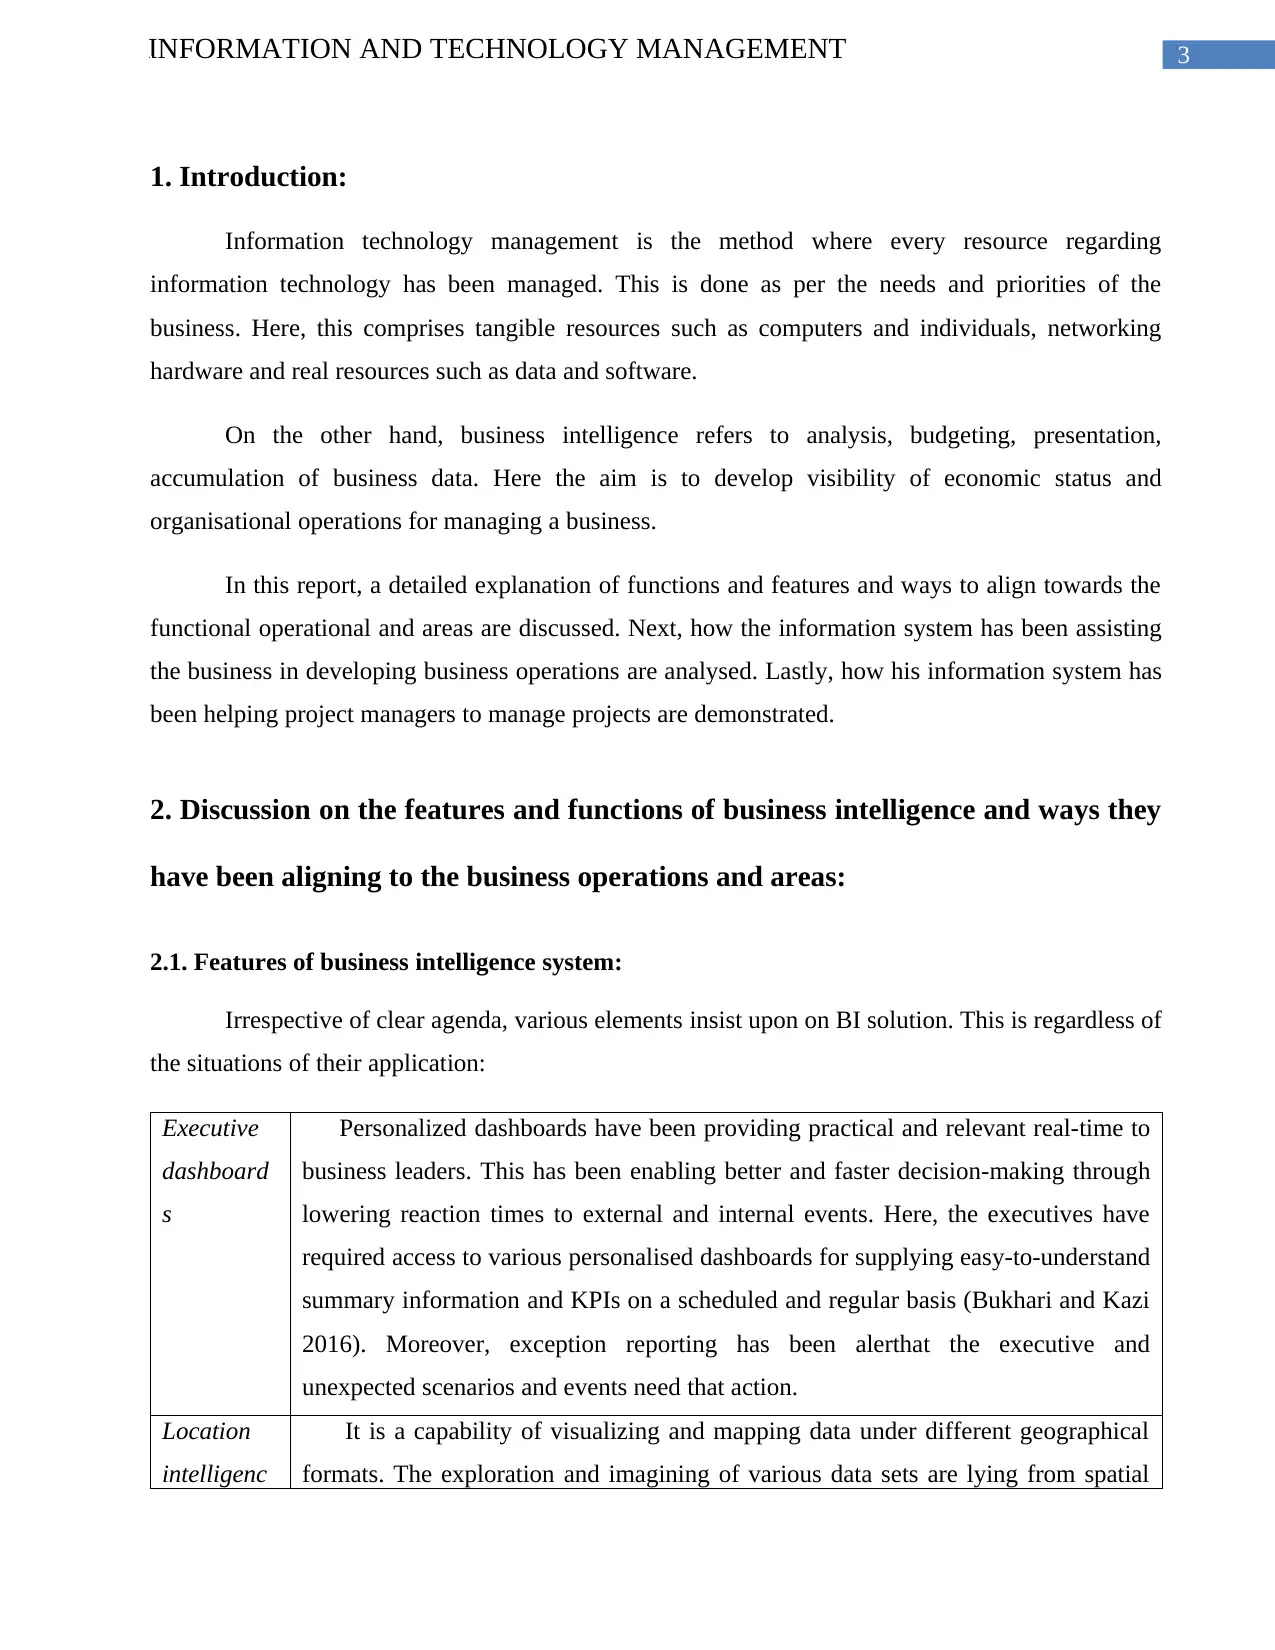
Irrespective of clear agenda, various elements insist upon on BI solution. This is regardless of
the situations of their application:
Executive
dashboard
s
Personalized dashboards have been providing practical and relevant real-time to
business leaders. This has been enabling better and faster decision-making through
lowering reaction times to external and internal events. Here, the executives have
required access to various personalised dashboards for supplying easy-to-understand
summary information and KPIs on a scheduled and regular basis (Bukhari and Kazi
2016). Moreover, exception reporting has been alerthat the executive and
unexpected scenarios and events need that action.
Location
intelligenc
It is a capability of visualizing and mapping data under different geographical
formats. The exploration and imagining of various data sets are lying from spatial
1. Introduction:
Information technology management is the method where every resource regarding
information technology has been managed. This is done as per the needs and priorities of the
business. Here, this comprises tangible resources such as computers and individuals, networking
hardware and real resources such as data and software.
On the other hand, business intelligence refers to analysis, budgeting, presentation,
accumulation of business data. Here the aim is to develop visibility of economic status and
organisational operations for managing a business.
In this report, a detailed explanation of functions and features and ways to align towards the
functional operational and areas are discussed. Next, how the information system has been assisting
the business in developing business operations are analysed. Lastly, how his information system has
been helping project managers to manage projects are demonstrated.
2. Discussion on the features and functions of business intelligence and ways they
have been aligning to the business operations and areas:
2.1. Features of business intelligence system:
Irrespective of clear agenda, various elements insist upon on BI solution. This is regardless of
the situations of their application:
Executive
dashboard
s
Personalized dashboards have been providing practical and relevant real-time to
business leaders. This has been enabling better and faster decision-making through
lowering reaction times to external and internal events. Here, the executives have
required access to various personalised dashboards for supplying easy-to-understand
summary information and KPIs on a scheduled and regular basis (Bukhari and Kazi
2016). Moreover, exception reporting has been alerthat the executive and
unexpected scenarios and events need that action.
Location
intelligenc
It is a capability of visualizing and mapping data under different geographical
formats. The exploration and imagining of various data sets are lying from spatial
Paraphrase This Document
Need a fresh take? Get an instant paraphrase of this document with our AI Paraphraser
4INFORMATION AND TECHNOLOGY MANAGEMENT
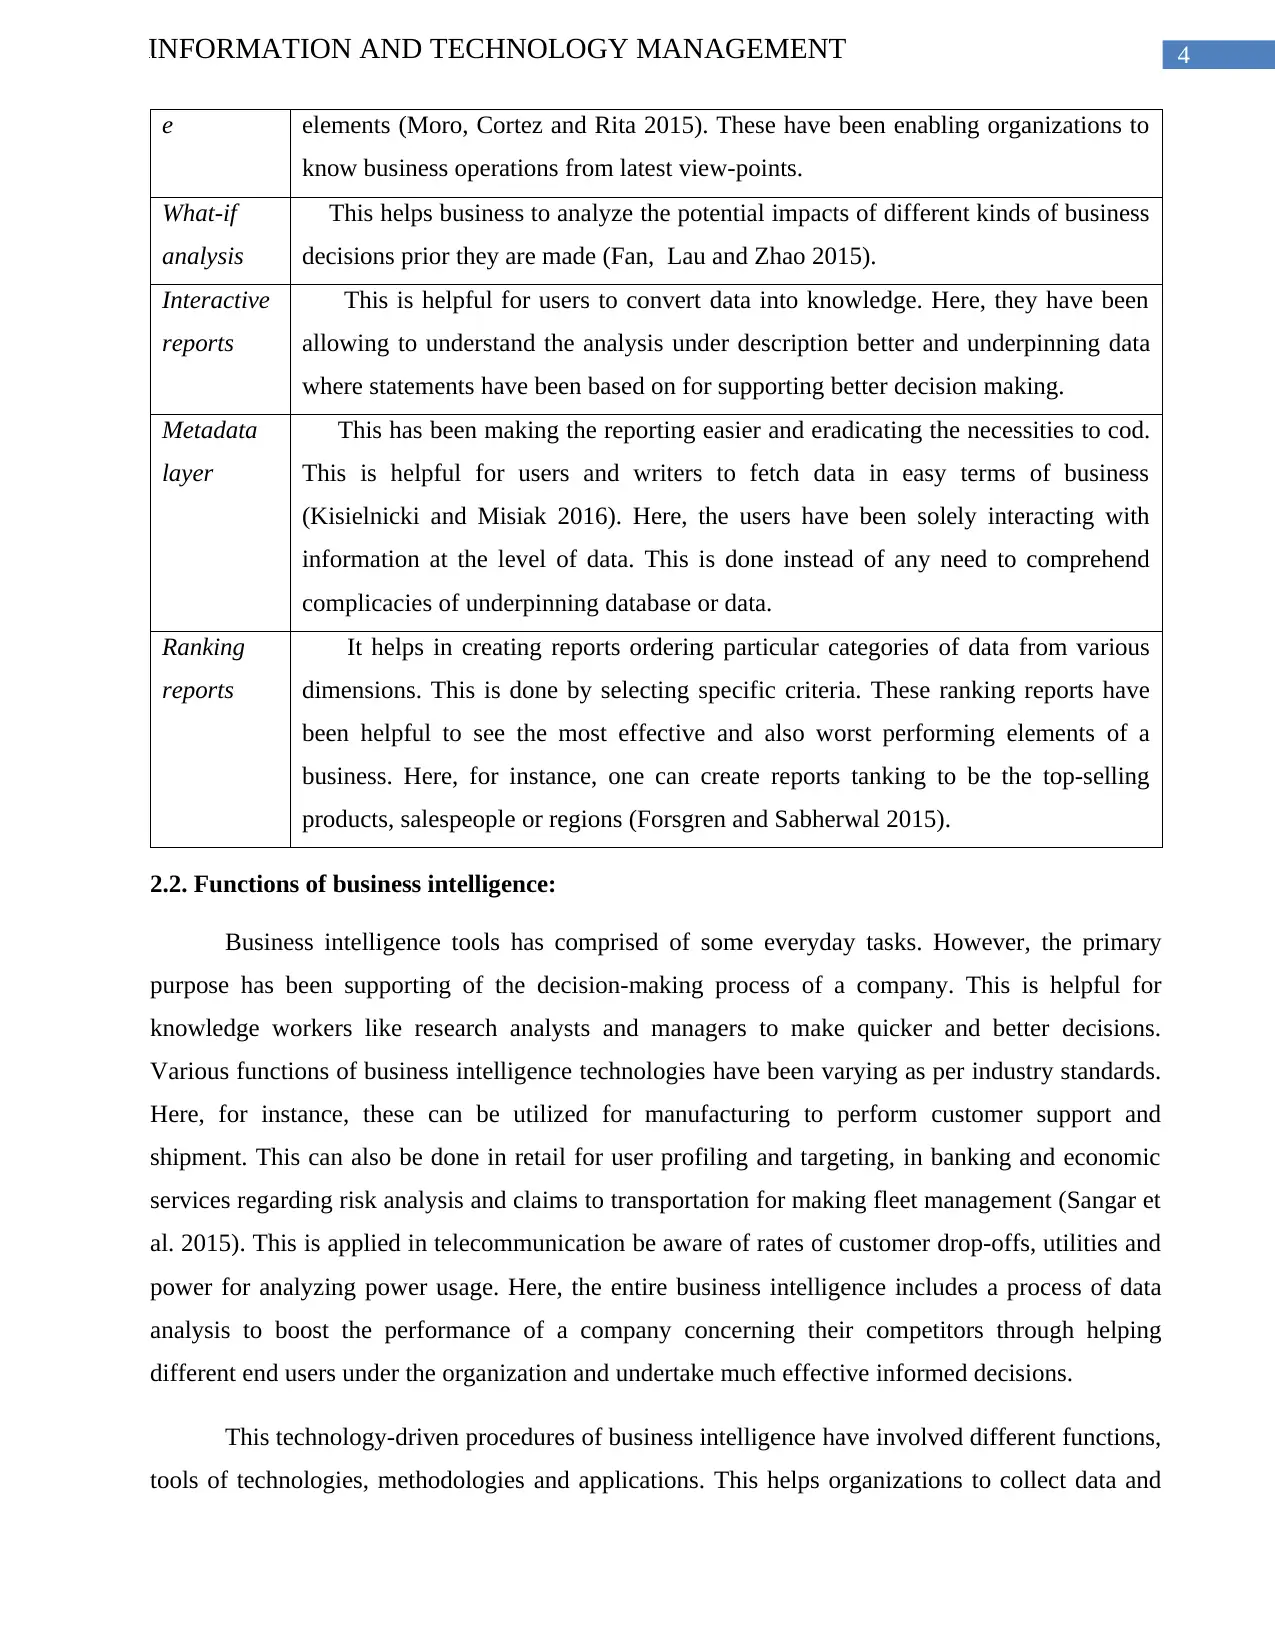
e elements (Moro, Cortez and Rita 2015). These have been enabling organizations to
know business operations from latest view-points.
What-if
analysis
This helps business to analyze the potential impacts of different kinds of business
decisions prior they are made (Fan, Lau and Zhao 2015).
Interactive
reports
This is helpful for users to convert data into knowledge. Here, they have been
allowing to understand the analysis under description better and underpinning data
where statements have been based on for supporting better decision making.
Metadata
layer
This has been making the reporting easier and eradicating the necessities to cod.
This is helpful for users and writers to fetch data in easy terms of business
(Kisielnicki and Misiak 2016). Here, the users have been solely interacting with
information at the level of data. This is done instead of any need to comprehend
complicacies of underpinning database or data.
Ranking
reports
It helps in creating reports ordering particular categories of data from various
dimensions. This is done by selecting specific criteria. These ranking reports have
been helpful to see the most effective and also worst performing elements of a
business. Here, for instance, one can create reports tanking to be the top-selling
products, salespeople or regions (Forsgren and Sabherwal 2015).
2.2. Functions of business intelligence:
Business intelligence tools has comprised of some everyday tasks. However, the primary
purpose has been supporting of the decision-making process of a company. This is helpful for
knowledge workers like research analysts and managers to make quicker and better decisions.
Various functions of business intelligence technologies have been varying as per industry standards.
Here, for instance, these can be utilized for manufacturing to perform customer support and
shipment. This can also be done in retail for user profiling and targeting, in banking and economic
services regarding risk analysis and claims to transportation for making fleet management (Sangar et
al. 2015). This is applied in telecommunication be aware of rates of customer drop-offs, utilities and
power for analyzing power usage. Here, the entire business intelligence includes a process of data
analysis to boost the performance of a company concerning their competitors through helping
different end users under the organization and undertake much effective informed decisions.
This technology-driven procedures of business intelligence have involved different functions,
tools of technologies, methodologies and applications. This helps organizations to collect data and
5INFORMATION AND TECHNOLOGY MANAGEMENT
then prepare investigations. The database queries are conducted and developed and after that reports
are generated. Here, all types of functions are helpful for supporting decisions of the business. Here,
data used under business intelligence has been including previous and latest data that are collected
from external sources (Fan, Lau and Zhao 2015). Next, business intelligence took that information
and assimilated a comprehensive set of applications and functions like performance scorecards,
dashboards, data visualization software, online analytical processing, enterprise reporting, querying
and ad hoc analysis. Thus it is seen that applications of business intelligence applications having
distinct and vital functions are bought separately from different vendors of the third party and as an
element of a platform of single business intelligence (Williams 2014).
Here, the most ubiquitous and most straightforward path, interestingly driven by minimum
real value is reporting. This reveals what has been already happening. Here, one of the primary
aspects is to be highly static. Here, the following function values ladder and complexity which is
also known as analysis. Since a study has been focusing on what has been happening. This has been
more costly to contribute to making effective decisions (Moro, Cortez and Rita 2015). Next,
monitoring has been taking people to the next level of complexity. This is to show precisely what
has been happening at that point. This has provided immense value through permitting for
identifying issues, correct and intervene the near real time. This is instead of waiting for any report
to reveal how weak the tasks are done and assuring post-mortem to inform how the poor outcomes
have taken place. Lastly, the holy grail of BI has been predictive analytics. This processes
information to come up with various predictions of what has been happening for future (Kisielnicki
and Misiak 2016). As this has not been widespread under multi-family housing, different predictive
analysis has been there already for stacking common technology. Here, applications of credit scoring
have predicted distressed debt and pricing. Further, revenue management systems have been
optimally predicting rents for balancing yields and occupancies.
2.3. Methods of features and functions helpful to business operations and functional areas:
The above duties and features are beneficial to gain various insights to create timely and
accurate business decisions. At any time, executives have been making decisions from best guess
and gut feeling. Here, the choices are made inaccurate as they are not informed. Business
intelligence has been using decisions that are insight-driven and data with gut feeling (Sauter 2014).
This is a help to assess data in real-time to make immediate decisions. Further, new revenues
opportunities are identified here. They are also able to determine the data. One can obtain various
⊘ This is a preview!⊘
Do you want full access?
Subscribe today to unlock all pages.
Trusted by 1+ million students worldwide
6INFORMATION AND TECHNOLOGY MANAGEMENT
insights regarding useful scope that the business has missed in the past. Next, the new revenue
opportunities are also identifiable. Through assessing all data, one can retrieve insights regarding
current scopes that one have missed in the past (Larson and Chang 2016). One can develop or adjust
for current market situations for satisfying customers. Further, the KPIs can be tracked successfully
through receiving notifications and alerts all the time the data has been changing about particular
KPI. As the data has been improving, one can get notified and has been able to drill down what has
happened and what can be done to fix that.
Moreover, the functions and features have been allowing various kinds of users in accessing
dashboards and data. Having different solutions for self-service, users of business has not been
needed to rely entirely on IT and access data and generate dashboards. Besides, one can also get
access to initial reports and metrics. As one uses BI tools that are governed through self-service, it
helps users to gain benefit from business intelligence. However, only one version of the truth is
maintained here (Sauter 2014). Moreover, it is also helpful to have an overall overview of customers.
One can know customer behavior more efficiently and use that to supply customers with various
customized offers. Understanding what customers have been buying or not at any time for a place, is
helpful to change the data to benefit.
Besides, it is useful for better inventory management. This is helpful to control inventory
amounts orders and logistics for proper management. It is also beneficial to find out anomalies
within inventory data. Next, efficiencies can also be improved in this case. The BI solutions have
been saving substantial time by providing insights very fast. The functions are also helpful for more
exact allocation of resources. The elements are beneficial to know what areas of business have
required more resources (Peters et al. 2016). Moreover, business intelligence is useful to analyze
precisely how all units of activity has been performing and providing insights regarding how to
develop that. Ultimately, they are also helpful to take advantages of the potential of the team. This is
done through collaborating and creating discussions with various team members as they fund ant
change in data. This is also helpful to make more effective decisions. These are also helpful to seek
relevant individuals for particular challenges and develop an ad-hoc team to solve that (Wu, Chen
and Olson 2014).
Paraphrase This Document
Need a fresh take? Get an instant paraphrase of this document with our AI Paraphraser
7INFORMATION AND TECHNOLOGY MANAGEMENT
3. Ways in which business intelligence is helpful for business improvement:
Business intelligence denotes the way in which computer software with various other tools.
Thus they have been collecting every kind of complicated business information. This is for
condensing that to reports. Here, the data collected has been focusing on a particular department and
provide a complete view of the overall status of the company (Stone and Woodcock 2014). Huge
corporations have been possessing a high quantity of data for processing that to benefit notably from
business intelligence. This is done through the same type of concerns that are used.
Business intelligence may help a company identify its most profitable customers, trouble
spots within its organization, or its return on investment for specific products. Although a
companywide business intelligence system is complex, costly and time-consuming to establish,
when implemented and used correctly, its benefits can be significant (Camilleri 2016).
First of all fact-based decisions can be taken. As the system of company-wide business
intelligence is appropriately placed, the management can fetch current and detailed data on every
aspect of a business. This includes customer, production data and economic data (Schulz, Winter and
Choi 2015). Here, the reports can be read and the information can be synthesized in various types of
pre-determined methods. Thus an immediate return on investment reports of distinct product line and
products can be done. Here, the information has been helpful for management to develop various
fact-based decisions. This includes products for concentrating on and one that has been
discontinuing. It is also beneficial for developing negotiations and sales. These are also essential
resources for a company’s sales force because it provides access to reports that have even identified
trends and sales, additions and improvements of products, present preferences of customers and
various unexplored markets.
Here, current and detailed data are also crucial for backing up negotiations along with
vendors and suppliers (George, Schmitz and Storey 2018). Moreover, it has been eliminating wastes
where business intelligence systems have been pointing out areas of waste and loss that have been
unnoticed previously in huge organizations. As companywide BI system has been working as a
single, with a unified whole, it can analyze transactions taking place between departments and
subsidiaries for identifying sectors of inefficiency and overlapping. Next, it is also helpful to
determine various scopes. This is done by analyzing individual abilities, comparing relative strengths
and weaknesses against the competitors (Baur et al. 2014). Next, the market conditions and trends
8INFORMATION AND TECHNOLOGY MANAGEMENT
are also identified and they must react very fast to those changes. This is to gain competitive
advantages and helping decision makers for acting swiftly and adequately to respond to scopes. This
is also helpful for organizations to determine most customers who are profitable. This also increases
various profitable customers potentially. This is to analyze the causes for the dissatisfaction of
customers prior it starts to cost those sales.
Regarding actionable intelligence significant cause to gain BI is to ground their ability for
providing various actionable information. This has been highly vital to provide business user tools
and providing simple and easy access to data and legacy database and mounts of latest data from
geolocation (Foshay and Kuziemsky 2014). Moreover, there is information integration. Here the data
has been tending to speed around and trapped under different silos. Here, the current wave of tools
of BI is to eradicate restrictions taking place between those silos. Hence a holistic image is formed
from various kinds of sources of data. This to suggest more accurate forecasts. The companies have
been thinking according to data alters that are connected every time. For instance, Hortonworks
Connected Data platforms are integrated with the tools of business intelligence such that business
analysts can access trillions of data objects (Vossen 2014). This is done directly from favourite
business intelligence deployments instead of any necessity of movement of data. Then there is sales
personalization. This contribution made by a business intelligence has been making the entire
success of the enterprise that can never be overstated in current economic standards of the digital
world.
Next, targeted and personalized online experience of business has delivered to customers is
one of the causes with the cost of savings. The online retailers with average sales for every employee
with well-known companies have never possessed digital string presence. Traditional platforms of
BI has been coming a long way with the previous decade (Wieder and Ossimitz 2015). At last, they
have been using glean intelligence taking place from the smaller subset of data. These have been
overseen by various specialists who were the only people who have been able to interpret and access
that data. Here, businesses have been able to ask questions and specialist has been getting back them
some days with reaction. However, business analytics and intelligence that are used currently have
been the legacy of BI of GUIs with RDBMS data warehouse. This has also involved involvement of
human analyst. Apart from this, this is machine-initiated and including assimilation of transactional
interactions over the Internet having analytics and searching operations. This happens at machine
⊘ This is a preview!⊘
Do you want full access?
Subscribe today to unlock all pages.
Trusted by 1+ million students worldwide
9INFORMATION AND TECHNOLOGY MANAGEMENT
speed which is lightning fast. Here, this kinds of BI has been denoted as an HTAP or “Hybrid
Transaction Analytical processing”.
This has been enabling a business to customize effectively to the online experience of
customers with interactions. This has been positively influencing the process to buy and helping
them in winning over those competitors who have not been using that current BI method (Popovič et
al. 2014). Moreover, there has been the real-time making of decisions. At previous days, the data
warehouses have been utilized for aggregating information from various business lines and
departments. BI tools have also been providing a unified perspective of operations for managers for
recognizing scopes for efficiencies and growths. However, this kind of approach has been losing the
platform of systems making executive decisions in real-time on the ground of present data.
Instead of static analysis of previous operations, however current platforms of big data has
been bringing various analytical abilities, as per as operational data for making decisions whenever
business takes place. This is the expectation of pushing previous conventional intelligence and
capabilities of reporting driving the downfall of legacy data technologies of warehousing. These are
being seen in the current market (Sallam et al. 2014). However, at ending the insights are created and
the ability to act on those insights in actual time has been bringing real time higher than the business
value. Next, there is an everyman analysis. Since consumers have been consuming orders of
magnitude with more as compared to prior generations.
This uprising of the search engine and a smartphone made on the information accessible to
any person on a daily basis. These latest technologies of business intelligence are being positioned
for bringing the same kind of changes for the business world (Farrugia 2017). Previously,
organizations have been spending numerous days to provide an answer to queries that could be
answered easily interpreting the individual data of the company and to prepare and analyze
information that is manual and complicated processes (Wang 2015). For the upcoming years, a
significant transformation is the area of data analytics can be seen. This has been enabling business
users and analysts to answer a question at any instance.
Next, business intelligence is helpful for data visualization. This has been effective to
compile lists flow vital data points and utilize spreadsheets for organizing and making sense of
information. However, executives, business users and salespeople have been demanding quick
insights and have been providing more through visualization tools. This has been offering a broad
Paraphrase This Document
Need a fresh take? Get an instant paraphrase of this document with our AI Paraphraser
10INFORMATION AND TECHNOLOGY MANAGEMENT
range of methods for viewing data (Kimble and Milolidakis 2015). Moreover, as more data sources
have been emerging, additional methods are there to see where data has been appearing.
Further, there is self-service business intelligence. This is the main benefit of current BI and
data visualization tools. Here, the users have been able to leverage various self-service tools of
visualizations for creating primary charts and graphs for some period. Besides, it has been proven to
be sufficient for users who need to move deeper into data. Advanced self-service abilities have been
enabling users for creating visualizations that have been much more complicated. These are much
more complicated such as complex measurements, forecasting and trends (Akhtar,Humphreys and
Furnham 2015). These are also diverse concerning geospatial displays, heat maps and funnels and
has also been interactive such as supporting real-time streaming of data, custom filtering and various
user-defined drilling down. As far as mobile business intelligence and developed information access
is concerned this has been the norming in consumer space for accessing the data needed as one
requires that. This has been irrespective of place and time. Here, for any time, thus, users of business
has been demanding similar functionality for various enterprise applications.
This proper information at the appropriate moment has been helping to clinch deals making
other sales and serving customers for profitably and retaining business that has been lost. In case this
has liberating current dashboards from re-architecting and desktop, the compile workflows across
mobilizing primary business data, various organizations have been getting the advantages of mobile
business intelligence (Bodislav 2015). Then there are customized applications with built-in business
intelligence. Different off-the-shelf BI and tools of analytics have not fit all use cases. It is also seen
that more users have been creating various customized applications having embedded BI and
components of data visualizations. It is vital as it has been taking the designing of various
visualization tools especially under the hands of BI specialists. This has been allowing using those
tools for deciding how they have been consuming data. Here, the implementation has included
various applications of business intelligence that custom-coded including customized applications
from multiple off-shelf BI platforms and components of BI that are embedded under transactional
and operation applications.
11INFORMATION AND TECHNOLOGY MANAGEMENT
4. Implementation of business intelligence in project management:
Business Intelligence, in a broader sense, refers to the set of technologies, applications,
methods and ideas. These are sued for transforming raw data to meaningful one. This is used by
stakeholders for making informed decisions. BI techniques, tools and practices are used by
organizations for understanding the situation of affairs, market conditions and competitors. This is
helpful to address current concerns of business and create strategies of the organization. This has
been providing competitive advantages in the marketplace (Torres, Sidorova and Jones 2018). For
making informed decisions, the data of organizations has been accessible to all kinds of stakeholders
who are relevant. Here, the accessibility has been assuring business users to go through their analysis
which has been sharing insights freely with their team members. Further, BI systems have been
managing organizational metrics and presenting them to various decision makers across intuitive
dashboards, self-service capabilities and reports. This data analytics and data management elements
of BI systems have been consolidating complicated internal and third-party from various
applications to the core framework for converting other metrics and performance indicators.
It has been combining data that are analyzed in details and compared to multiple other
performance indicators and metrics (de Jager and Brown 2016). Though the enterprise project
management solution and system, internal project management teams and consulting companies
have different other business has been delivering services of project management, these have often
been failing to meet those aims. Here, without any meaningful method of establishing goals and
tracking milestones with project results, enterprises are unable to understand mistakes, forecast
resources and then predict revenues and develop a competitive position in the market (Laursen and
Thorlund 2016).
Here, the software of project management and procedures has been providing information
and data with which teams, executives and project managers have been able to track and analyze the
success of projects. Besides, the systems have been falling short to deliver drastic analytics, features
of critical security and flexible perspectives for enabling business users to fetch information that has
been meaningful to them. A few systems have been providing elements of needed features and
various functionalities. They have been offering aggregated data for evaluating and monitoring
outcomes and trends for teams, projects, processes, individuals and performance on series of times
(Chung 2014). These solutions have been providing automated alerts and various personalized
dashboards have the latest information that is integrated from enterprise data sources for assuring
⊘ This is a preview!⊘
Do you want full access?
Subscribe today to unlock all pages.
Trusted by 1+ million students worldwide
1 out of 18
Related Documents


Your All-in-One AI-Powered Toolkit for Academic Success.
+13062052269
info@desklib.com
Available 24*7 on WhatsApp / Email
![[object Object]](/_next/static/media/star-bottom.7253800d.svg)
Unlock your academic potential
Copyright © 2020–2026 A2Z Services. All Rights Reserved. Developed and managed by ZUCOL.