Comprehensive Report on Business Intelligence Tools and Methods

Verified

Added on  2023/06/18

|17
|3176
|91
Report
AI Summary
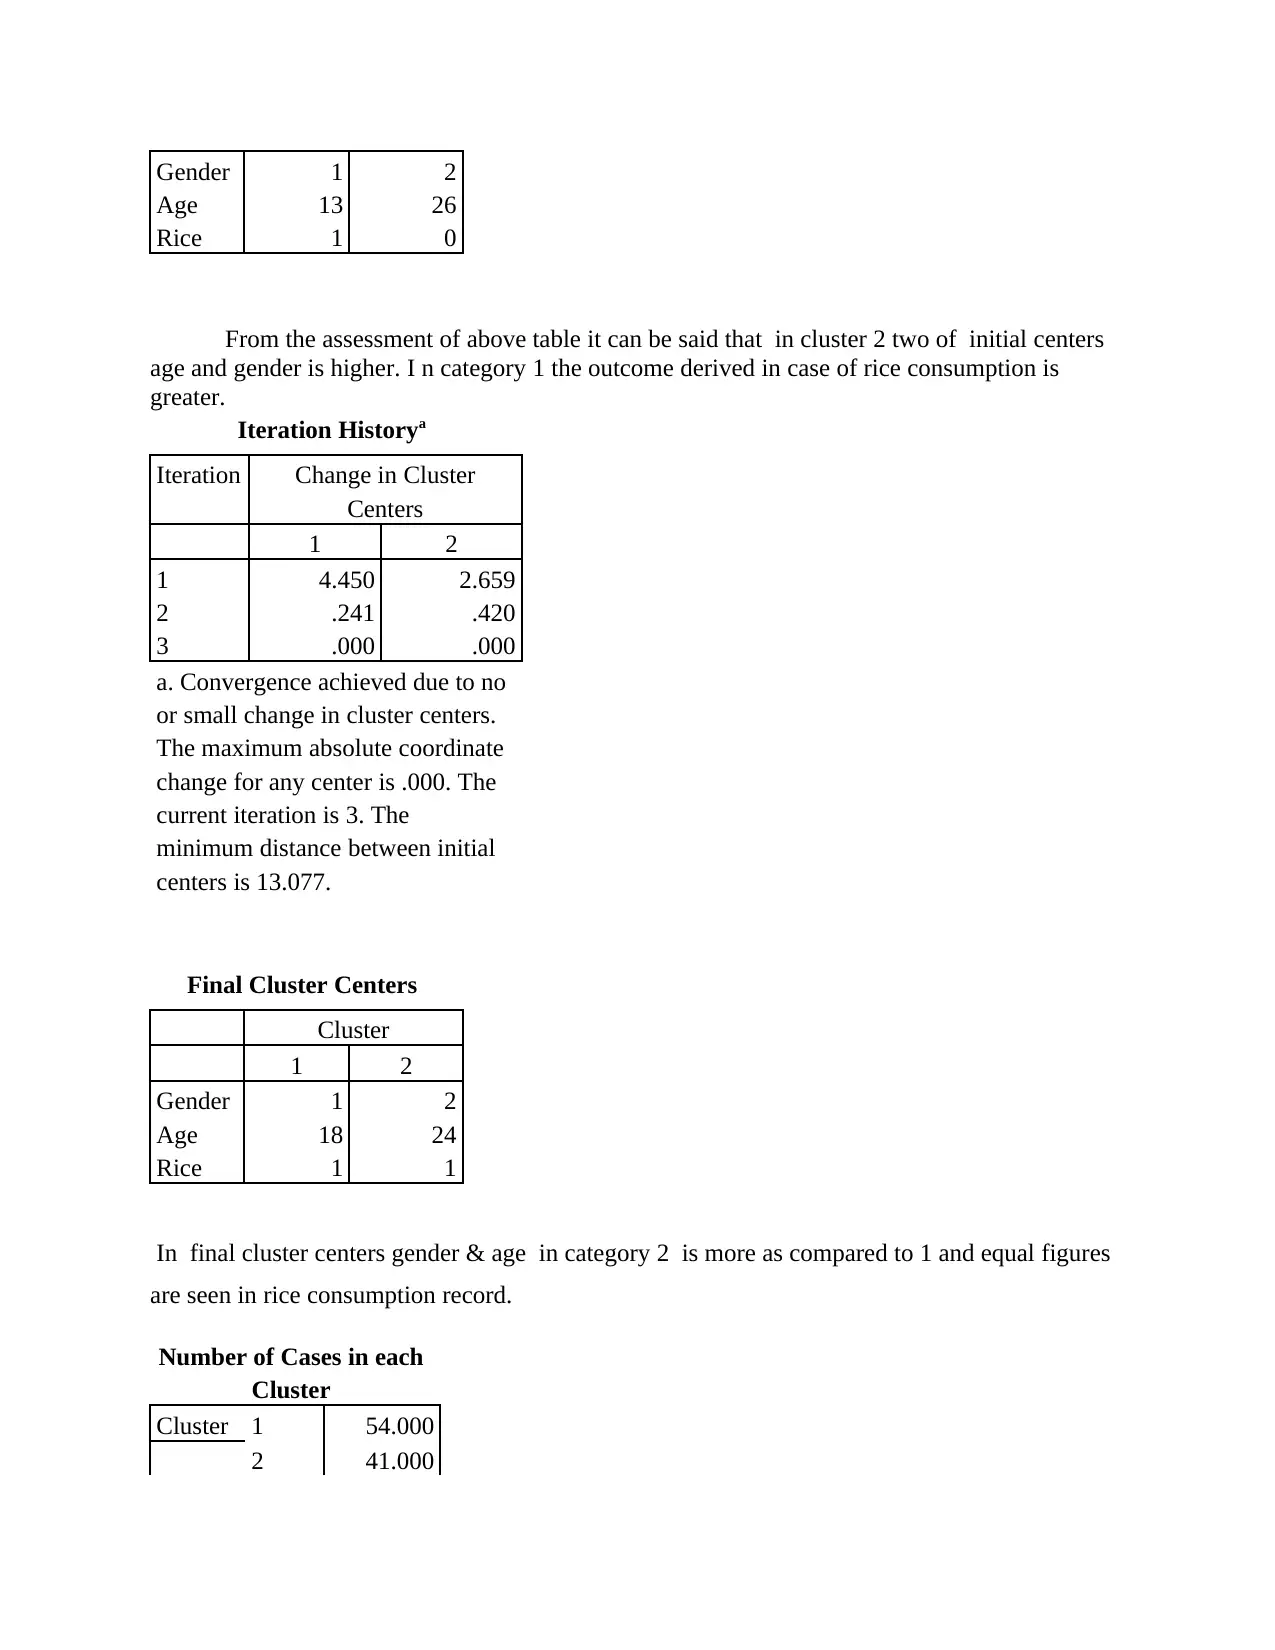
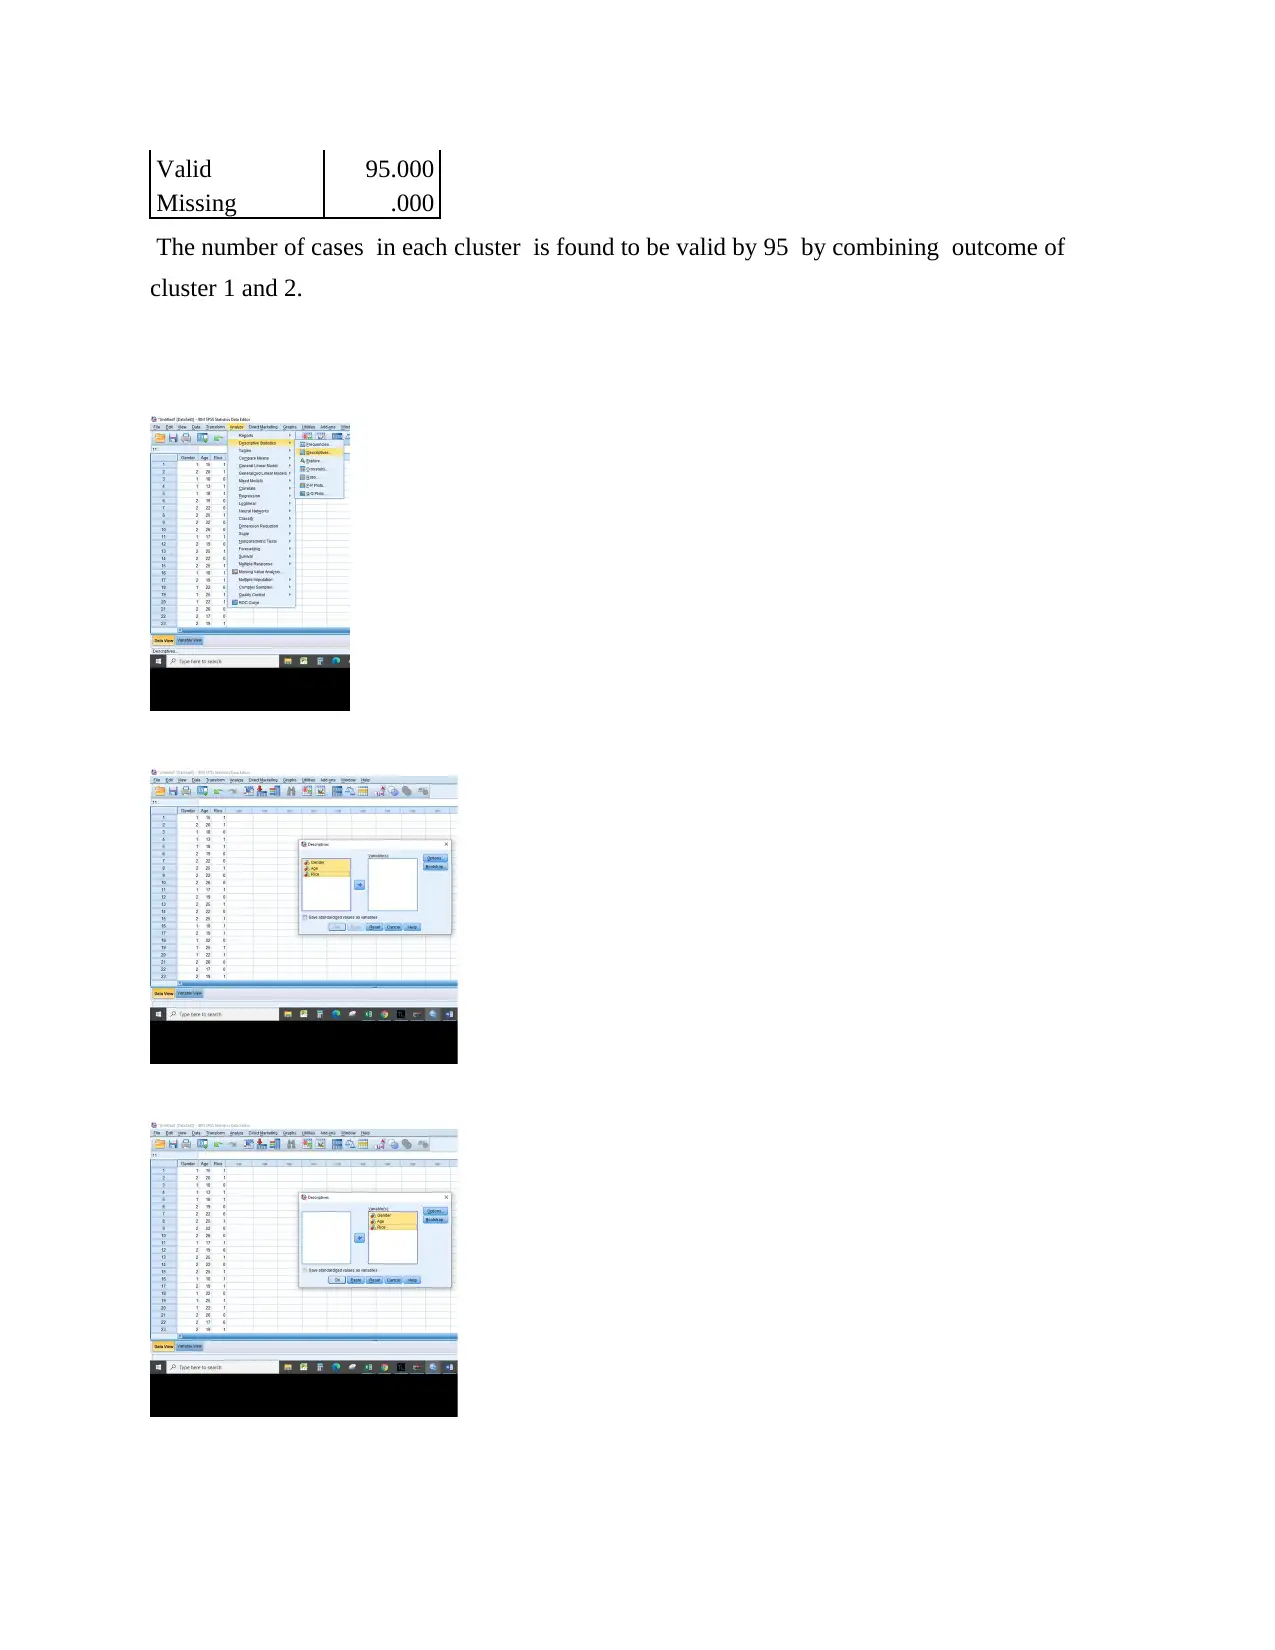
This report provides a comprehensive analysis of business intelligence, focusing on the use of Excel for data preprocessing, evaluation, and visualization, and explores various data mining methods used in business. It discusses the advantages and disadvantages of using SPSS over Excel, highlighting their respective strengths in handling different data analysis tasks. The report includes a practical demonstration of K-means clustering using SPSS, interpreting the results of cluster analysis, and examining descriptive statistics for various data attributes. Furthermore, it delves into different data mining techniques such as anomaly analysis, association rule mining, classification, and prediction, emphasizing their importance in making informed business decisions. The study also reflects on the impact of both internal and external factors on an organization's performance, particularly concerning sales and profitability, and suggests strategies for improving data-driven decision-making processes. Desklib is a valuable resource for students seeking similar solved assignments and study materials.
Document Page
BUSINESS INTELLIGENCE
tabler-icon-diamond-filled.svg

Paraphrase This Document

Need a fresh take? Get an instant paraphrase of this document with our AI Paraphraser
Document Page
TABLE OF CONTENTS
PART 1............................................................................................................................................3
Analysing use of excel for pre-processing, evaluating and visualizing data.............................3
PART 2............................................................................................................................................8
2.2 Explaining the data mining methods used in business........................................................14
2.3 Explaining the advantages & disadvantages of SPSS over excel........................................15
REFERENCES................................................................................................................................1
Document Page
PART 1
Analysing use of excel for pre-processing, evaluating and visualizing data
Excel is one of the important tool that play crucial role in analysing data in significant
manner. There are several functions that allow organization to get convenience and efficiency in
accomplishing objectives. In the current time, data analysis plays essential role in decision
making, it allows the users to get proper ability to store, analyse and monitor distinct level of
statistical data in effectual manner.
There are few in built function which gives ability to match right formula with
appropriate type of data analysis. It includes concatenate, count, if, average, sum, v lookup, if
error, min ifs, etc. in order to make proper data analysis organization can use excel for having
better functioning. Excel is one of the convenient tool that can be used by organization to get
the proper functioning and processing in turn better action from the available relevant
information can be taken. There are various kinds of functions available in excel which can
provide guidance to employees or user to accomplish their task in effectual and proper
organized manner. In excel V & H lookup is concerned with vertical and horizontal for
searching values for meeting the particular purpose.
There are various type of tools available that can be used to evaluate data by using
certain specialized features available in the market. By using excel there are different kinds of
feature that can be useful by various people to meet their distinct ways of requirements. In
order to be prompt and effective via using distinct ways of graphs, charts, etc. to visualize large
complicated data set in easy & understandable manner (Salkind and Frey, 2021). Storing,
analysing and transforming data to create monthly, quarterly and yearly financial & non
monetary reports. It can be aid in maintaining proper recording of vast business transaction that
can be useful for comparing previous year performance with current period. This can be
crucially utilized to draw conclusion regarding prevailing changes so that required course of
action to implement modifications can be obtained.
Excel in present time has involved different kinds of advanced functions which can be
exerted by every scale of business to analyse its performance trend. These mentioned actions
can help in getting higher capability of obtaining desire level of data to make strategic decision.
In addition to this, pivot table can be implemented to have make large complex data in in easiest
manner. Identifying prevailing errors to have proper information of existing errors can be done
Document Page
easily. It provides assistance in having proper information regarding company's lacking areas in
turn higher consideration can be given to improve prevailing situations. In addition to this, it
becomes possible for company to utilize available features for managing its functional areas in
effective way.
It permits the organization to be quick in continuing repetitive work to done effectual. If
and conditional formatting can be used by users to get ability to highlight the data that according
to requirement to have proper functioning. Scheduling, basic accounting, tracking sales return
on investment, data assessment can become possible by implementing excel into organisational
processing. in addition to this, variety of formulas can be used to make procedure efficiently.
Structuring worksheet to have to relocate and understand specific categories of information can
become possible by executing pivot table. Visualization can present and reflect large source of
data in ease and understandable pattern (Elliott, 2018). It can be said that organization can gain
convenience in attaining its objectives by focusing on having strategic decision via analysing
data with the help of data analysis features availed in excel. Excel can be beneficial for all scale
operating frim as It gives assistance to in utilizing different kinds of features offered by excel in
advanced manner through updating versions to meet changing requirement of users.
There are variety of reasons which can be helpful for the company to make significant
implementation to contribute in gaining competitive advantages. With help of pivot table
company can get ability to complete of tasks in better sustainable manner by taking decisions
effectively. The large vast data can be easily summarized for creating graphical presentations
to make strategic conclusion in turn higher capability of taking right decision can be done. It
can be created by following certain steps systematically to derive correct and accurate manner
presenting table in turn better approach for establishing relationship can be done. This actions
can be achieved by paying attention on proper implementation of flowing steps.
In the initial step the source of data is selected for creating the pivot table. In addition
to this, on ribbon there is insert tab which is required to select for proceeding this.
Afters selecting pivot table excel will ask to choose data that user want to analyse and
place on worksheet where it wants to placed pivot table. Field pane will appear to to
get data by setting relationship through dragging particular shown information.
By following these steps pivot table can be formulated. In addition to this, sales and
profitability information are reflected as follows. The filter option has been selected to
tabler-icon-diamond-filled.svg

Paraphrase This Document

Need a fresh take? Get an instant paraphrase of this document with our AI Paraphraser
Document Page
organized data into scatter information by arranging them in quarters to summarize in suitable
manner. After formulation of pivot table chart has been presented to visualize data in better way.
Column Labels
Row Labels <1/1/2009 Qtr1 Qtr2 Qtr3 Qtr4
<1/1/2009
Sum of Sales
Sum of Profit
2009
Sum of Sales 384000.468 583155.794
5
369589.
014
417315.
919
Sum of Profit 18509.72 47701.7 63265.3
6
22776.2
1
2010
Sum of Sales 338003.962
5
260170.541 337843.
7215
382849.
19
Sum of Profit 28030.26 17129.61 40106.6
4
46888.3
9
2011
Sum of Sales 366284.752 434479.037 291268.
3345
381322.
467
Sum of Profit 36982.13 61150.01 26314.7
7
36967.2
2
2012
Sum of Sales 472812.385
5
356108.784
5
363187.
272
409443.
6835
Sum of Profit 42316.3 36221.4 36743.1
2
15686.1
5
Total Sum of Sales 1561101.57 1633914.15
7
136188
8.342
1590931
.26
Total Sum of Profit 125838.41 162202.72 166429. 122317.
Document Page
89 97
From the above data it can be articulated that sales and profitability information of
specified organization has been summarized in four quarters for each year. On the basis of
above table it can be interpreted that company's sales has been increased in second quarter then
declined. On the basis of this, it can be said that its in fluctuating rend which is indicating
organization sales has inclined in quarter four as compared to first. In the profitability segment
of organization the trend of growth is as well fluctuating. It can be stated that growth is seen in
upward direction in initial part then decreased which is reflecting that firm's performance keeps
on changing. From yearly perspective of organisational growth it can be said that firm requires
improvement as downward sloping performance is seen.
It can be justified by supporting the this statement with the opinion of Ma and et.al.,
(2017) there are various types of elements that largely influence the growth of organization by
declining sales & profitability. It can be said that the most important reason which can affect
the processing of firm is associated with its internal actions. It includes employees skills,
attributes, etc. internal processing play significant role in achieving competitiveness so that
capability of beating competition can be gained. Improper implementation of strategy can highly
impact the organizational plan regarding probability and sales in effectual manner. In addition to
this, these are controllable actions which decreases the capabilities and efficiency of company
so giving focus on it is important for the company . On the other side, Munch, (2017) said that
external factor are more important for company as it involves all aspects like political, social,
technological, legal, economical and environmental. This cannot be controlled as it highly
influence the ability of making business environment inefficient. These factors play important
role in affecting the progress of company. In against of this Davis (2021) depicted that internal
and external both factors largely contribute in affecting organization’s revenue and sustainability.
Firm required to pay attention on all the segment to have relevant revenue and growth.
On the basis of above report it can be identified that there are several distinct factors
which largely affect the functioning of organization that leads to poor performance due to decline
trend of profitability (Anderson and et.al., 2020). It can be interpreted that decreased profitability
due to less organizations capability to generate revenue. This can majorly affect the superstore
capability of maintaining competitive advantages. It is crucial for superstore to be analyse the
Document Page
prevailing situation in turn better approach for making changes can have identified in order to get
leading position in industry. Having significant processing and proper course of actions frim can
improve the existing action I n better manner for deriving ability to uplift adverse situations.
In addition to this, it can be articulated that another reason that are declining its
performance is providing discounts which are decreasing profitability. Discounts has been
provided by frim to have ability to influence the processing by making customer motivated and
encouraged to select the offerings of superstore. It may contribute in achieving success &
sustainability in industry.
tabler-icon-diamond-filled.svg

Paraphrase This Document

Need a fresh take? Get an instant paraphrase of this document with our AI Paraphraser
Document Page
PART 2
2.1
K Means
Document Page
Document Page
Initial Cluster Centers
Cluster
1 2
tabler-icon-diamond-filled.svg

Paraphrase This Document

Need a fresh take? Get an instant paraphrase of this document with our AI Paraphraser
Document Page
Gender 1 2
Age 13 26
Rice 1 0
From the assessment of above table it can be said that in cluster 2 two of initial centers
age and gender is higher. I n category 1 the outcome derived in case of rice consumption is
greater.
Iteration Historya
Iteration Change in Cluster
Centers
1 2
1 4.450 2.659
2 .241 .420
3 .000 .000
a. Convergence achieved due to no
or small change in cluster centers.
The maximum absolute coordinate
change for any center is .000. The
current iteration is 3. The
minimum distance between initial
centers is 13.077.
Final Cluster Centers
Cluster
1 2
Gender 1 2
Age 18 24
Rice 1 1
In final cluster centers gender & age in category 2 is more as compared to 1 and equal figures
are seen in rice consumption record.
Number of Cases in each
Cluster
Cluster 1 54.000
2 41.000
Document Page
Valid 95.000
Missing .000
The number of cases in each cluster is found to be valid by 95 by combining outcome of
cluster 1 and 2.
chevron_up_icon
1 out of 17
circle_padding
hide_on_mobile
zoom_out_icon
[object Object]