Business Intelligence Report: Westpac Dashboard Analysis
VerifiedAdded on 2020/07/22
|12
|2387
|354
Report
AI Summary
This report presents a business intelligence dashboard analysis focused on Westpac, a well-known Australian bank. The assignment uses Tableau to visualize data and identify potential threats and opportunities for the firm. The report is structured into two parts: Part A discusses the suggested audience, end-user groups, roles, benefits, and data considerations for the dashboard. It also covers potential challenges in implementation, including data quality, availability, and user satisfaction. The BI lifecycle and steps for implementation are also mentioned. Part B presents the developed dashboard, which visualizes firm profitability, economic indicators, and debt strategies. The analysis reveals threats such as declining profitability and potential NPA increases, as well as opportunities related to economic growth. Internal and external data sources are discussed, along with the motivations for using them. The report concludes by summarizing the key findings and the overall effectiveness of the dashboard in supporting business decision-making. The report also includes figures illustrating profitability, economic indicators, and the BI lifecycle.

BUSINESS INTELLIGENCE
Paraphrase This Document
Need a fresh take? Get an instant paraphrase of this document with our AI Paraphraser
TABLE OF CONTENTS
INTRODUCTION...........................................................................................................................1
Part A...............................................................................................................................................1
Suggested audience for the dashboard (eg: management, all staff, partners and suppliers)...........1
End user groups...........................................................................................................................1
Specific to organisation...............................................................................................................1
Roles and responsibilities............................................................................................................1
Benefits of end users....................................................................................................................1
What are the benefits that a dashboard can bring in general (be as specific as you can to that
organisation’s business needs).........................................................................................................2
General benefits...........................................................................................................................2
Relation to KPIs...........................................................................................................................2
Opportunities...............................................................................................................................2
Threats.........................................................................................................................................2
Which data should be included (internal and external data)............................................................4
Internal: Data created inside the organisation.............................................................................4
External: Data available outside the organisation......................................................................4
Motivation for using internal and external data...........................................................................5
Potential challenges in implementing the dashboard.......................................................................5
Data quality challenge in creating dashboard..............................................................................5
Data availability...........................................................................................................................5
Selecting correct data...................................................................................................................5
End user satisfaction....................................................................................................................6
Choosing correct visualisation.....................................................................................................6
Others...........................................................................................................................................6
Planned method for implementing, including who needs to be involved........................................6
Mention BI Lifecycle...................................................................................................................6
Steps for implemention and deployment of model.....................................................................7
Development team.......................................................................................................................7
Costs............................................................................................................................................7
Part B...............................................................................................................................................8
Dashboard....................................................................................................................................8
CONCLUSION................................................................................................................................8
REFERENCES................................................................................................................................9
Figure 1Profitability of firm............................................................................................................3
Figure 2Economic indicators and firm debt strategy.......................................................................4
Figure 3Life cycle............................................................................................................................6
⊘ This is a preview!⊘
Do you want full access?
Subscribe today to unlock all pages.
Trusted by 1+ million students worldwide
INTRODUCTION
Business intelligence is one of domain whose face change at fast rate. In past couple of
years many new changes happened in mentioned area. Tableau is the common software that is
used for data visualization. In current report, for Westpac which is one of well known bank of
Australia dashboard is prepared which reflect threats and opportunities that firm may faced or
explored in the business. Charts related to firm profitability, economic condition of nation and
possibility of origination of NPA in business is identified. In this way entire dashboard is
prepared and potential threats and opportunities are identified for the business firm. It can be said
that dashboard is one of powerful approach that managers can use for making their day to day
business decisions.
Part A
Suggested audience for the dashboard (eg: management, all staff, partners
and suppliers)
End user groups
End users group will be managers of company and other staff members that work at
middle level of management and support top managers.
Specific to organisation
Dashbard is specifically designed for Westpac in order to help its managers in identifying
threats and opportunities that are in the market. Interactive features are developed and additional
statistics are revealed in chart so that managers can get overview of threats and opportunity that
are in market.
Roles and responsibilities
Managers have to make decisions about rate at which they are distributing loans among
their customers. It is responsibility of managers to track changes in economic environment and
firm profitability in proper manner so that on time risk management strategy can be formulated
in business.
Benefits of end users
Dashboard will help managers in identifying pattern in which variable values moves and
changes that observed in same in past couple of years. Thus, intensity of critical situation and
1 | P a g e
Paraphrase This Document
Need a fresh take? Get an instant paraphrase of this document with our AI Paraphraser
areas where firm need to work at preliminary stage will be easily identified by managers just by
taking single look at screen.
What are the benefits that a dashboard can bring in general (be as specific as
you can to that organisation’s business needs)
General benefits
Westpac major business need is to control cost, increase income and maintain cap on
NPA so less bad debt remain in balance sheet. Dashboard that is prepared fulfill all these needs
of stakeholders. Managers will be able to identify whether loan allocation policy which they are
following is viable in current time period. From dashboard managers will obtain clue about
severity of situation and area where they need to work.
Relation to KPIs
Dashboard has relationship with KPI or key performance indicator. This is because KPI
help managers in tracking down firm performance on monthly, daily or yearly basis. In same
way dashboard is reflecting performance of economic indicators and Westpac from 2012 to
2016. Thus, dashboard is doing working similar to KPI and both are related to each other.
Opportunities
There are lots of opportunities that are available to Westpac and one of them is that
unemployement rate start decline and GDP is increasing but fluctuation is observe in same.
Australia is one of economy that is in strong condition and it is expected that GDP will increase
by good percentage. Gross disposable income consistently elevate in past couple of years which
means that more people may take loan and can deposit more money in bank. This, will push
profitability in business. Thus, it can be said that there are ample opportunity that are available to
firm in business.
Threats
There are various threats to which firm is exposed and one of them is that profitability of
Westpac decline. Pressure on revenue is observed from 2015 where it increase only by 1705
which is much lower in comparison to earlier years growth rates. Finally, in last analyzed year
sales tumbeled by 657 AUD which signal that there is threat and firm revenue generating
capacity erode.
2 | P a g e
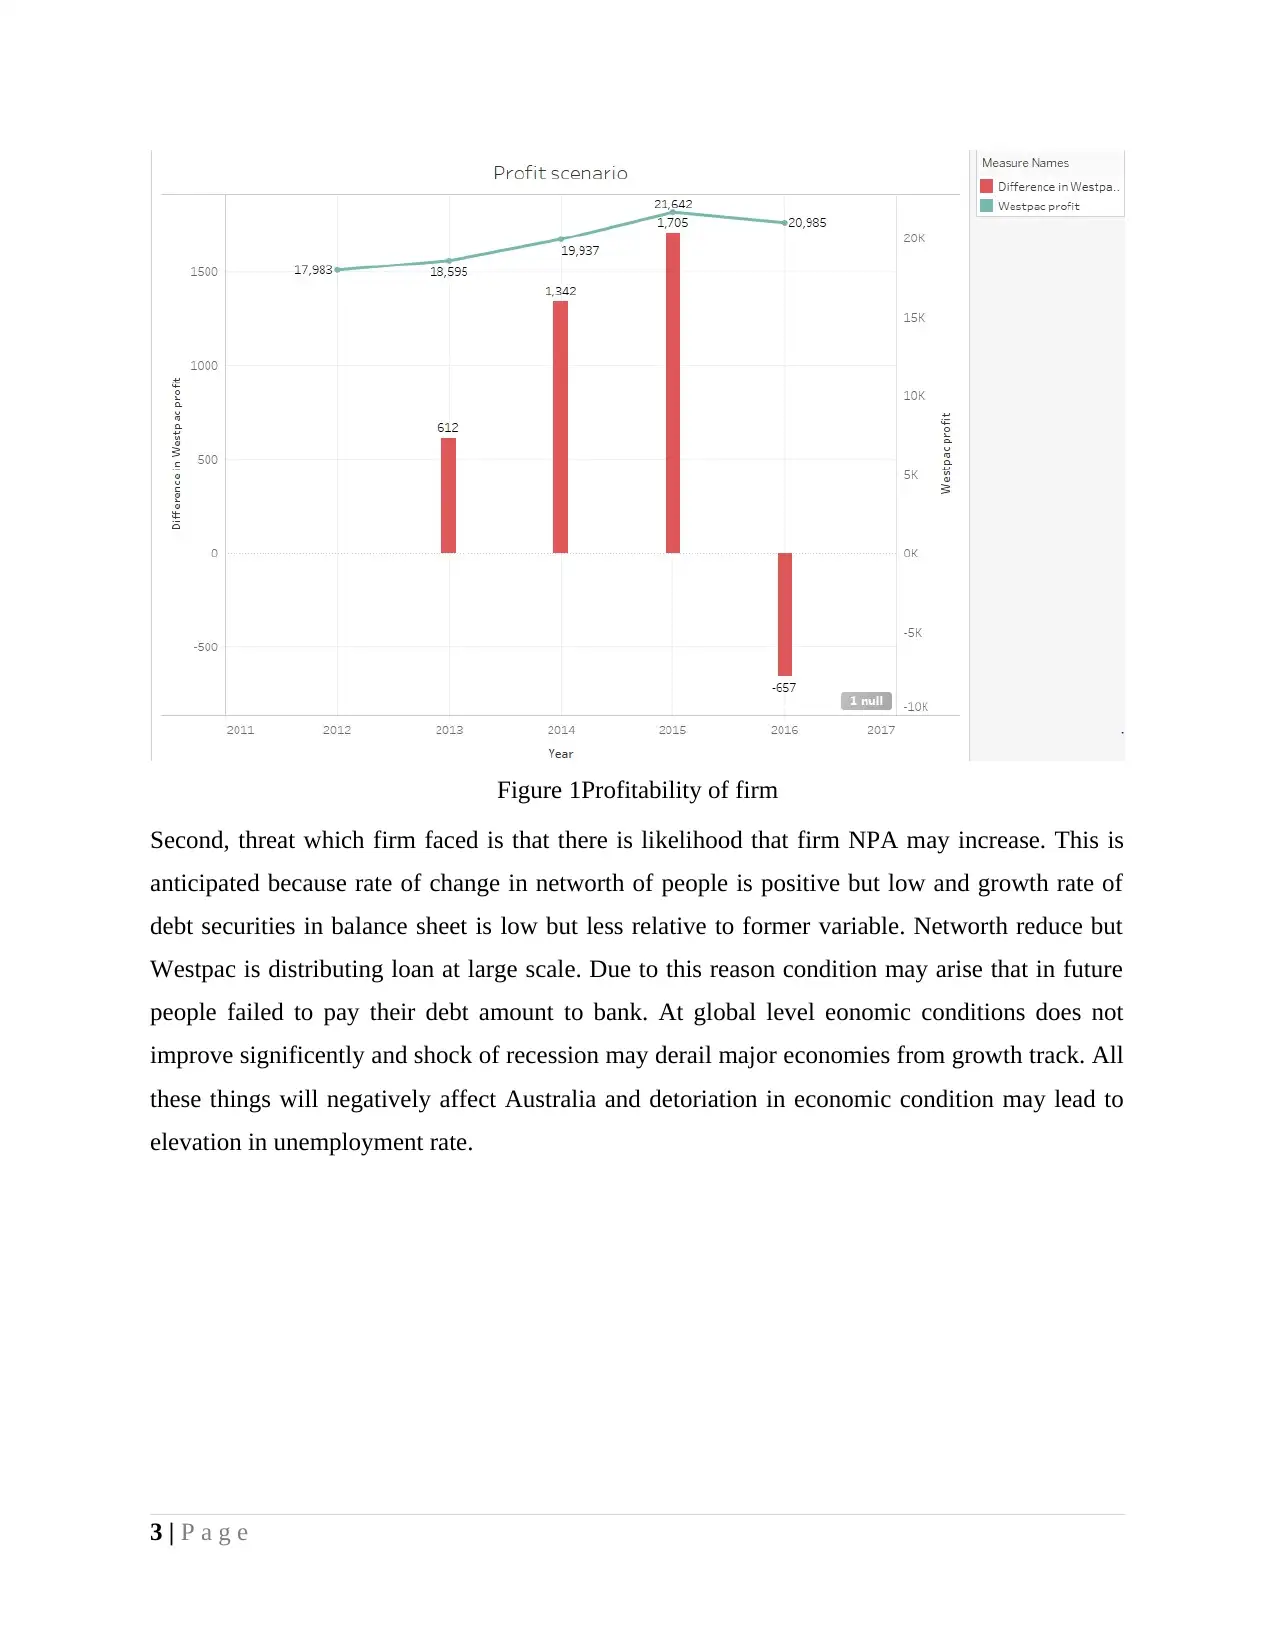
Figure 1Profitability of firm
Second, threat which firm faced is that there is likelihood that firm NPA may increase. This is
anticipated because rate of change in networth of people is positive but low and growth rate of
debt securities in balance sheet is low but less relative to former variable. Networth reduce but
Westpac is distributing loan at large scale. Due to this reason condition may arise that in future
people failed to pay their debt amount to bank. At global level eonomic conditions does not
improve significently and shock of recession may derail major economies from growth track. All
these things will negatively affect Australia and detoriation in economic condition may lead to
elevation in unemployment rate.
3 | P a g e
⊘ This is a preview!⊘
Do you want full access?
Subscribe today to unlock all pages.
Trusted by 1+ million students worldwide
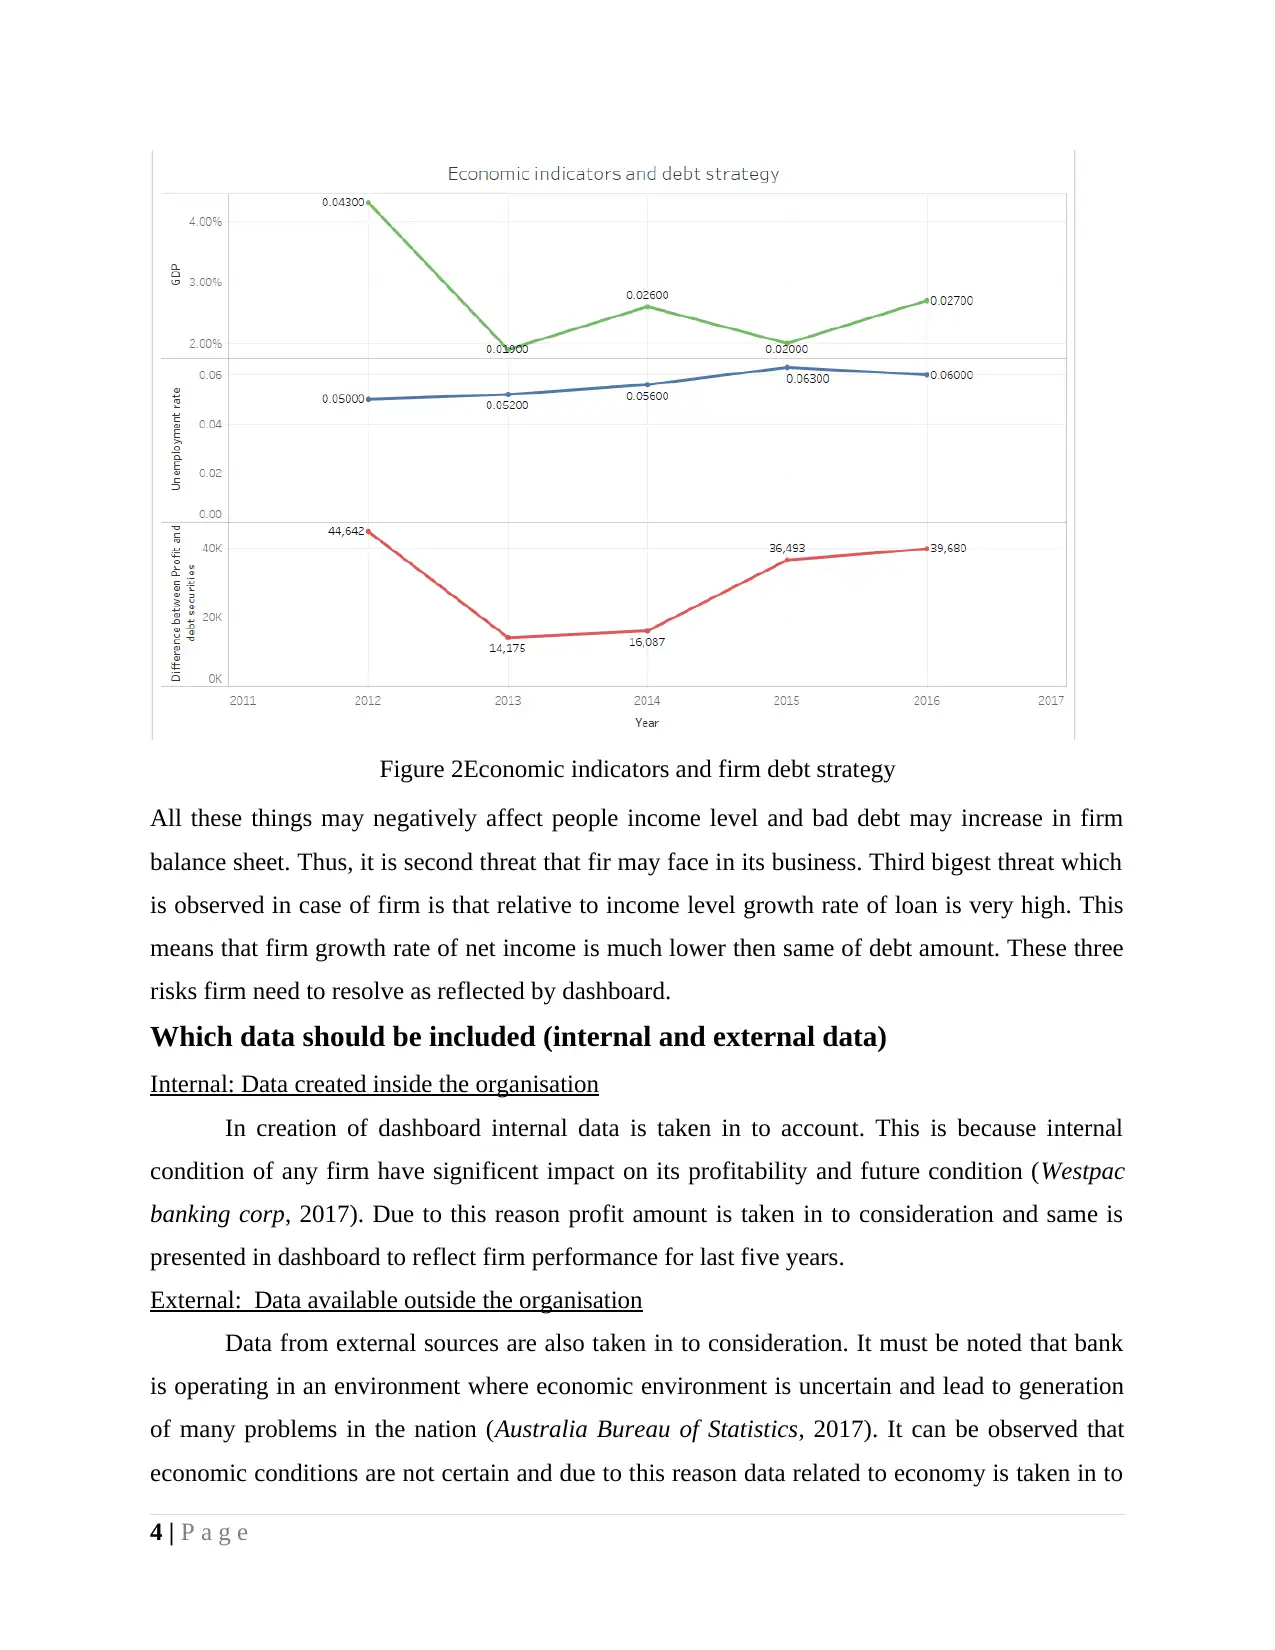
Figure 2Economic indicators and firm debt strategy
All these things may negatively affect people income level and bad debt may increase in firm
balance sheet. Thus, it is second threat that fir may face in its business. Third bigest threat which
is observed in case of firm is that relative to income level growth rate of loan is very high. This
means that firm growth rate of net income is much lower then same of debt amount. These three
risks firm need to resolve as reflected by dashboard.
Which data should be included (internal and external data)
Internal: Data created inside the organisation
In creation of dashboard internal data is taken in to account. This is because internal
condition of any firm have significent impact on its profitability and future condition (Westpac
banking corp, 2017). Due to this reason profit amount is taken in to consideration and same is
presented in dashboard to reflect firm performance for last five years.
External: Data available outside the organisation
Data from external sources are also taken in to consideration. It must be noted that bank
is operating in an environment where economic environment is uncertain and lead to generation
of many problems in the nation (Australia Bureau of Statistics, 2017). It can be observed that
economic conditions are not certain and due to this reason data related to economy is taken in to
4 | P a g e
Paraphrase This Document
Need a fresh take? Get an instant paraphrase of this document with our AI Paraphraser
account in terms of GDP percentage and un employment data. Use of internal and external data
help firm in making meaningful dashboard for managers.
Motivation for using internal and external data
Main aim of preparing dashboard was to help managers in identifying threat and
opportunity that is associated with current business. Firm is operating in banking sector and due
to this reason it is necessary to track economic environment and internal factors that may affect
firm performnace. Thus, NPA likelihood conditon is created and profitability is plotted in
Tableau. Economic conditions have impact on business firm and due to this reason GDP and
unemployment rate data is taken in to consideration. Hence, these were factors that motivate use
of internal and external data.
Potential challenges in implementing the dashboard
Data quality challenge in creating dashboard
There are data quality challenges in creating dashboard because it is known to individual
that what are objectives behind creating dashboard but no one knows in initial stage that what
sort of variables need to be considered for analysis purpose. In order to meet this challenge and
to ensure that data quality is appropriate only last five year data taken in to consideration so that
only relevant trends can be tracked. Moreover, it is ensured that there are no missing values in
dataset. Hence, by taking all these steps it is ensured that high quality data is taken in to account
for analysis purpose.
Data availability
Availability of data is biggest challenge that Tableau developer usually faced for analysis
purpose. Every sort of data is not available within firm, same need to be gathered from the
market. In current report data availability problem is sort out by visiting website of Australia
Bureau of Statistics and relevant facts as well as figures are gathered from same. From relevant
website firm sales revenue and profitability related data is taken in to account. In this way entire
data is gathered from relevant sources.
Selecting correct data
Selecting correct data is one of tough task in data visualization because objective is clear
but there are lots of variables that can be used in respect to that objective. One have to determine
whether one variable will be appropriate for research or not. In this regard different variables are
analyzed and evaluated. Those variables that seem best are picked for analysis purpose. For
5 | P a g e
example data related to gross disposable income is taken in dashboard. Earlier data gatherd from
Australia Bureau of Statistics website. In relevant excel there are number of variables that are
related to income level. All variables were reviewed and finally best one is picked and in this
way by prudently selecting variables ultimately dashboard is prepared.
End user satisfaction
End user satisfaction is one of main challenge in data visualization and due to this reason
by considering number of fctors only suitable variable is taken in to account.
Choosing correct visualisation
Chossing appropriate structure or layout in dashboard is major challenge. Apart from this,
selecting appropriate sort of charts is another difficult challenge in preparing dashboard. In order
to sort out this problem several times structure is changed to get best one. Moreover, those facts
that have due importance for managers are placed on top of dashboard.
Others
Apart from this, other main challenge was to extract information from dataset that is not
in excel sheet in order to give more clear picture of situation to managers.
Planned method for implementing, including who needs to be involved
Mention BI Lifecycle
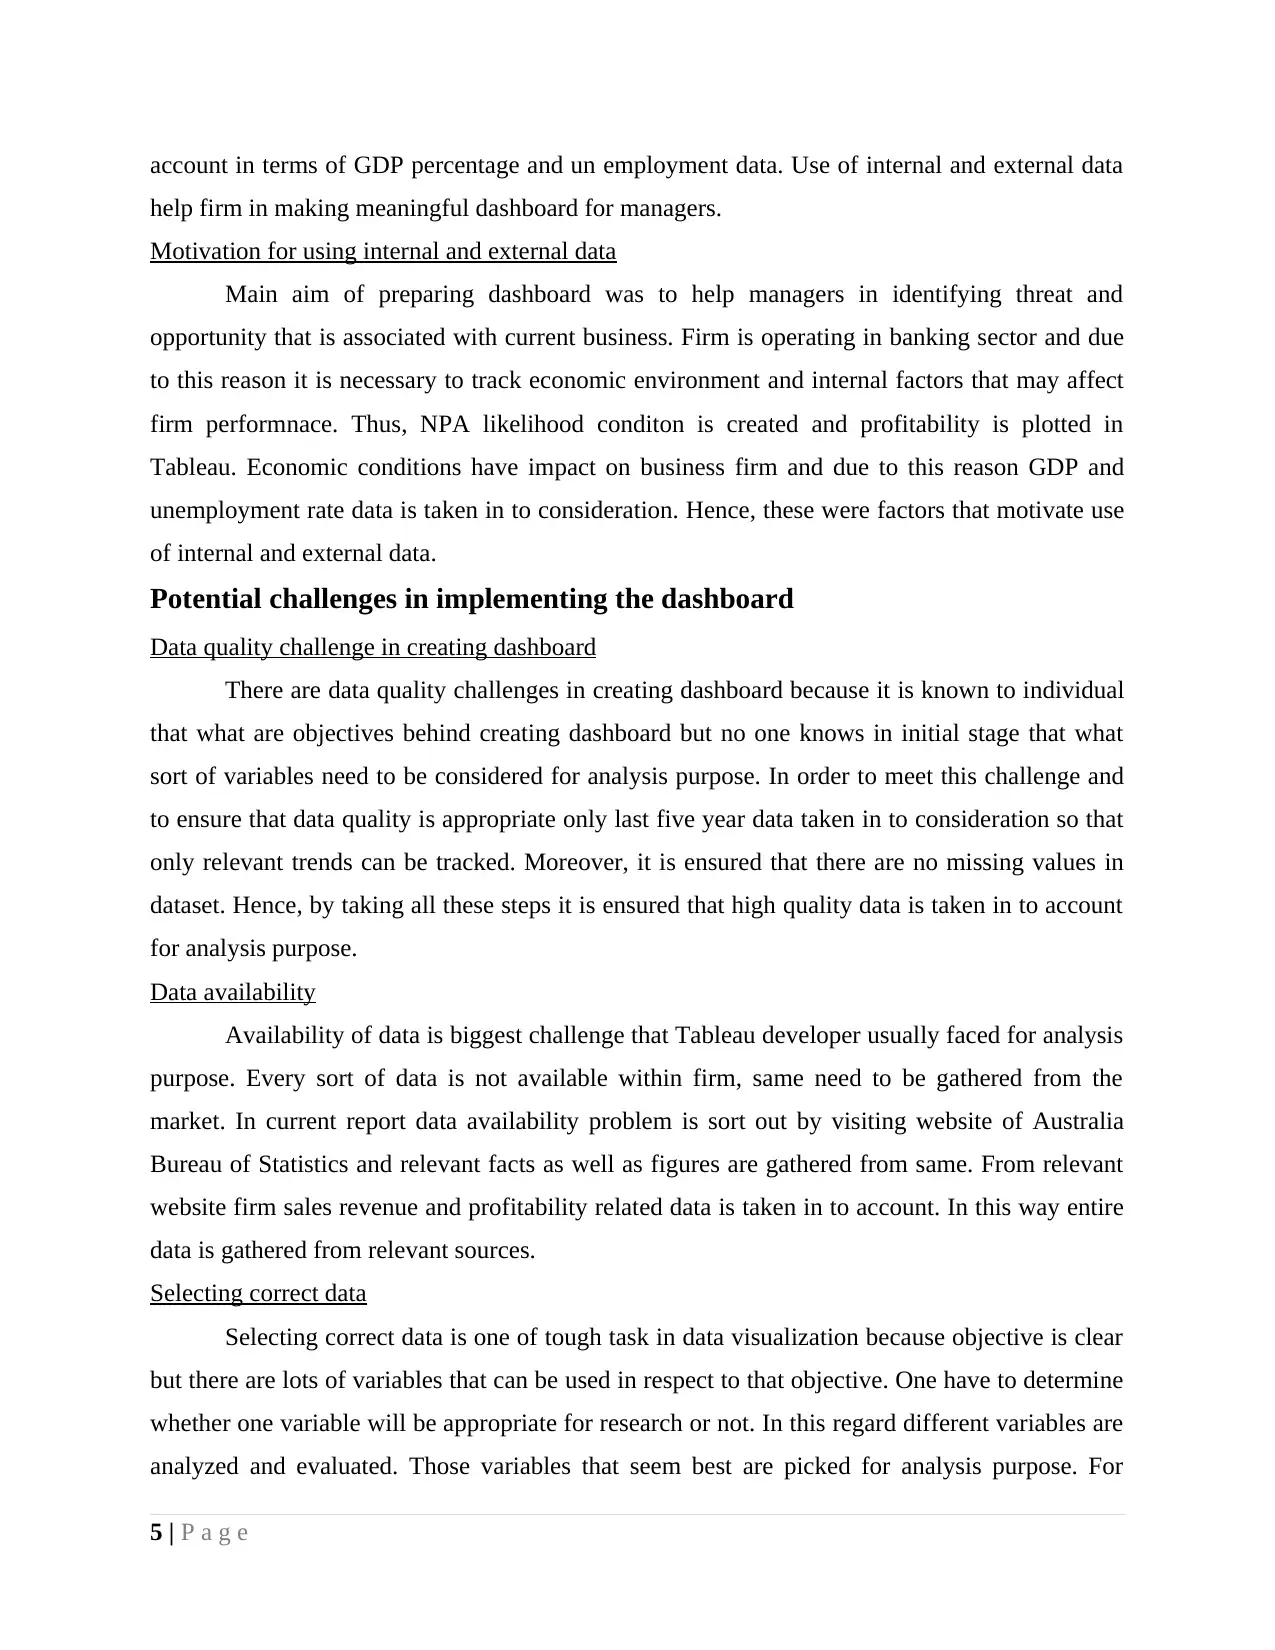
Figure 3Life cycle
(Source: Business intelligence lifecycle, 2017)
6 | P a g e
Australia Bureau of Statistics website. In relevant excel there are number of variables that are
related to income level. All variables were reviewed and finally best one is picked and in this
way by prudently selecting variables ultimately dashboard is prepared.
End user satisfaction
End user satisfaction is one of main challenge in data visualization and due to this reason
by considering number of fctors only suitable variable is taken in to account.
Choosing correct visualisation
Chossing appropriate structure or layout in dashboard is major challenge. Apart from this,
selecting appropriate sort of charts is another difficult challenge in preparing dashboard. In order
to sort out this problem several times structure is changed to get best one. Moreover, those facts
that have due importance for managers are placed on top of dashboard.
Others
Apart from this, other main challenge was to extract information from dataset that is not
in excel sheet in order to give more clear picture of situation to managers.
Planned method for implementing, including who needs to be involved
Mention BI Lifecycle
Figure 3Life cycle
(Source: Business intelligence lifecycle, 2017)
6 | P a g e
⊘ This is a preview!⊘
Do you want full access?
Subscribe today to unlock all pages.
Trusted by 1+ million students worldwide
As part of BI life cycle first of all detail about business requirements is gathered.
Thereafter, model building work begins and planning about layout of dashboard as well as chart
preparation is done (Business intelligence lifecycle, 2017). Finally, as per decided dashboard is
prepared. It is BI lifecycle that is followed in current project.
Steps for implemention and deployment of model
In order to implement model in first stage objective was prepared which is identifying
potential threat and opportunity for the firm. Then in second stage variables that need to be
included in the model are determined. In third stage, time period for which data need to be taken
is determined. In fourth stage in different sheets varied variables entered in to row and column
and charts are developed. In fifth stage, all charts arranged in single dashboard in logical
sequence and in this way dashboard was prepared. In order to give interactive feature to it in
sixth stage filters were created in left side of dashboard as part of deployment.
Development team
Under development team there was single Tableau developer that have good knowledge
of relevant software.
Costs
Consumption of lot of time was major cost of this project. No payment was made to
obtain data from external sources. Hence, it can be said that cost of conducting project is very
low and it is easily developed in moderate time period. Time was also devoted to research
relevant facts and figures from websites.
7 | P a g e
Paraphrase This Document
Need a fresh take? Get an instant paraphrase of this document with our AI Paraphraser
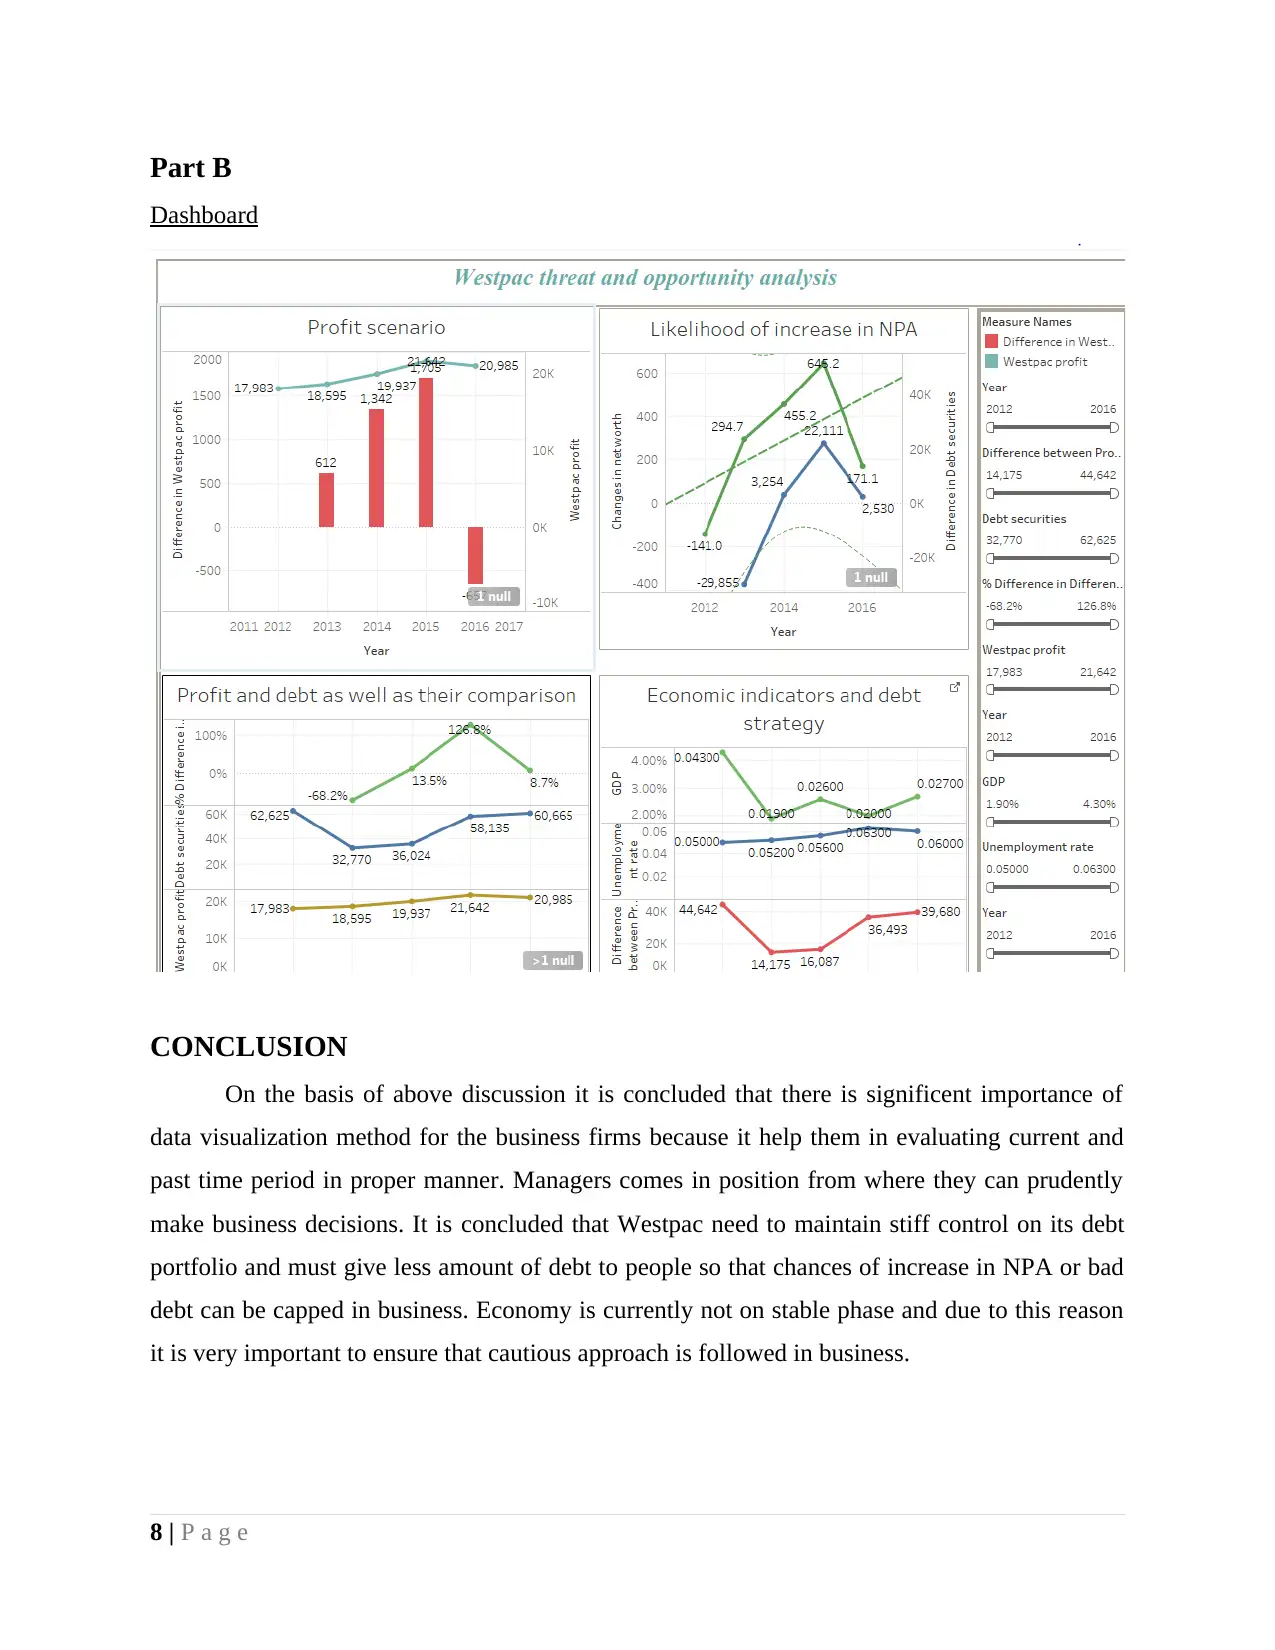
Part B
Dashboard
CONCLUSION
On the basis of above discussion it is concluded that there is significent importance of
data visualization method for the business firms because it help them in evaluating current and
past time period in proper manner. Managers comes in position from where they can prudently
make business decisions. It is concluded that Westpac need to maintain stiff control on its debt
portfolio and must give less amount of debt to people so that chances of increase in NPA or bad
debt can be capped in business. Economy is currently not on stable phase and due to this reason
it is very important to ensure that cautious approach is followed in business.
8 | P a g e
REFERENCES
Online
Australia Bureau of Statistics, 2017. [Online]. Available through:<
http://search.abs.gov.au/s/search.html?
query=GDP&collection=abs&form=simple&profile=_default>. [Accessed on 16th
September 2017].
Business intelligence lifecycle, 2017. [Online]. Available through:<
https://intellipaat.com/tutorial/data-warehouse-tutorial/business-intelligence-lifecycle/>. [Ac
cessed on 16th September 2017].
Westpac banking corp, 2017. [Online]. Available through:<
http://financials.morningstar.com/ratios/r.html?t=WBK>. [Accessed on 16th September
2017].
9 | P a g e
⊘ This is a preview!⊘
Do you want full access?
Subscribe today to unlock all pages.
Trusted by 1+ million students worldwide
1 out of 12
Related Documents


Your All-in-One AI-Powered Toolkit for Academic Success.
+13062052269
info@desklib.com
Available 24*7 on WhatsApp / Email
![[object Object]](/_next/static/media/star-bottom.7253800d.svg)
Unlock your academic potential
Copyright © 2020–2026 A2Z Services. All Rights Reserved. Developed and managed by ZUCOL.