In-depth Financial Analysis of Business: Ratios, Share Price Trends
VerifiedAdded on 2024/06/03
|22
|3801
|352
Report
AI Summary
This report provides a comprehensive financial analysis of Business, an Australian agricultural company, using its 2017 annual report. It examines fundamental ratios like liquidity, solvency, and profitability to assess the company's financial position. The report analyzes the impact of Australian Securities Exchange (ASX) announcements on the company's share price, aiming to predict future share value trends. It includes calculations of beta values using the Capital Asset Pricing Model (CAPM), debt ratios, and the company's dividend policy to evaluate its overall performance. The analysis culminates in a recommendation regarding the investment potential of Business, considering its financial health and market dynamics.
Finance for business
1
1
Paraphrase This Document
Need a fresh take? Get an instant paraphrase of this document with our AI Paraphraser
Table of Contents
Introduction:..................................................................................................................................3
1. Prepare a brief description of the company............................................................................4
2. Specify ownership-governance structure of the company.....................................................5
3. Calculate the following Fundamental ratios for your selected company for the past 2
years................................................................................................................................................7
4. Prepare a graph/chart for movements in the monthly share price over the last two years
.......................................................................................................................................................10
5. Significant announcements which may have influenced the share price of your company.
.......................................................................................................................................................12
6. Financial data of company:.....................................................................................................14
7. Weighted average cost of capital............................................................................................15
8. The debt ratio of the company................................................................................................17
9. Dividend Policy........................................................................................................................18
10. Letter of recommendation....................................................................................................19
Conclusion....................................................................................................................................20
References:...................................................................................................................................21
2
Introduction:
The report is prepared for analyzing and evaluating the financial position of the company
“Business”. It is an Australian agricultural company which started its operations in 1988. The
annual report for the company for 2017 has been used to make judgments. The aim of the project
is to analyse the financial position by using financial ratios, effect of Australian Securities
Exchange (ASX) announcements on the share price to predict future of the share value,
calculation of beta values and Capital Asset Pricing Model (CAPM), debt ratios and dividend
policy of the firm have been analysed to predict the future performance of the firm. Then this
information will be used to decide whether the company is worth investing or not.
3
⊘ This is a preview!⊘
Do you want full access?
Subscribe today to unlock all pages.
Trusted by 1+ million students worldwide
1. Prepare a brief description of the company.
Business is one of the leading companies in its industry which started its operation in 1988. It’s
one of the major activities include producing prawn which is used by both Australian and
international customers. It sells them under the brand Crystal Bay Prawns®. The company has
seen a whopping 43 % compounded annual growth over the last 4 years, which makes the
company largest prawn farmer in Australia. Along with this CO2 Australia, another subsidiary of
the company is one of the leading environmental services company (Seafarms Group Limited,
2017).
4
Paraphrase This Document
Need a fresh take? Get an instant paraphrase of this document with our AI Paraphraser
2. Specify ownership-governance structure of the company.
Substantial shareholders of the company:
These are the shareholders who own a significant number of shares in the company. This
ownership helps them to have a say in company’s decision-making process. Seafarms Group
Limited substantial shareholders are listed below -
With higher than 20% of shareholdings –
With reference to the information provided by the company for the year ended 2017, the
Business only has one substantial shareholder who holds more than 20 % of the share capital –
Gabor Holding Pty Ltd and associates with holdings worth 453,391,227 (32.30%) shares.
As no individual family has a substantial shareholding in the Seafarms Group Limited it can be
said that it is a non-family company. So, the company is an independent company.
With higher than 5% of shareholdings – There are no shareholders holding more than 5 %
shares and there is only one substantial shareholder, mentioned above
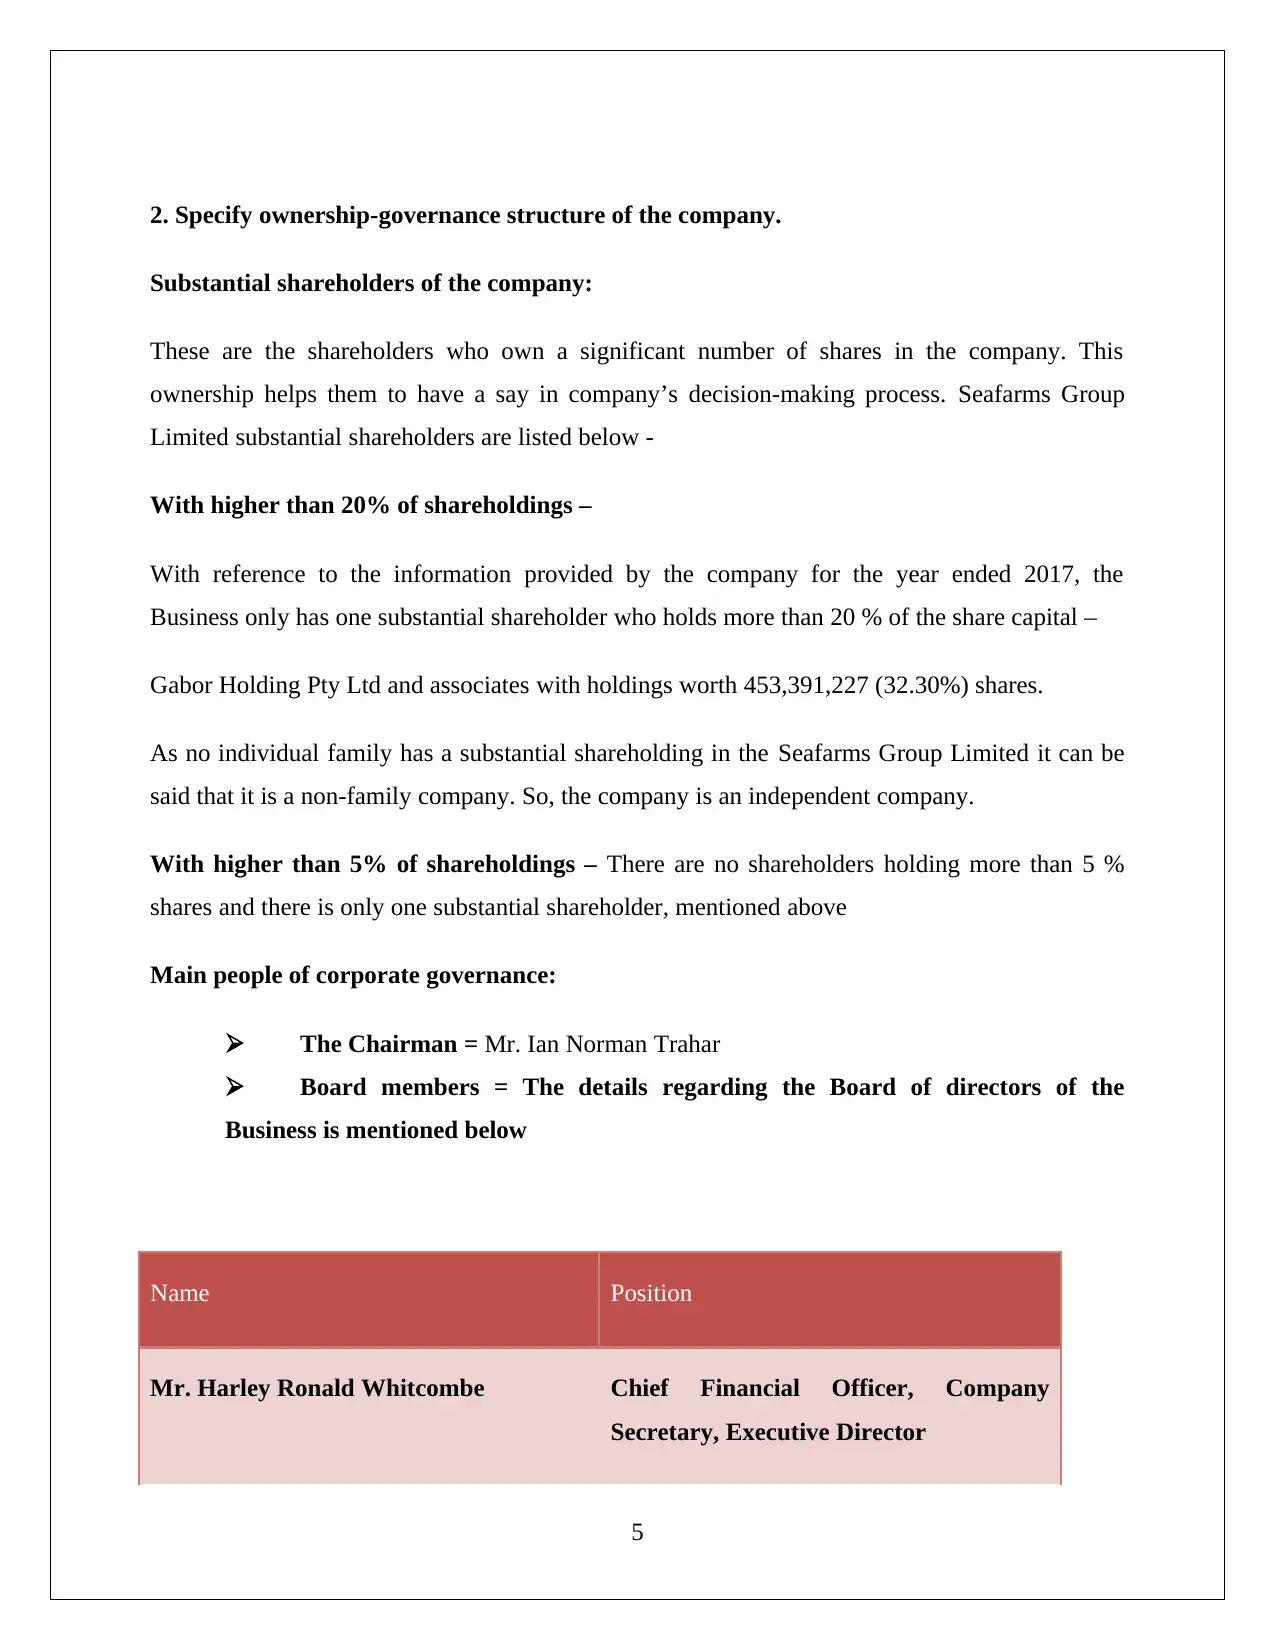
Main people of corporate governance:
The Chairman = Mr. Ian Norman Trahar
Board members = The details regarding the Board of directors of the
Business is mentioned below
Name Position
Mr. Harley Ronald Whitcombe Chief Financial Officer, Company
Secretary, Executive Director
5
Substantial shareholders of the company:
These are the shareholders who own a significant number of shares in the company. This
ownership helps them to have a say in company’s decision-making process. Seafarms Group
Limited substantial shareholders are listed below -
With higher than 20% of shareholdings –
With reference to the information provided by the company for the year ended 2017, the
Business only has one substantial shareholder who holds more than 20 % of the share capital –
Gabor Holding Pty Ltd and associates with holdings worth 453,391,227 (32.30%) shares.
As no individual family has a substantial shareholding in the Seafarms Group Limited it can be
said that it is a non-family company. So, the company is an independent company.
With higher than 5% of shareholdings – There are no shareholders holding more than 5 %
shares and there is only one substantial shareholder, mentioned above
Main people of corporate governance:
The Chairman = Mr. Ian Norman Trahar
Board members = The details regarding the Board of directors of the
Business is mentioned below
Name Position
Mr. Harley Ronald Whitcombe Chief Financial Officer, Company
Secretary, Executive Director
5
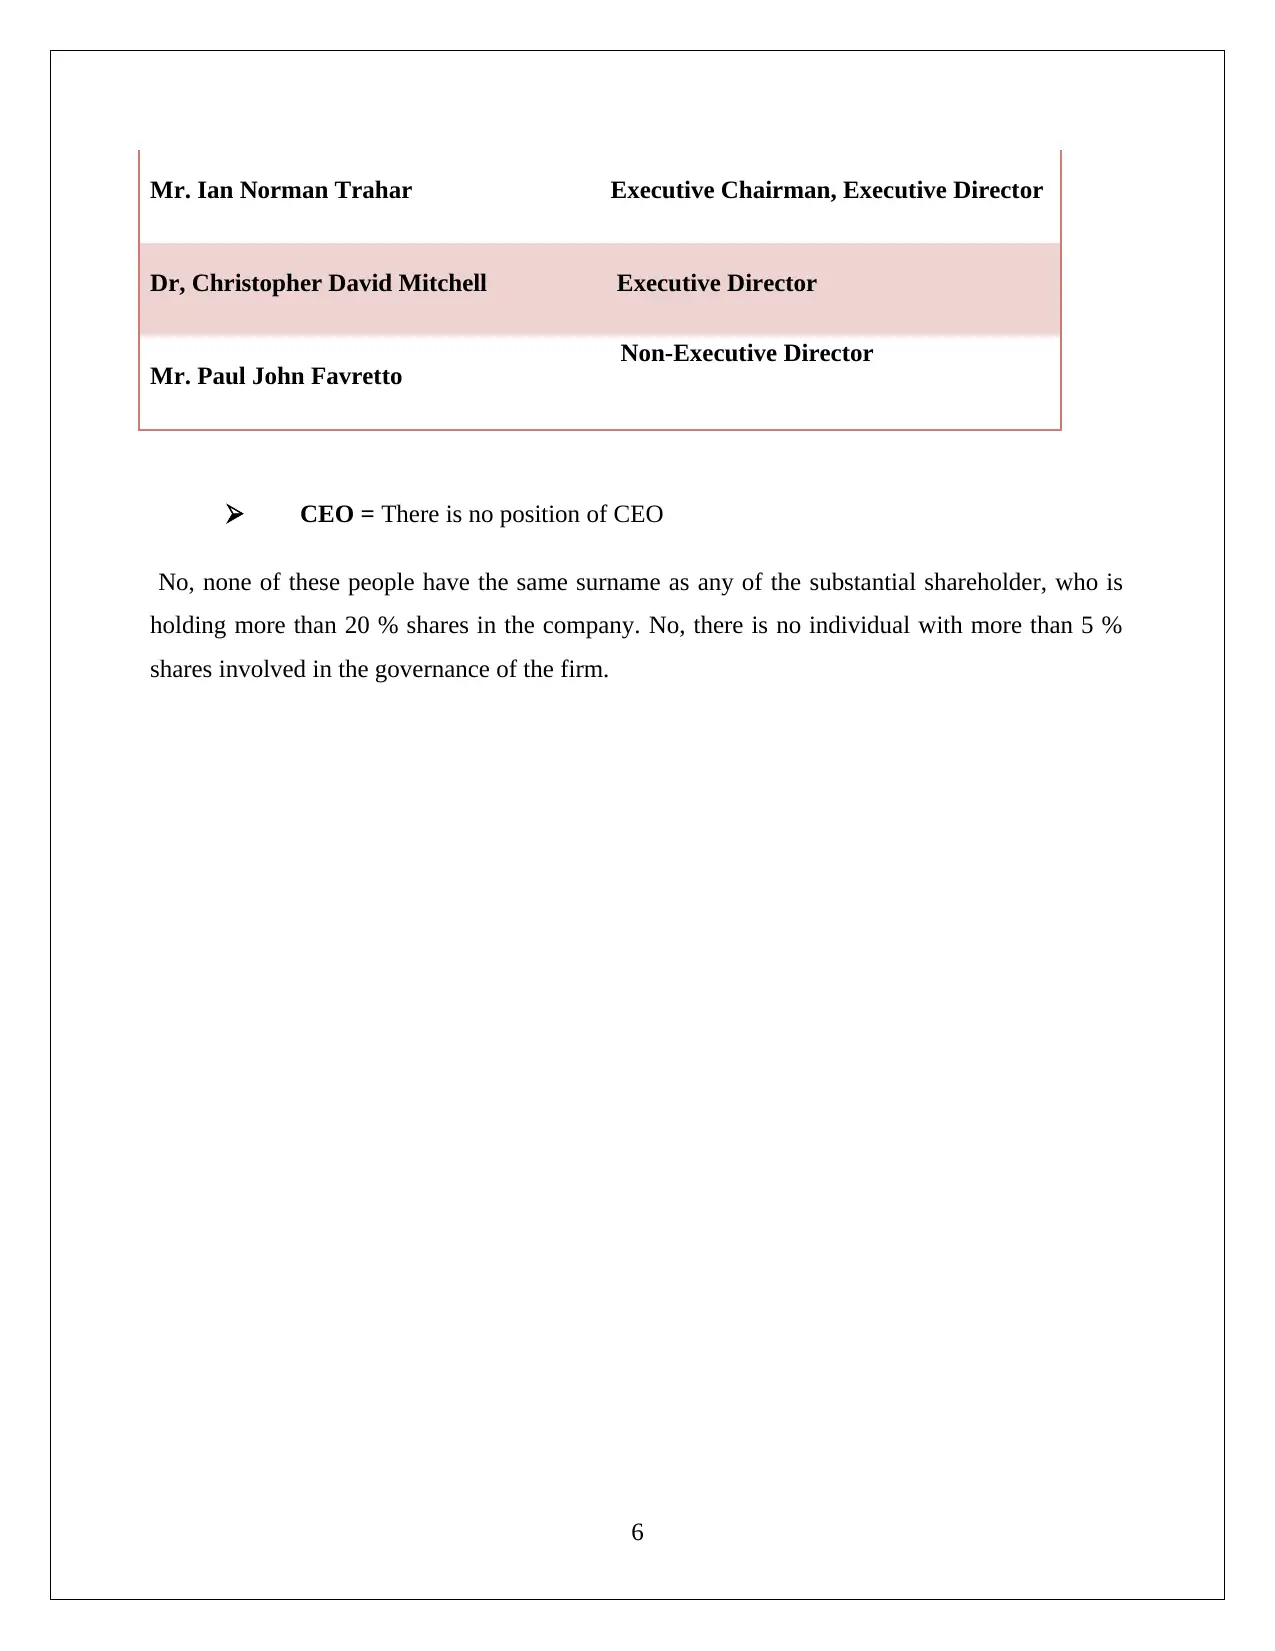
Mr. Ian Norman Trahar Executive Chairman, Executive Director
Dr, Christopher David Mitchell Executive Director
Mr. Paul John Favretto Non-Executive Director
CEO = There is no position of CEO
No, none of these people have the same surname as any of the substantial shareholder, who is
holding more than 20 % shares in the company. No, there is no individual with more than 5 %
shares involved in the governance of the firm.
6
⊘ This is a preview!⊘
Do you want full access?
Subscribe today to unlock all pages.
Trusted by 1+ million students worldwide
3. Calculate the following Fundamental ratios for your selected company for the past 2
years.
The following financial are required to be calculated –
Short-term solvency (Liquidity ratios)
Current ratio – Total Current Assets / Total Current Liabilities
This ratio is calculated by dividing current assets by current liabilities. At a minimum, this ratio
should be greater than one. It is used to find out short-term solvency of the firm that is whether
the firm will be able to pay its current liabilities by selling off its current assets or not. The
current ratio of the company is positive and has increased which is good thing for the investors.
Quick ratio – Total Current Assets – Inventory / Total Current Liabilities
Quick ratio or acid test ratio is calculated by dividing the difference between current assets and
inventory with current liabilities. The ratio is considered to be appropriate if it is one. This ratio
is used to know whether the firm will be able to pay its current liabilities very short span of time
or immediate notice. The Quick ratio is high above the ideal ratio which states that company is
able to repay the short term liability if any.
Long-term solvency (Financial Leverage ratios)
Debt to equity ratio – Total Liabilities / Shareholder’s Equity
Debt to equity ratio is calculated by dividing total liabilities with shareholder’s equity. This is
used to measure a company’s financial leverage. It is used to know how much debt company has
borrowed from outside to finance its assets. It is also called gearing ratio. The company debt
ratio has declined during the year and since the company is earning losses it will help to decrease
the cost involved.
Total Debt to Total assets ratio
Total debt to Total Assets – Short Term Debt + Long Term Debt / Total Assets
7
Paraphrase This Document
Need a fresh take? Get an instant paraphrase of this document with our AI Paraphraser
This ratio is calculated by dividing total debt that is short-term debt and long-term debt of the
firm with its total assets. This ratio is used to know the long-term health of the firm.
Profitability ratios
Return on equity – Net income / Shareholder’s Equity
This ratio is calculated to know the firm’s profit-making capacity when compared with firm’s
equity. This gives the information of the return on shareholders’ equity. The company is not able
to earn profits during the year which is not a satisfactory position and need to be taken care by
the company.
Market value ratios
Earnings per share – (Net income – Preferred share dividends) / number of common shares
outstanding
This ratio shows the earning per share for the equity shareholders of the firm. This ratio helps the
equity shareholder to calculate returns and risk of their investments.
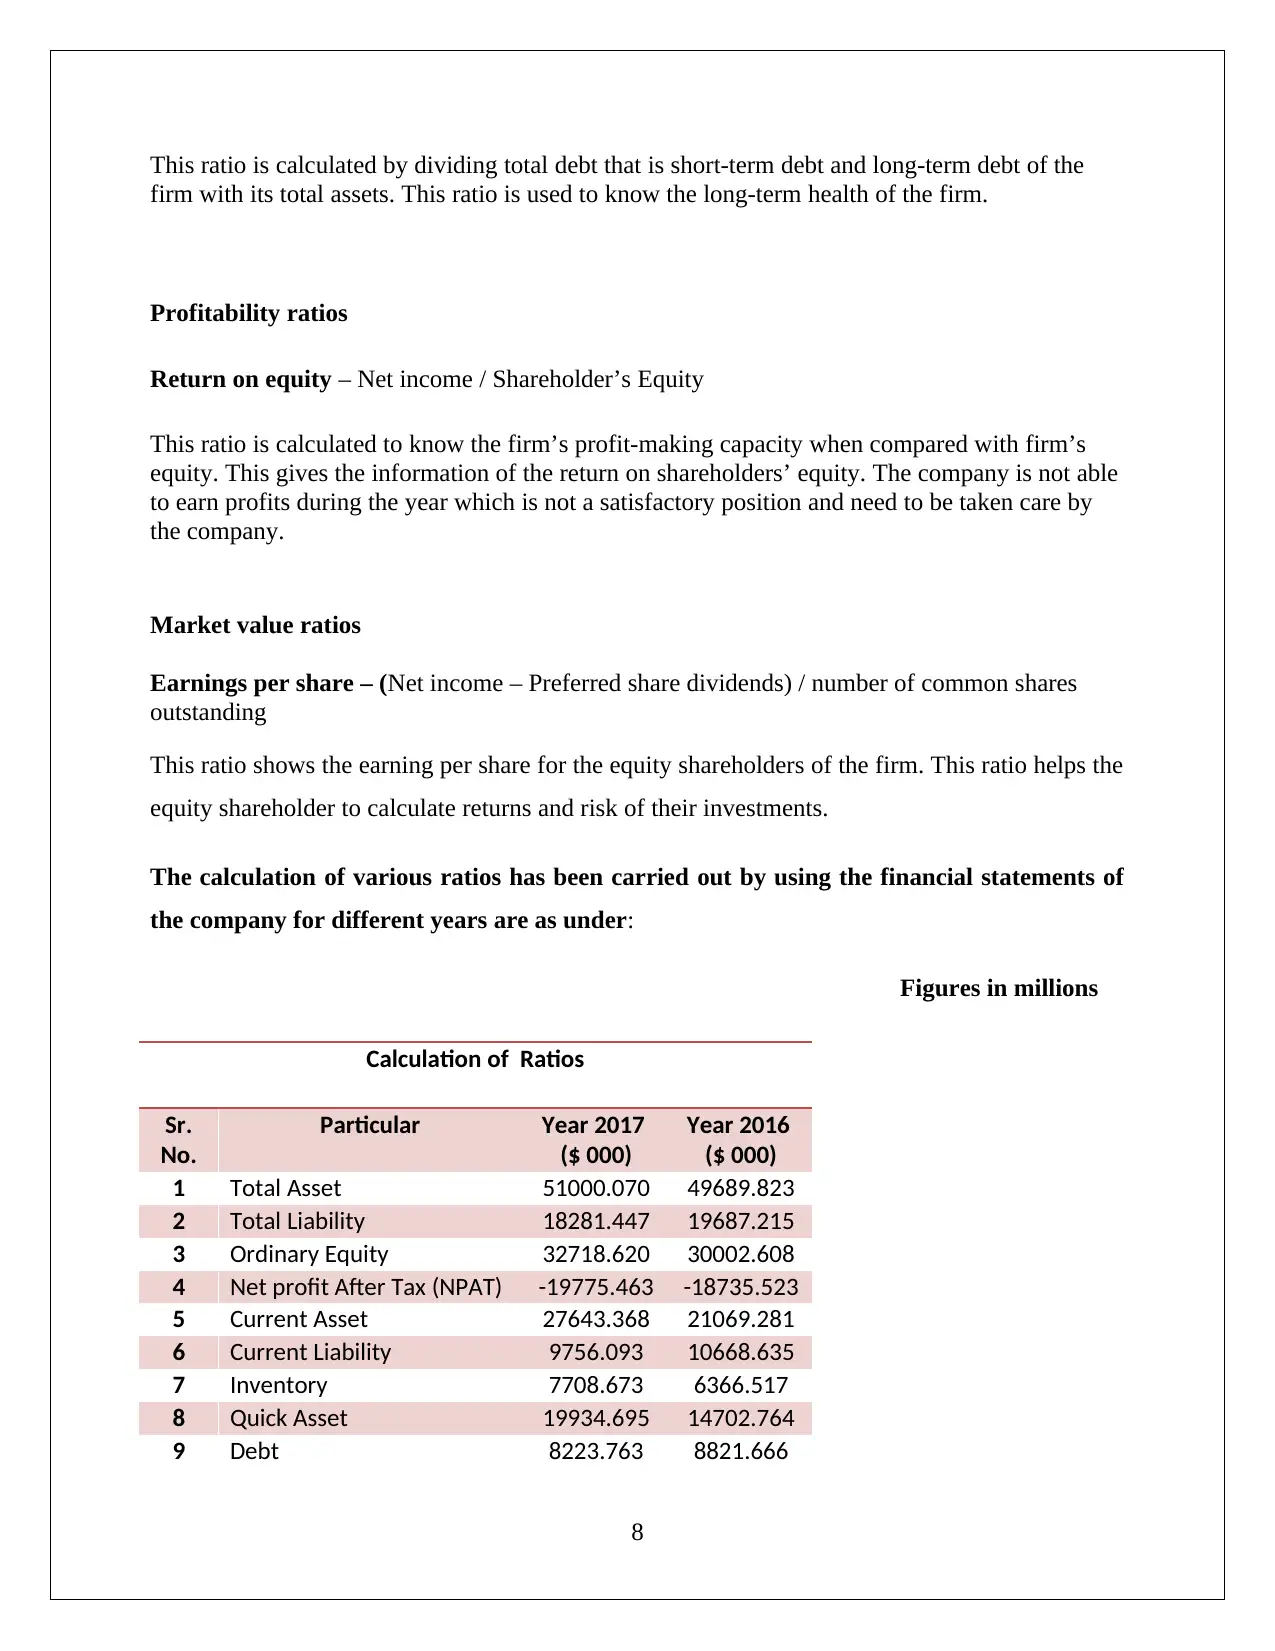
The calculation of various ratios has been carried out by using the financial statements of
the company for different years are as under:
Figures in millions
Calculation of Ratios
Sr.
No.
Particular Year 2017
($ 000)
Year 2016
($ 000)
1 Total Asset 51000.070 49689.823
2 Total Liability 18281.447 19687.215
3 Ordinary Equity 32718.620 30002.608
4 Net profit After Tax (NPAT) -19775.463 -18735.523
5 Current Asset 27643.368 21069.281
6 Current Liability 9756.093 10668.635
7 Inventory 7708.673 6366.517
8 Quick Asset 19934.695 14702.764
9 Debt 8223.763 8821.666
8
firm with its total assets. This ratio is used to know the long-term health of the firm.
Profitability ratios
Return on equity – Net income / Shareholder’s Equity
This ratio is calculated to know the firm’s profit-making capacity when compared with firm’s
equity. This gives the information of the return on shareholders’ equity. The company is not able
to earn profits during the year which is not a satisfactory position and need to be taken care by
the company.
Market value ratios
Earnings per share – (Net income – Preferred share dividends) / number of common shares
outstanding
This ratio shows the earning per share for the equity shareholders of the firm. This ratio helps the
equity shareholder to calculate returns and risk of their investments.
The calculation of various ratios has been carried out by using the financial statements of
the company for different years are as under:
Figures in millions
Calculation of Ratios
Sr.
No.
Particular Year 2017
($ 000)
Year 2016
($ 000)
1 Total Asset 51000.070 49689.823
2 Total Liability 18281.447 19687.215
3 Ordinary Equity 32718.620 30002.608
4 Net profit After Tax (NPAT) -19775.463 -18735.523
5 Current Asset 27643.368 21069.281
6 Current Liability 9756.093 10668.635
7 Inventory 7708.673 6366.517
8 Quick Asset 19934.695 14702.764
9 Debt 8223.763 8821.666
8
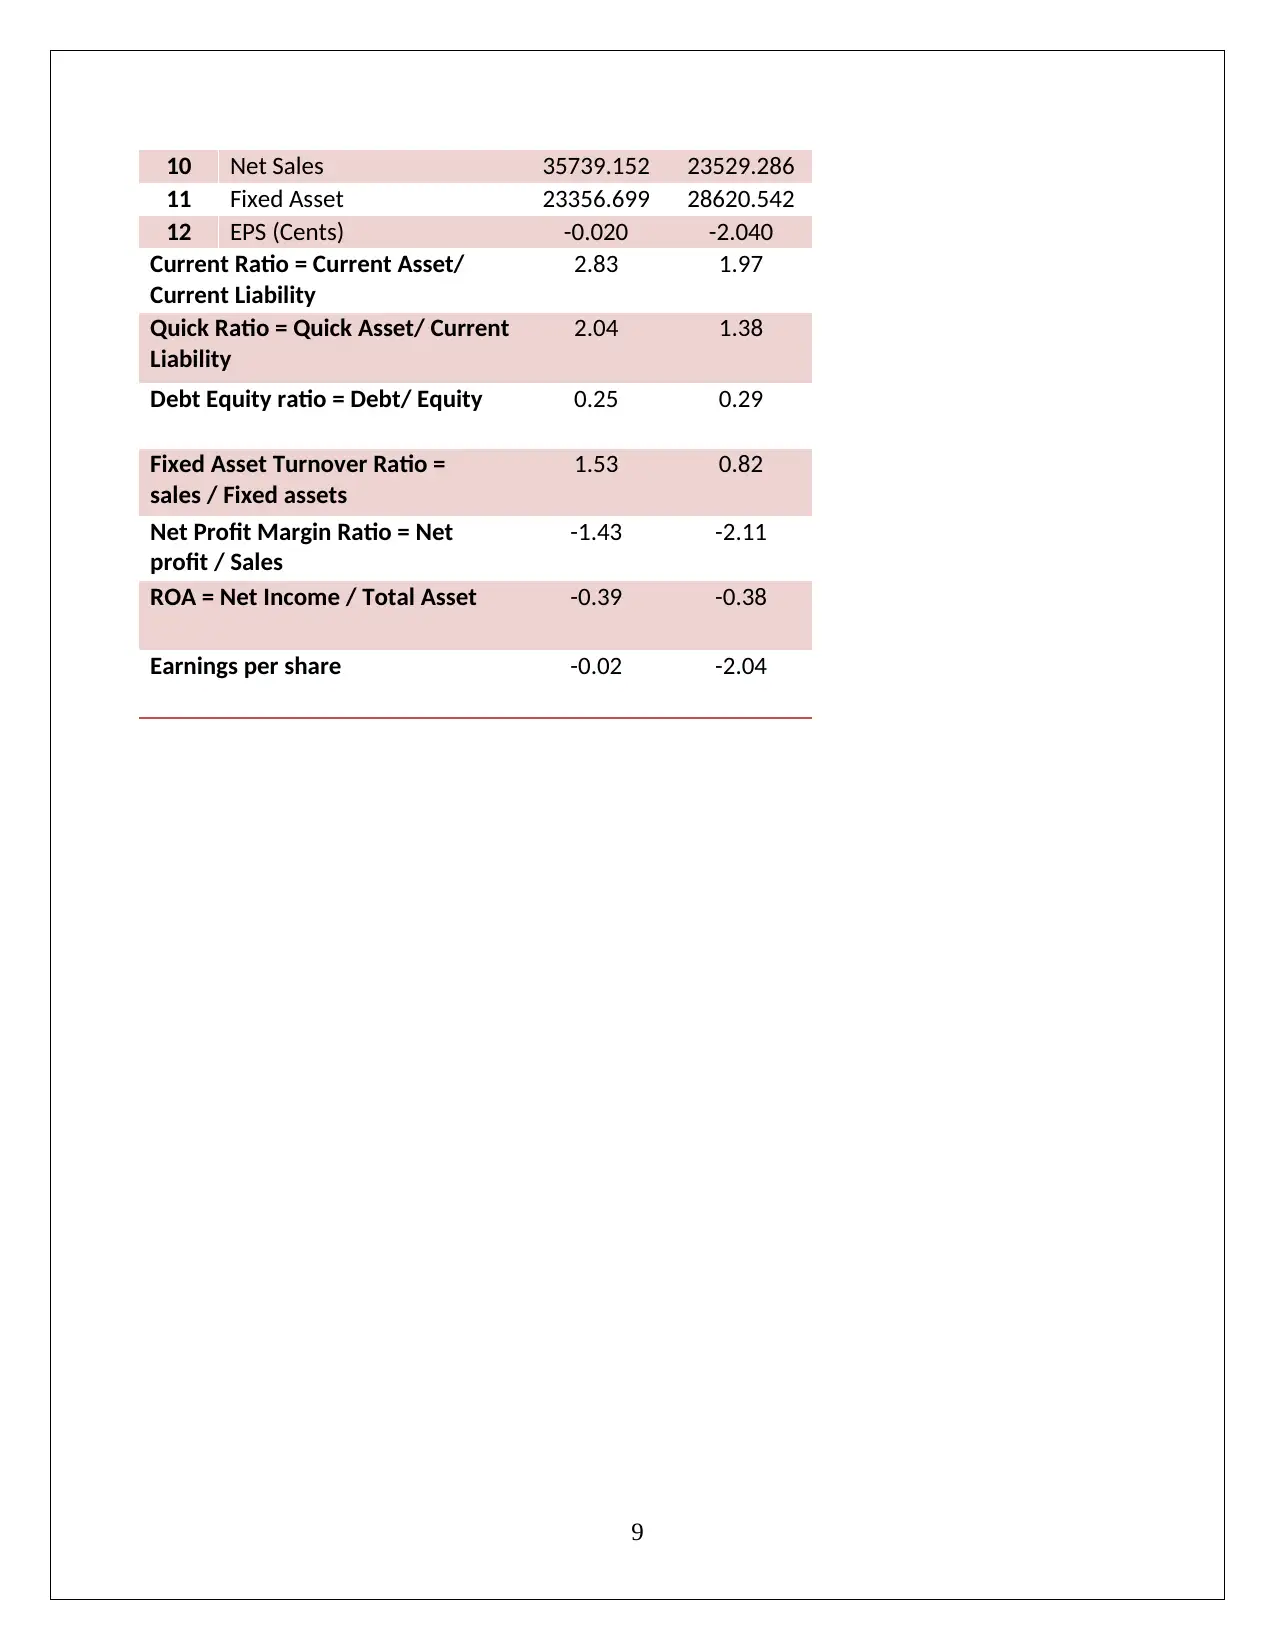
10 Net Sales 35739.152 23529.286
11 Fixed Asset 23356.699 28620.542
12 EPS (Cents) -0.020 -2.040
Current Ratio = Current Asset/
Current Liability
2.83 1.97
Quick Ratio = Quick Asset/ Current
Liability
2.04 1.38
Debt Equity ratio = Debt/ Equity 0.25 0.29
Fixed Asset Turnover Ratio =
sales / Fixed assets
1.53 0.82
Net Profit Margin Ratio = Net
profit / Sales
-1.43 -2.11
ROA = Net Income / Total Asset -0.39 -0.38
Earnings per share -0.02 -2.04
9
⊘ This is a preview!⊘
Do you want full access?
Subscribe today to unlock all pages.
Trusted by 1+ million students worldwide
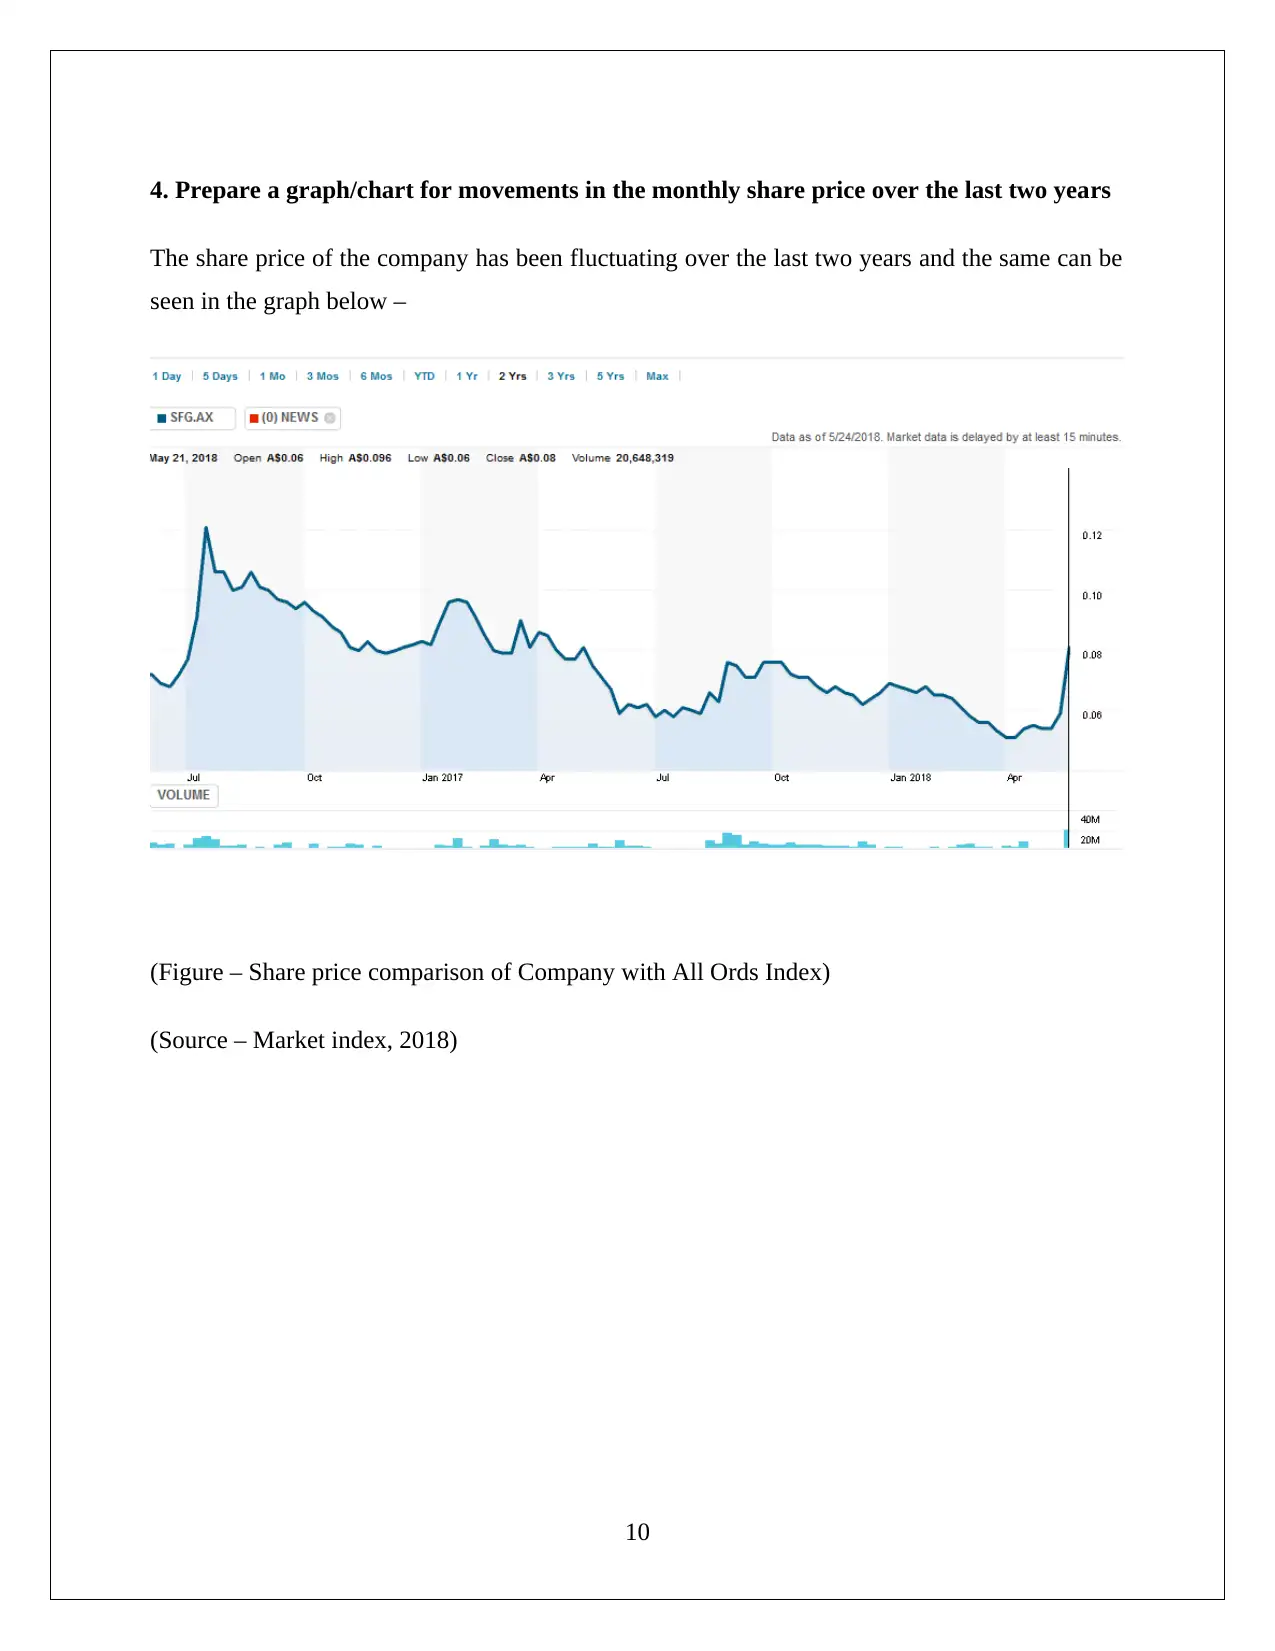
4. Prepare a graph/chart for movements in the monthly share price over the last two years
The share price of the company has been fluctuating over the last two years and the same can be
seen in the graph below –
(Figure – Share price comparison of Company with All Ords Index)
(Source – Market index, 2018)
10
The share price of the company has been fluctuating over the last two years and the same can be
seen in the graph below –
(Figure – Share price comparison of Company with All Ords Index)
(Source – Market index, 2018)
10
Paraphrase This Document
Need a fresh take? Get an instant paraphrase of this document with our AI Paraphraser
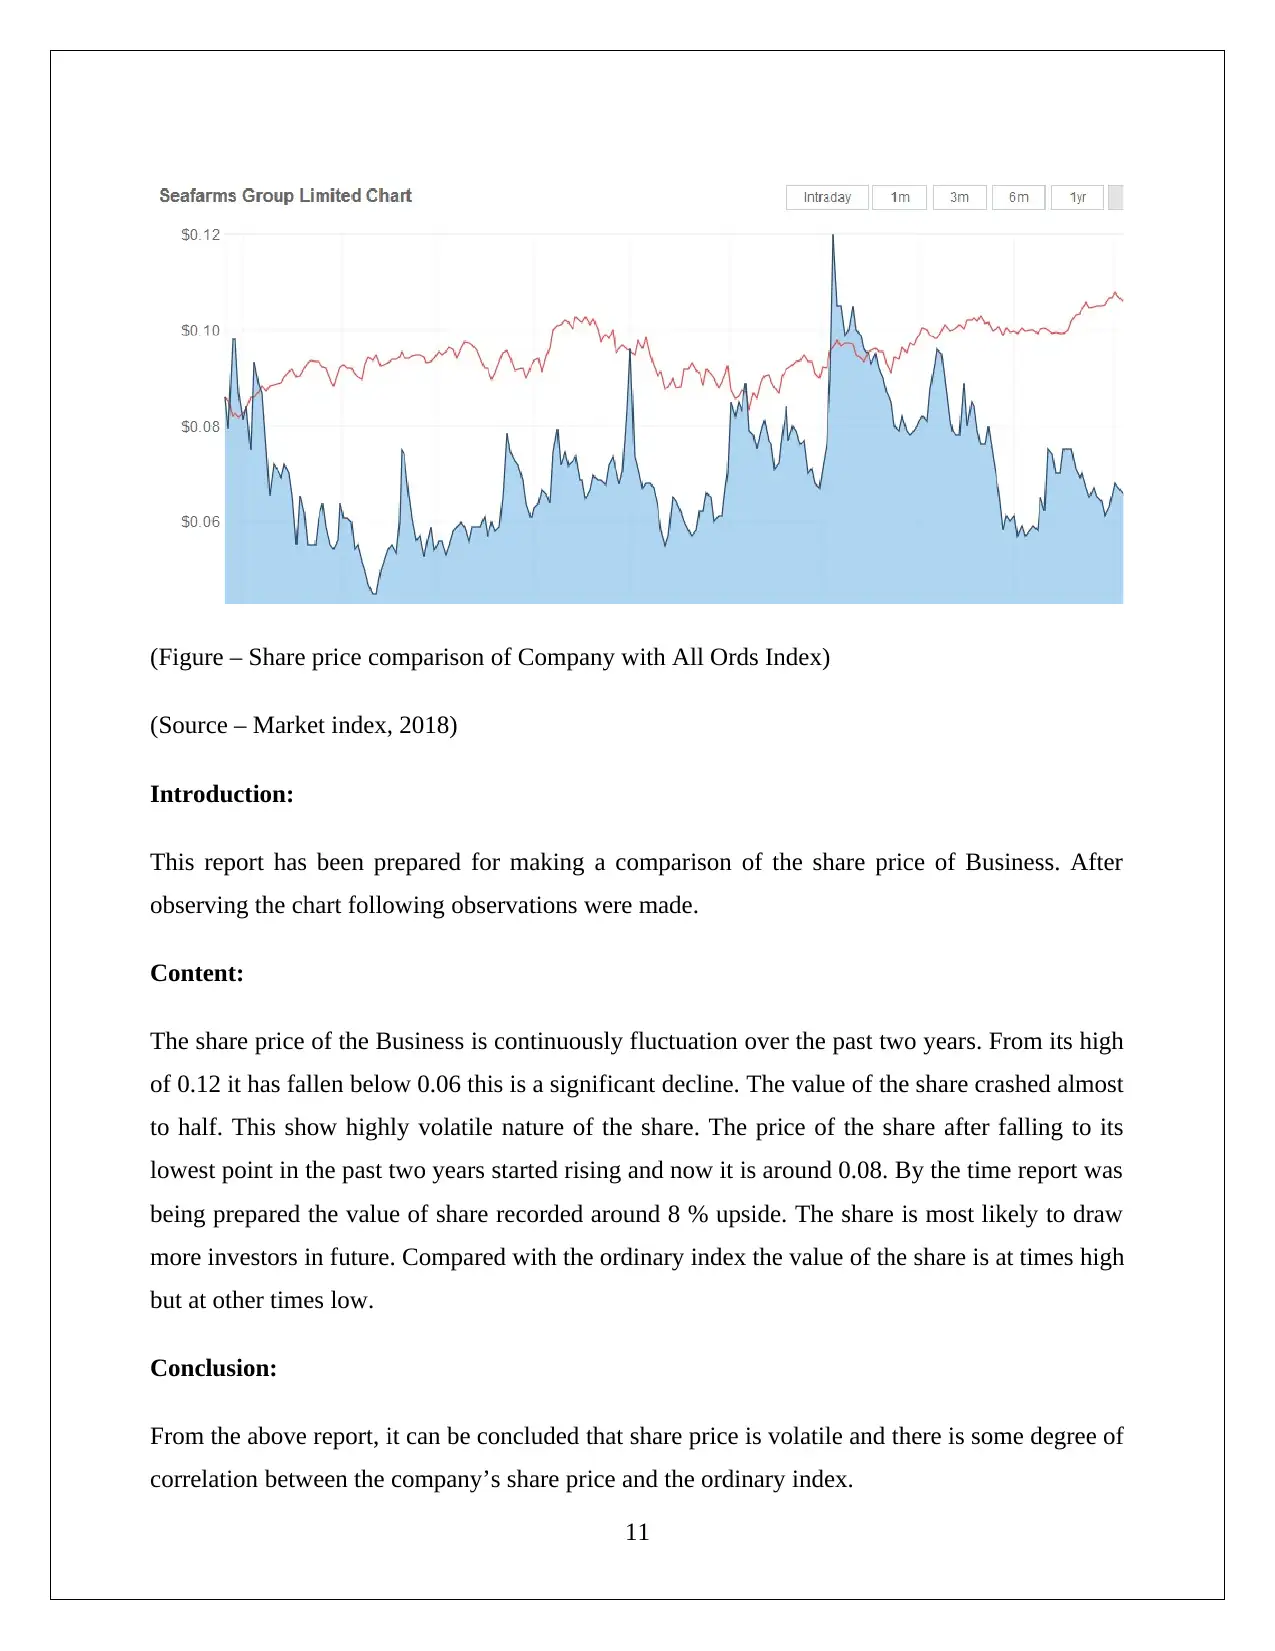
(Figure – Share price comparison of Company with All Ords Index)
(Source – Market index, 2018)
Introduction:
This report has been prepared for making a comparison of the share price of Business. After
observing the chart following observations were made.
Content:
The share price of the Business is continuously fluctuation over the past two years. From its high
of 0.12 it has fallen below 0.06 this is a significant decline. The value of the share crashed almost
to half. This show highly volatile nature of the share. The price of the share after falling to its
lowest point in the past two years started rising and now it is around 0.08. By the time report was
being prepared the value of share recorded around 8 % upside. The share is most likely to draw
more investors in future. Compared with the ordinary index the value of the share is at times high
but at other times low.
Conclusion:
From the above report, it can be concluded that share price is volatile and there is some degree of
correlation between the company’s share price and the ordinary index.
11
5. Significant announcements which may have influenced the share price of your company.
Announcements related to the company can have a significant impact on the profitability of the
company. The effect depends on the nature of the investments. There are a number of internal
and external factors that can either prove profitable or disastrous, thus effectively analyzing the
announcements is the key to making a profitable investment.
The announcements made with respect to Business are that have affected its share price –
On 23rd of May 2018, there was an announcement that the Japanese seafood giant, Nissui,
will invest in the project sea dragon of the company. This investment was A$24.99
million equity investment with some other agreements (George, 2018). This investment
will help the firm to expand its project and to carry it out with higher efficiency. This will
raise the investor hopes and they will invest n the shares and the shares prices of the
company will rise.
On 23rd of May 2018, there was an announcement regarding a change in the interest of
the directors of the company. This was the conversion of performance rights to fully paid
shares. This change will expand the equity of the firm (Investsmart, 2018). This
expansion of share capital will encourage other investors to invest in the firm and share
price will rise.
On 11th December 2017, there was an announcement that the agriculture license has been
granted for project sea dragon Core Breeding Centre and Bloodstock Maturation Centre.
This license will expand the company’s business operations and help them to undertake
an operation in the field (Investsmart, 2018). This will motivate other investors to invest
in the form and more shares will be purchased and the shares price will rise.
On 6th of November 2017, the company announced that a non – pastoral use permit has
been issued to the company. This permit will help the company to expand its operation
12
⊘ This is a preview!⊘
Do you want full access?
Subscribe today to unlock all pages.
Trusted by 1+ million students worldwide
1 out of 22
Related Documents


Your All-in-One AI-Powered Toolkit for Academic Success.
+13062052269
info@desklib.com
Available 24*7 on WhatsApp / Email
![[object Object]](/_next/static/media/star-bottom.7253800d.svg)
Unlock your academic potential
Copyright © 2020–2026 A2Z Services. All Rights Reserved. Developed and managed by ZUCOL.