Business Finance Report: Capital Budgeting and Investment Analysis
VerifiedAdded on 2020/12/18
|11
|2888
|130
Report
AI Summary
This report delves into core concepts in business finance, addressing critical questions related to capital asset pricing model (CAPM), efficient capital markets, dividend valuation, and net present value (NPV). It explains how CAPM is used to assess investment risk and return, the significance of efficient capital markets for financial managers, and the assumptions underlying the dividend valuation model. Furthermore, the report elucidates NPV as a capital budgeting tool, demonstrating its application in project evaluation. The report also includes practical applications, such as evaluating investment in securities and calculating the weighted average cost of capital (WACC). The analysis includes calculations for WACC and NPV, providing a comprehensive understanding of financial decision-making processes. This report is a valuable resource for finance students seeking to understand key financial concepts and their practical implications.

Business Finance
Paraphrase This Document
Need a fresh take? Get an instant paraphrase of this document with our AI Paraphraser
Table of Contents
INTRODUCTION...........................................................................................................................1
CLIENTS FINANCIAL QUESTIONS...........................................................................................1
1.Capital asset pricing method and how it is used for evaluating whether the expected return
on asset is sufficient to compensate the investor for the risk it takes..........................................1
2. What is efficient capital market and why it is necessary for financial managers?..................2
3. Identifying the assumptions for dividend valuation model......................................................3
4.Explaining Net Present Value as a capital budgetary tool and how it is used for the
evaluation of the investment........................................................................................................3
CLIENTS INVESTMENTS............................................................................................................4
1. Evaluating the information whether to invest in securities or not...........................................4
2. Weighted average cost of capital for the company (WACC)..................................................4
3. Calculation of Net present value of two projects.....................................................................6
CONCLUSION ...............................................................................................................................6
REFERENCES................................................................................................................................8
INTRODUCTION
Business finance can be described as such business activities which are concerned with
the procurement and conservation of capital funds for the purpose of meeting financial
requirements and overall goals and objectives of a business enterprise (Al-Mutairi, Naser and
Saeid, 2018). The present project report will cover the capital asset pricing model (CAPM) that
how it is used for evaluating whether the expected return on an asset is adequate to mitigate the
inherent risk. It will higher what is an efficient capital market and why it is necessary for
financial mangers. Further, it will show what is NPV along with calculations and dividend
valuation model.
CLIENTS FINANCIAL QUESTIONS
1.Capital asset pricing method and how it is used for evaluating whether the expected return on
asset is sufficient to compensate the investor for the risk it takes
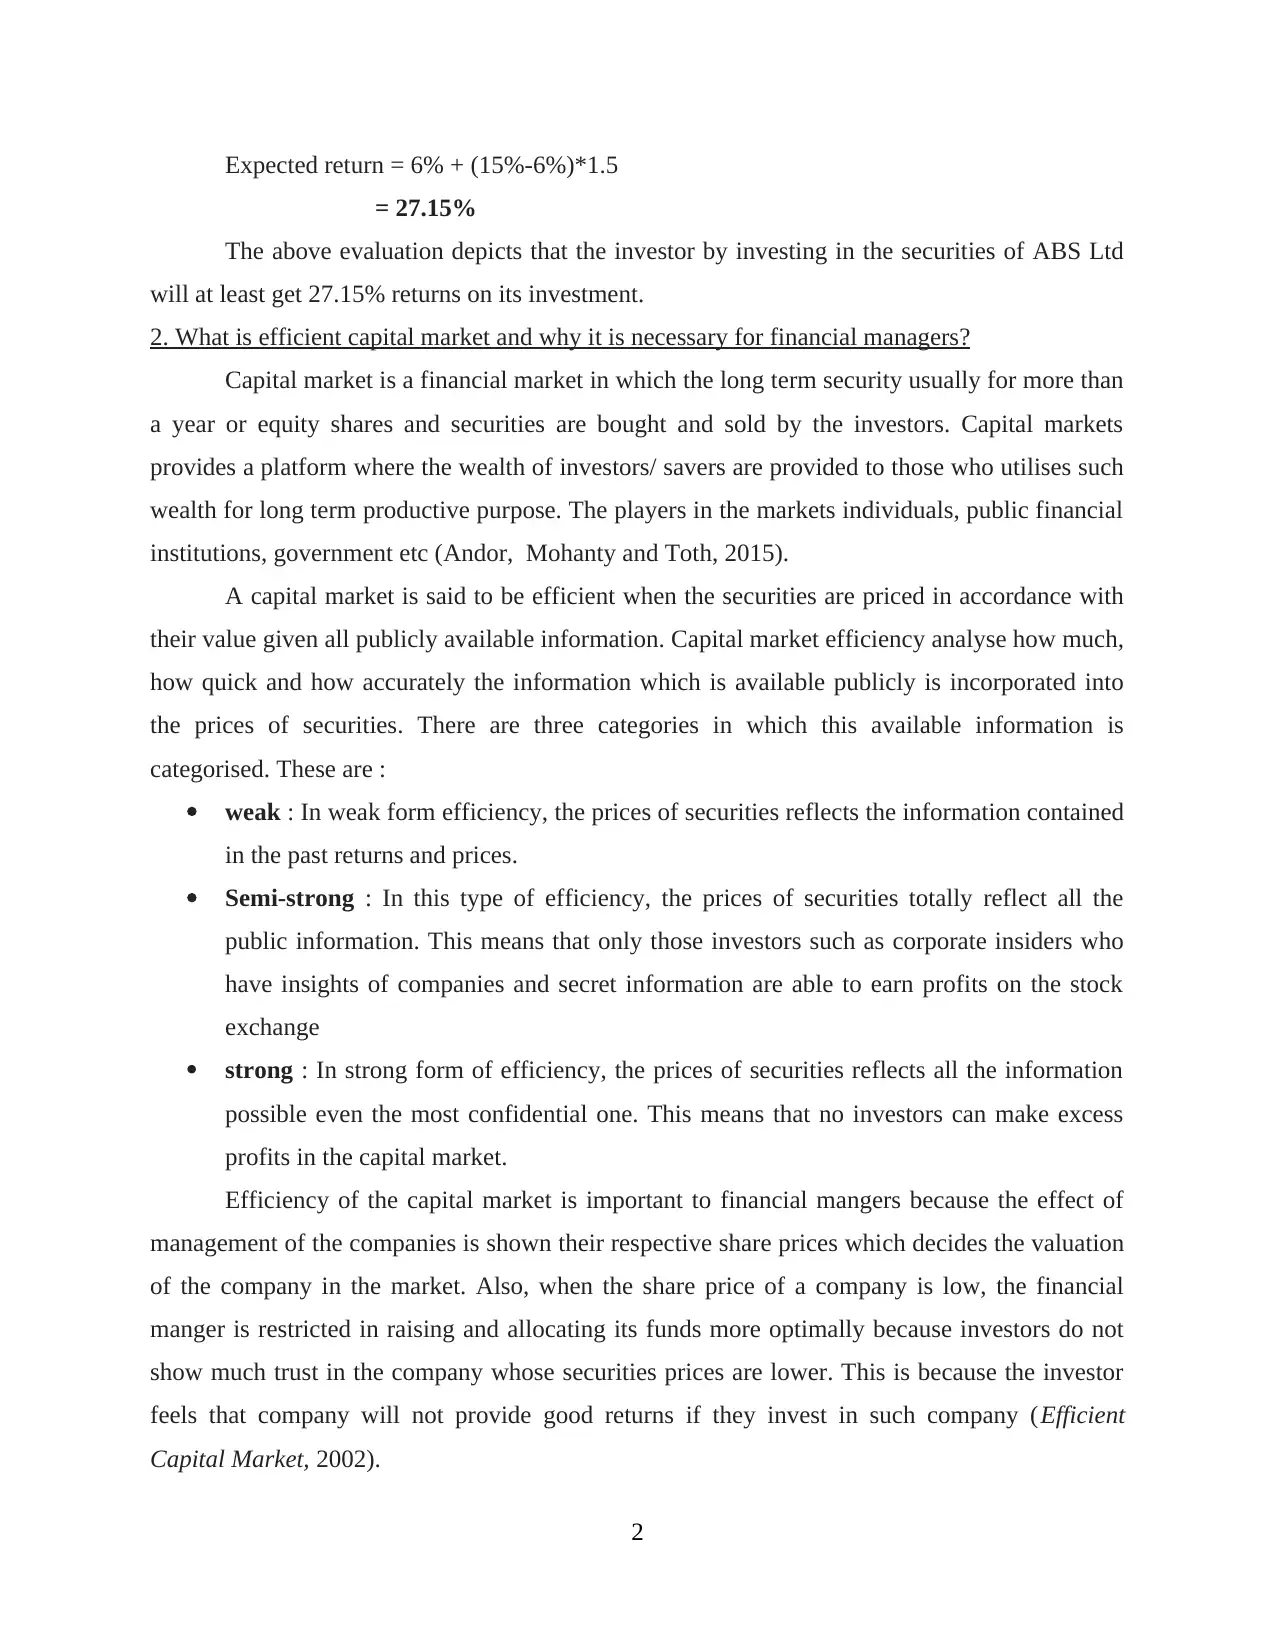
In simple words, capital asset pricing method (CAPM) demonstrates the relationship
between the systematic risk and the expected return for assets, especially stocks and shares. The
CAPM model is used very commonly for pricing the securities that are characterised by high
risk. It was found by Harry Markowitz in 1952. As per the theory of CAPM, the expected return
of specific security or stocks/portfolio is equal to the rate of risk free security plus a risk
premium. If the security does not match with the expected return, then the investor is advised to
not to make the investment in those securities (Capital Asset Pricing Model (CAPM), 2019).
Formula of CAPM :
Expected return = Risk free rate + (Market return – Risk free rate)* Beta
The model takes into consideration the responsiveness or sensitivity of assets to the non
diversified risk or systematic risk or market risk which is commonly represented by the symbol
beta (β).
The theory of the model could be understood by taking an example. Lets assume the
current risk free rate is 6 % and the Australia stock exchange 200 is expected to yield 15% over
the next year. Now there is a company called ABC Ltd whose evaluation is required in terms of
its securities for the purpose of investment. It has ascertained that company's beta (systematic
risk) is 1.5 and the overall market has a beta which is 1. This shows that company has higher risk
as compared to market which in turn shows that securities of this company will provide more
return as compared to the overall market return which is 15%.
1
Business finance can be described as such business activities which are concerned with
the procurement and conservation of capital funds for the purpose of meeting financial
requirements and overall goals and objectives of a business enterprise (Al-Mutairi, Naser and
Saeid, 2018). The present project report will cover the capital asset pricing model (CAPM) that
how it is used for evaluating whether the expected return on an asset is adequate to mitigate the
inherent risk. It will higher what is an efficient capital market and why it is necessary for
financial mangers. Further, it will show what is NPV along with calculations and dividend
valuation model.
CLIENTS FINANCIAL QUESTIONS
1.Capital asset pricing method and how it is used for evaluating whether the expected return on
asset is sufficient to compensate the investor for the risk it takes
In simple words, capital asset pricing method (CAPM) demonstrates the relationship
between the systematic risk and the expected return for assets, especially stocks and shares. The
CAPM model is used very commonly for pricing the securities that are characterised by high
risk. It was found by Harry Markowitz in 1952. As per the theory of CAPM, the expected return
of specific security or stocks/portfolio is equal to the rate of risk free security plus a risk
premium. If the security does not match with the expected return, then the investor is advised to
not to make the investment in those securities (Capital Asset Pricing Model (CAPM), 2019).
Formula of CAPM :
Expected return = Risk free rate + (Market return – Risk free rate)* Beta
The model takes into consideration the responsiveness or sensitivity of assets to the non
diversified risk or systematic risk or market risk which is commonly represented by the symbol
beta (β).
The theory of the model could be understood by taking an example. Lets assume the
current risk free rate is 6 % and the Australia stock exchange 200 is expected to yield 15% over
the next year. Now there is a company called ABC Ltd whose evaluation is required in terms of
its securities for the purpose of investment. It has ascertained that company's beta (systematic
risk) is 1.5 and the overall market has a beta which is 1. This shows that company has higher risk
as compared to market which in turn shows that securities of this company will provide more
return as compared to the overall market return which is 15%.
1
⊘ This is a preview!⊘
Do you want full access?
Subscribe today to unlock all pages.
Trusted by 1+ million students worldwide
Expected return = 6% + (15%-6%)*1.5
= 27.15%
The above evaluation depicts that the investor by investing in the securities of ABS Ltd
will at least get 27.15% returns on its investment.
2. What is efficient capital market and why it is necessary for financial managers?
Capital market is a financial market in which the long term security usually for more than
a year or equity shares and securities are bought and sold by the investors. Capital markets
provides a platform where the wealth of investors/ savers are provided to those who utilises such
wealth for long term productive purpose. The players in the markets individuals, public financial
institutions, government etc (Andor, Mohanty and Toth, 2015).
A capital market is said to be efficient when the securities are priced in accordance with
their value given all publicly available information. Capital market efficiency analyse how much,
how quick and how accurately the information which is available publicly is incorporated into
the prices of securities. There are three categories in which this available information is
categorised. These are :
weak : In weak form efficiency, the prices of securities reflects the information contained
in the past returns and prices.
Semi-strong : In this type of efficiency, the prices of securities totally reflect all the
public information. This means that only those investors such as corporate insiders who
have insights of companies and secret information are able to earn profits on the stock
exchange
strong : In strong form of efficiency, the prices of securities reflects all the information
possible even the most confidential one. This means that no investors can make excess
profits in the capital market.
Efficiency of the capital market is important to financial mangers because the effect of
management of the companies is shown their respective share prices which decides the valuation
of the company in the market. Also, when the share price of a company is low, the financial
manger is restricted in raising and allocating its funds more optimally because investors do not
show much trust in the company whose securities prices are lower. This is because the investor
feels that company will not provide good returns if they invest in such company (Efficient
Capital Market, 2002).
2
Paraphrase This Document
Need a fresh take? Get an instant paraphrase of this document with our AI Paraphraser
3. Identifying the assumptions for dividend valuation model
Dividend valuation policy is a quantifiable method of forecasting the price of company's
stock which is based on the theory that stock's current price is worth the sum of all of its
upcoming dividend payments when these payments are discounted back to their present value.
The objective of dividend valuation model is to calculate the fair value of stock of the company
which is irrespective of the conditions prevailing in the market. It takes into account dividend
payout factors and expected returns of overall market (Abor, 2017).
Value of stock = Expected dividend per share/(cost of equity – dividend growth rate)
If the value of the stock ascertained by using DDM model is greater than the current price
trading on the stock exchange, then the stock of a particular company said to be undervalued and
is advisable to the investor to buy the shares of undervalued company and vice versa.
Assumptions of the Dividend valuation model:
Consistent dividend payout
model is based on assumption that it applies only to those companies that pay regular
dividends
it does not consider the current market conditions
rate of equity is calculated by using CAPM
Assumption regarding estimating future dividends of company (Ang, 2018)
4.Explaining Net Present Value as a capital budgetary tool and how it is used for the evaluation
of the investment
Net present value can be referred to as the difference between the present value of cash
flows from an investment and the cost of acquiring investment. In capital budgeting, NPV
method is used for evaluating and analysing the profitability of a project or capital investment.
NPV = Discounted value of cash flows – cost of investment
It is used for evaluating whether a project should be taken up or not. It helps company in
by telling it whether taking up of a particular project or investment will add an value to company
or not (Smit and Trigeorgis,2017). If the NPV of a project or investment is positive, it indicates
that project should be accepted by the person as it will add value to its wealth whereas if the
NPV is negative, it indicates that investment should not be accepted by the person as it will not
add value to the wealth of the person instead it will bring losses for the person in the future.
3
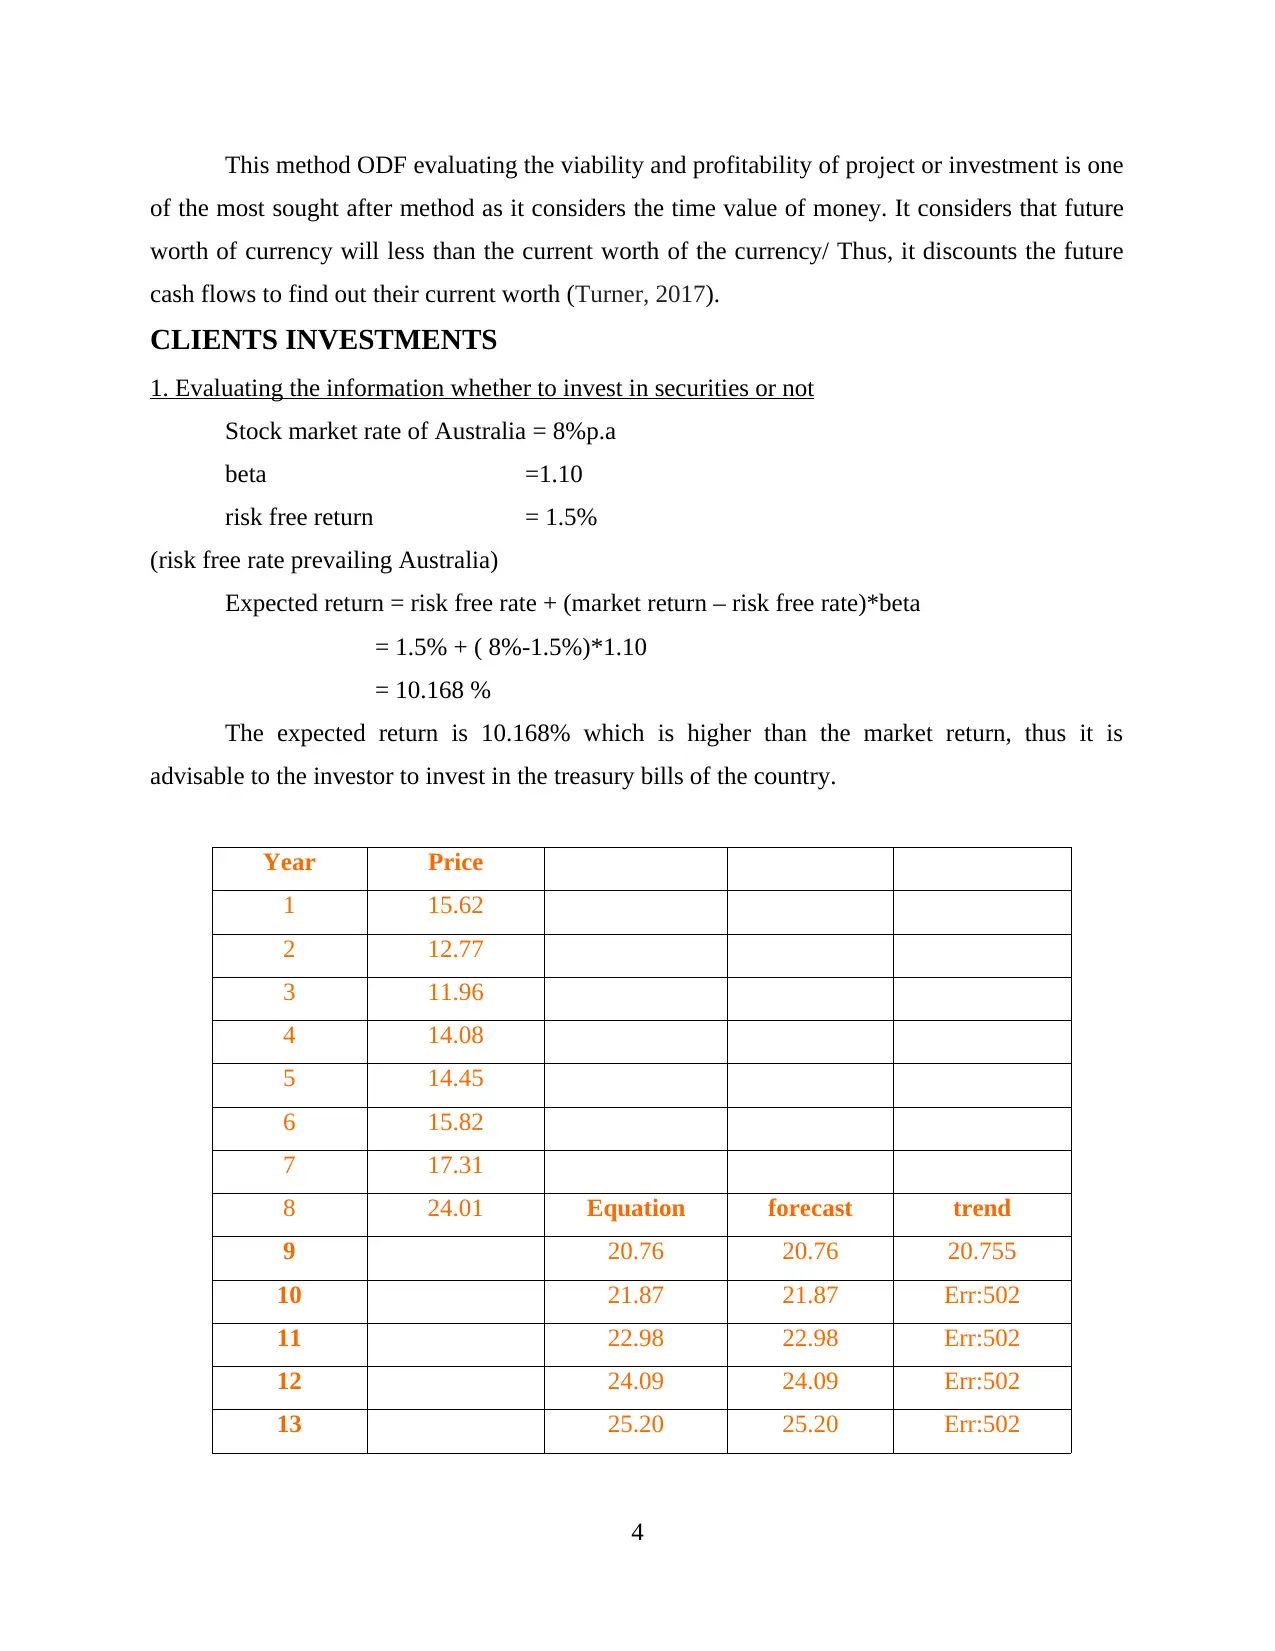
This method ODF evaluating the viability and profitability of project or investment is one
of the most sought after method as it considers the time value of money. It considers that future
worth of currency will less than the current worth of the currency/ Thus, it discounts the future
cash flows to find out their current worth (Turner, 2017).
CLIENTS INVESTMENTS
1. Evaluating the information whether to invest in securities or not
Stock market rate of Australia = 8%p.a
beta =1.10
risk free return = 1.5%
(risk free rate prevailing Australia)
Expected return = risk free rate + (market return – risk free rate)*beta
= 1.5% + ( 8%-1.5%)*1.10
= 10.168 %
The expected return is 10.168% which is higher than the market return, thus it is
advisable to the investor to invest in the treasury bills of the country.
Year Price
1 15.62
2 12.77
3 11.96
4 14.08
5 14.45
6 15.82
7 17.31
8 24.01 Equation forecast trend
9 20.76 20.76 20.755
10 21.87 21.87 Err:502
11 22.98 22.98 Err:502
12 24.09 24.09 Err:502
13 25.20 25.20 Err:502
4
⊘ This is a preview!⊘
Do you want full access?
Subscribe today to unlock all pages.
Trusted by 1+ million students worldwide
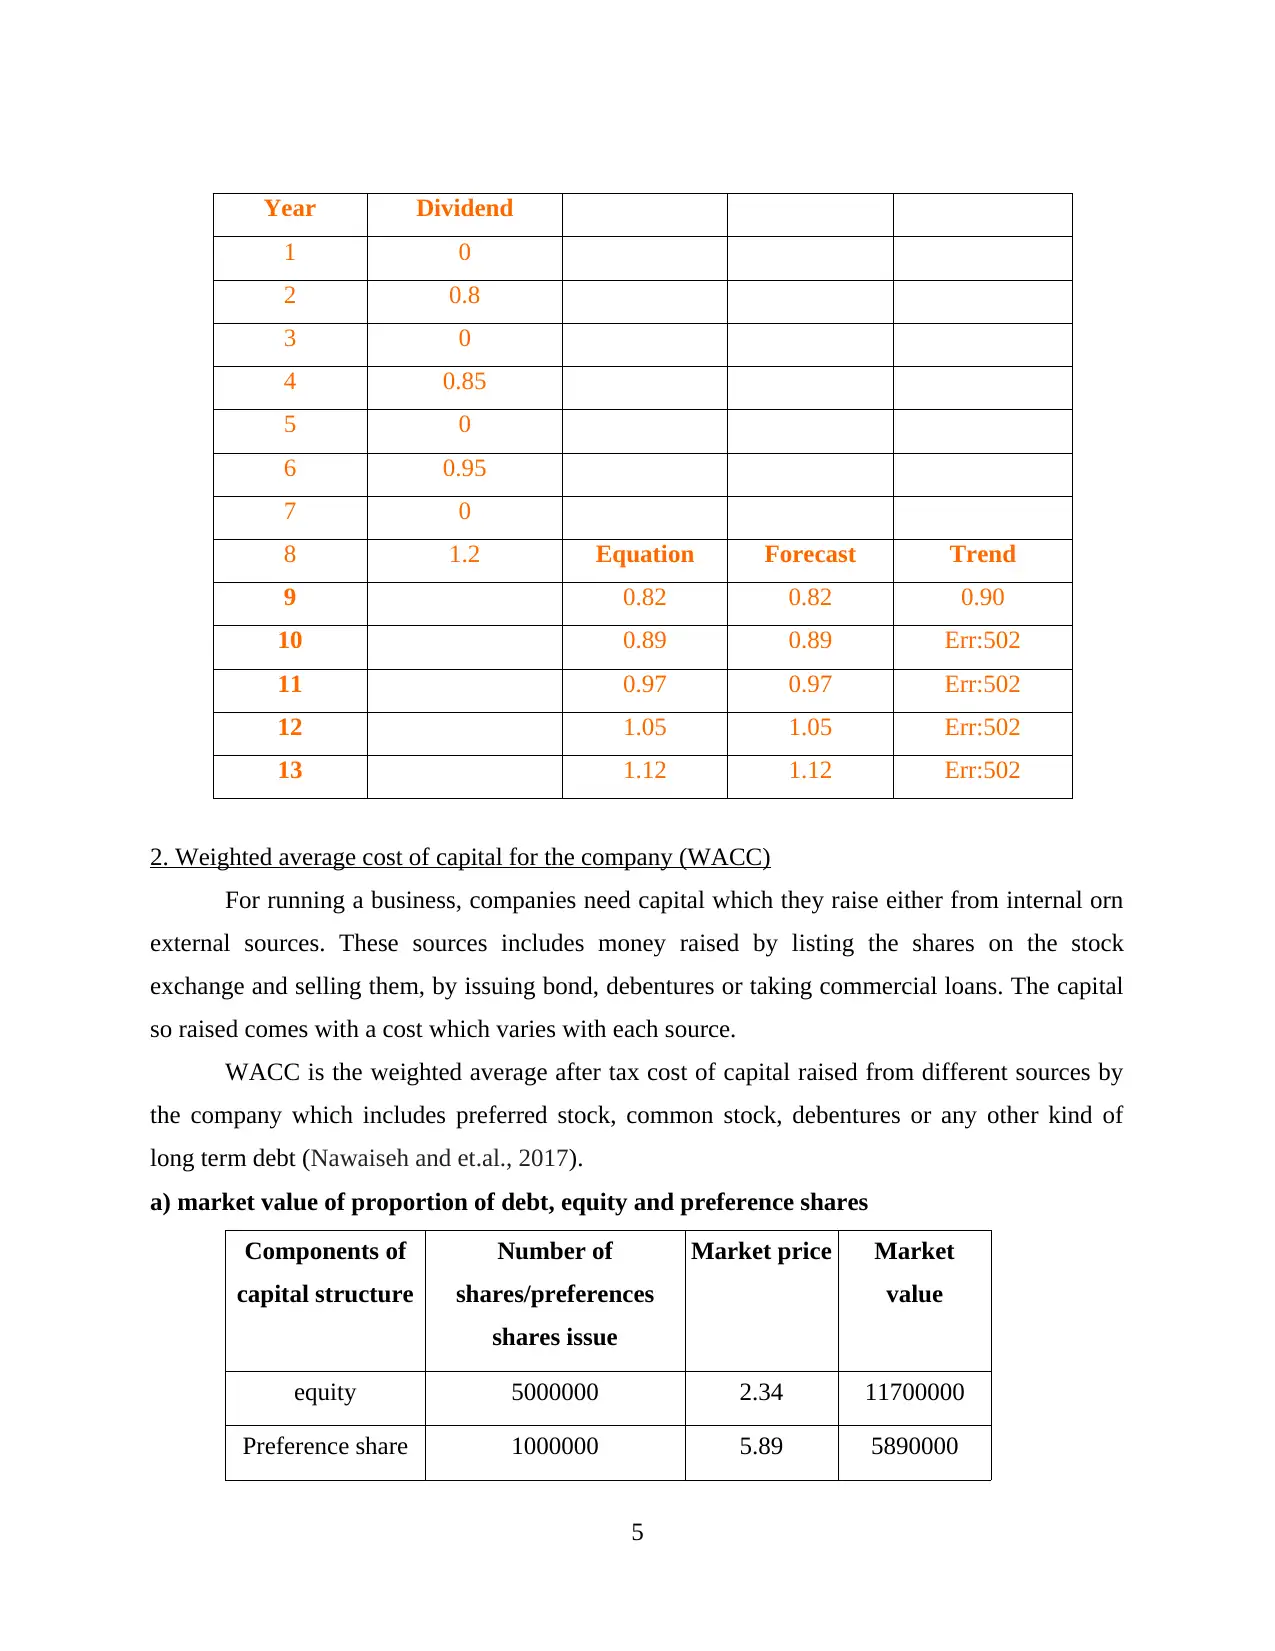
Year Dividend
1 0
2 0.8
3 0
4 0.85
5 0
6 0.95
7 0
8 1.2 Equation Forecast Trend
9 0.82 0.82 0.90
10 0.89 0.89 Err:502
11 0.97 0.97 Err:502
12 1.05 1.05 Err:502
13 1.12 1.12 Err:502
2. Weighted average cost of capital for the company (WACC)
For running a business, companies need capital which they raise either from internal orn
external sources. These sources includes money raised by listing the shares on the stock
exchange and selling them, by issuing bond, debentures or taking commercial loans. The capital
so raised comes with a cost which varies with each source.
WACC is the weighted average after tax cost of capital raised from different sources by
the company which includes preferred stock, common stock, debentures or any other kind of
long term debt (Nawaiseh and et.al., 2017).
a) market value of proportion of debt, equity and preference shares
Components of
capital structure
Number of
shares/preferences
shares issue
Market price Market
value
equity 5000000 2.34 11700000
Preference share 1000000 5.89 5890000
5
Paraphrase This Document
Need a fresh take? Get an instant paraphrase of this document with our AI Paraphraser
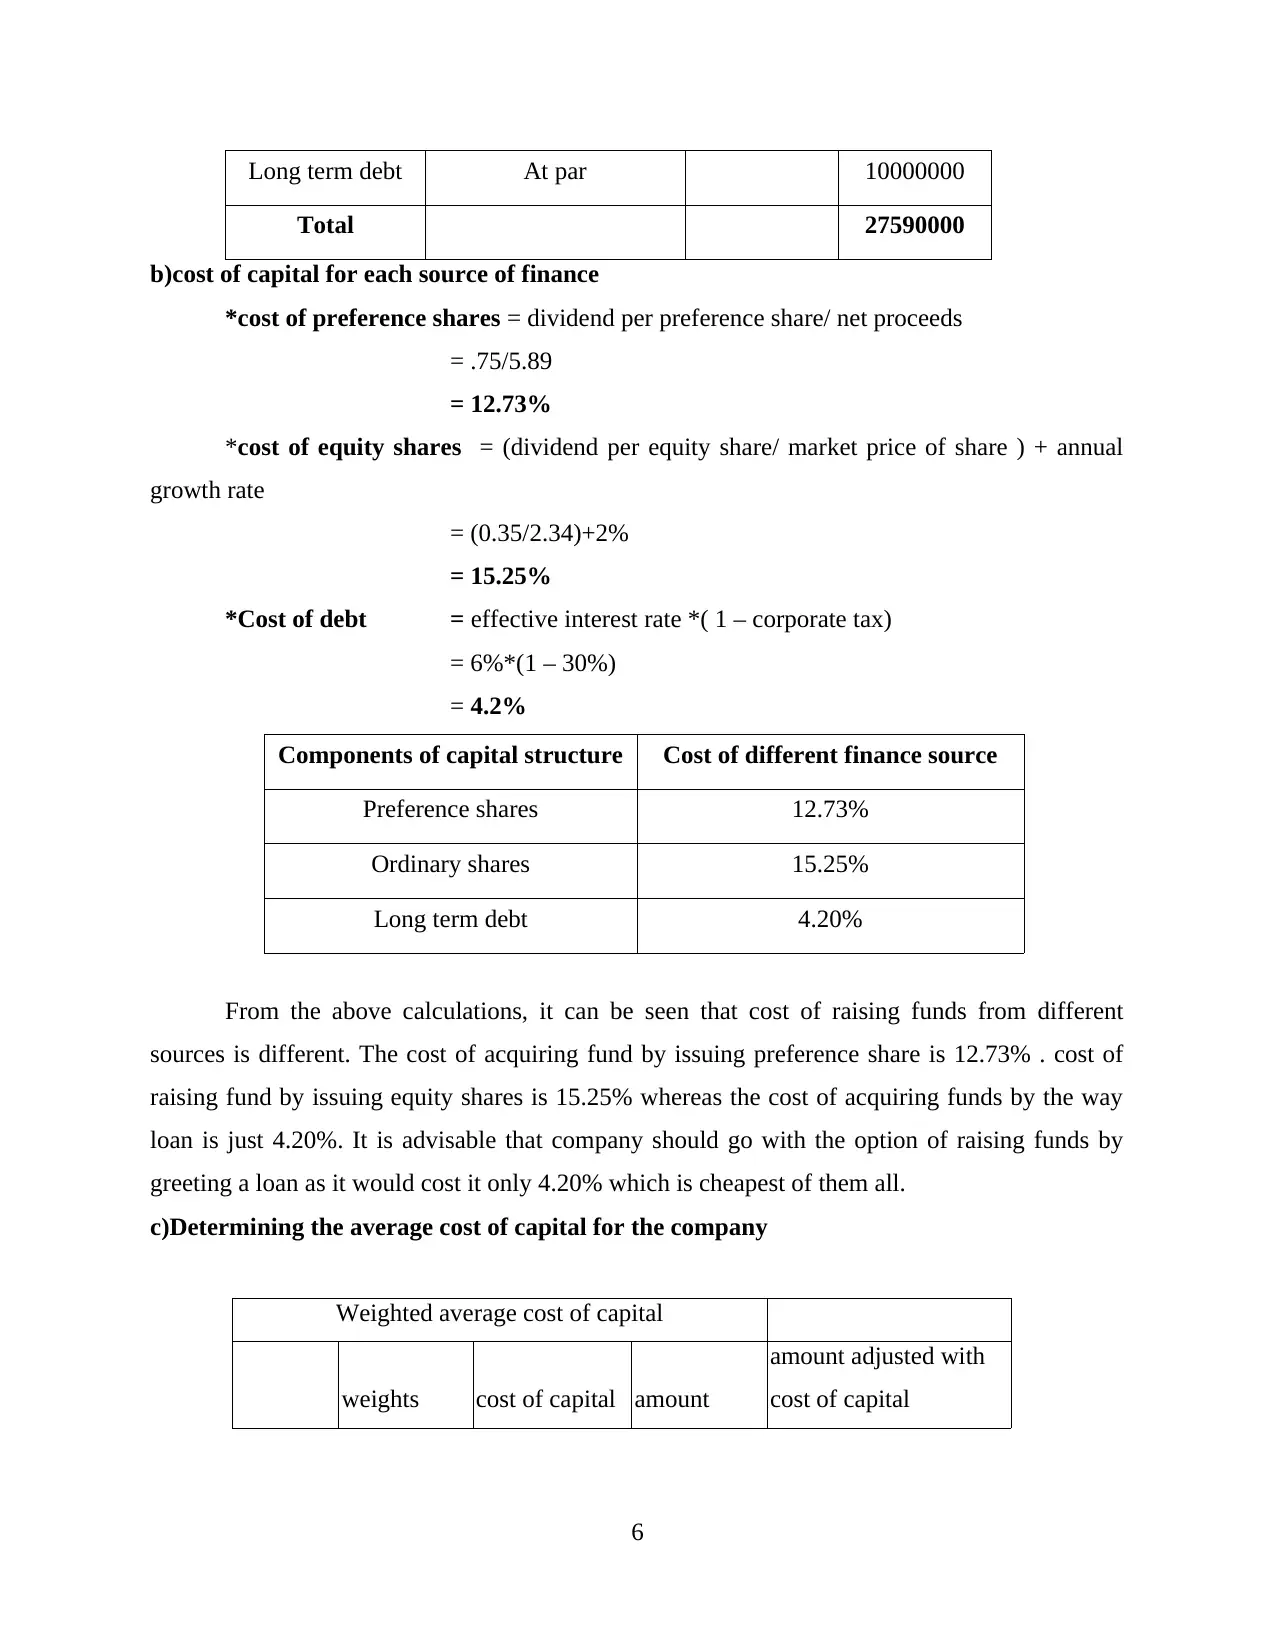
Long term debt At par 10000000
Total 27590000
b)cost of capital for each source of finance
*cost of preference shares = dividend per preference share/ net proceeds
= .75/5.89
= 12.73%
*cost of equity shares = (dividend per equity share/ market price of share ) + annual
growth rate
= (0.35/2.34)+2%
= 15.25%
*Cost of debt = effective interest rate *( 1 – corporate tax)
= 6%*(1 – 30%)
= 4.2%
Components of capital structure Cost of different finance source
Preference shares 12.73%
Ordinary shares 15.25%
Long term debt 4.20%
From the above calculations, it can be seen that cost of raising funds from different
sources is different. The cost of acquiring fund by issuing preference share is 12.73% . cost of
raising fund by issuing equity shares is 15.25% whereas the cost of acquiring funds by the way
loan is just 4.20%. It is advisable that company should go with the option of raising funds by
greeting a loan as it would cost it only 4.20% which is cheapest of them all.
c)Determining the average cost of capital for the company
Weighted average cost of capital
weights cost of capital amount
amount adjusted with
cost of capital
6
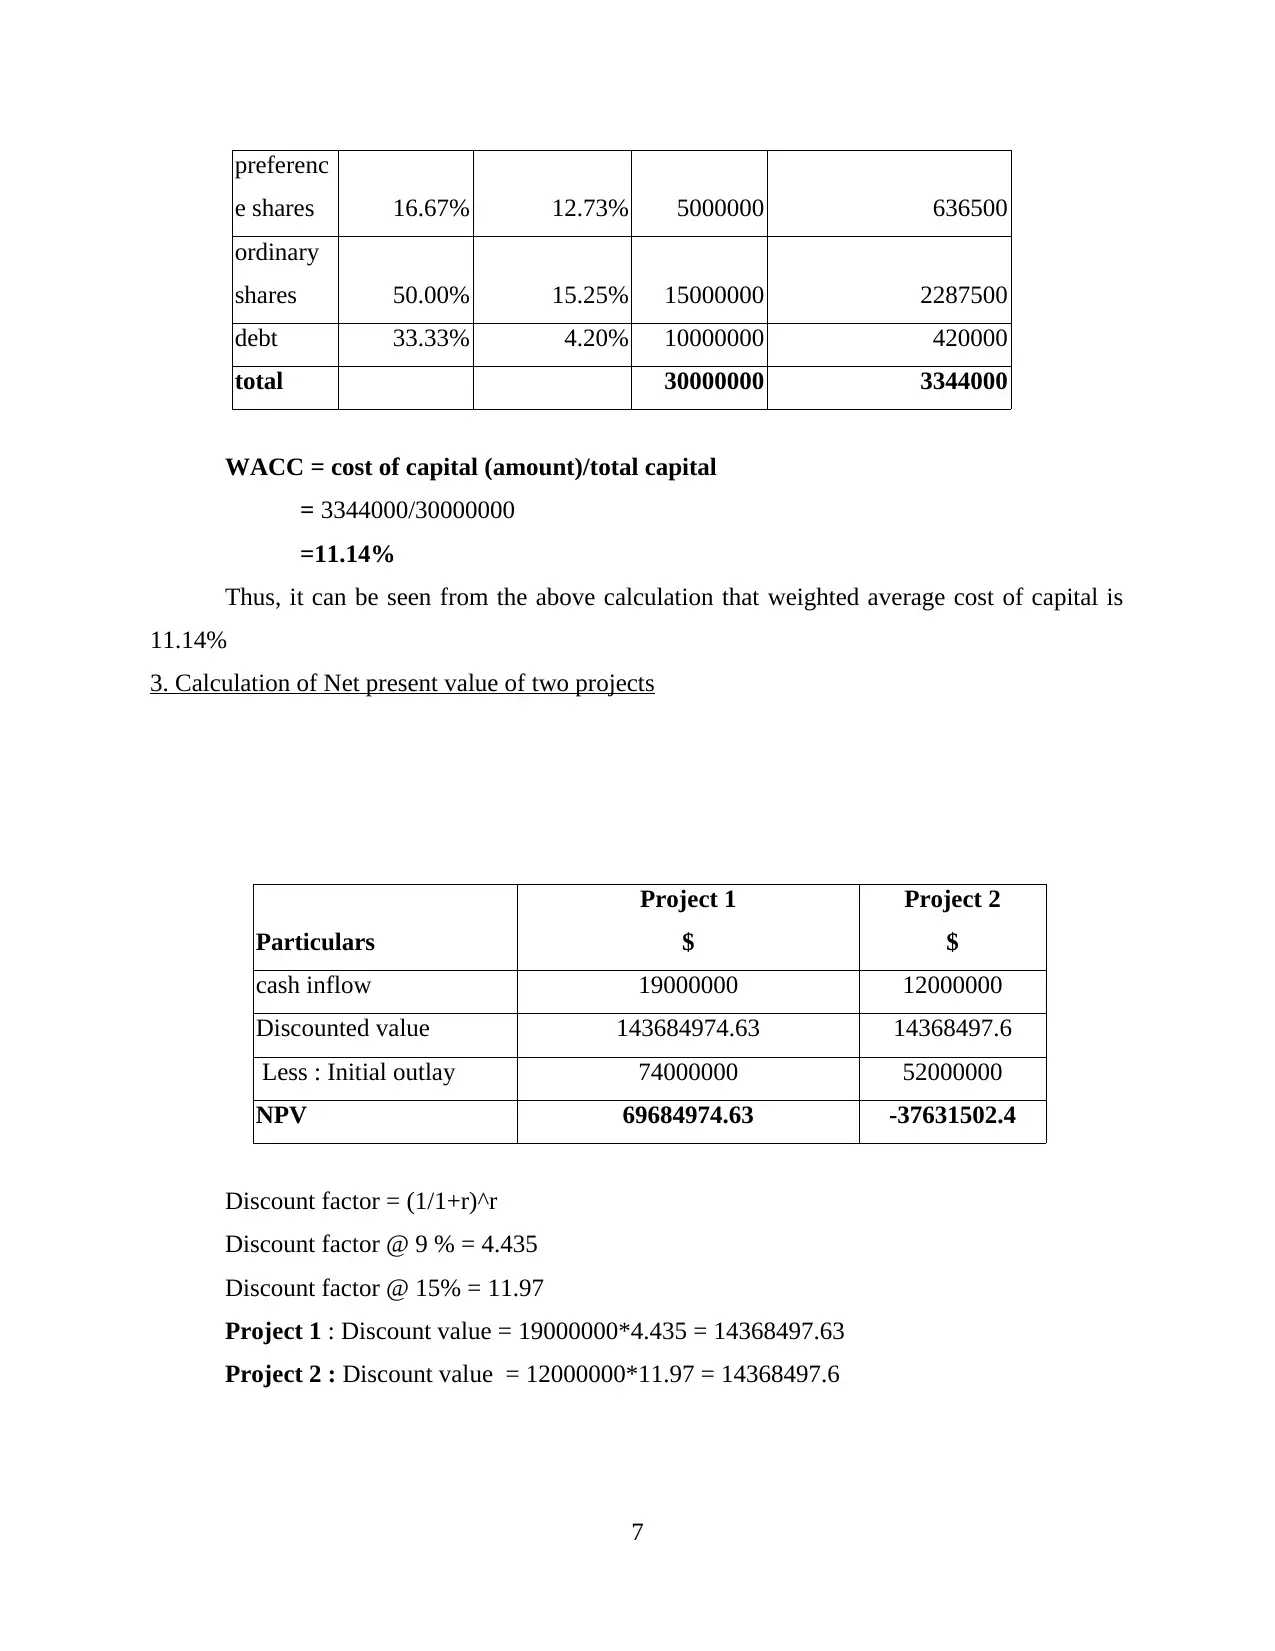
preferenc
e shares 16.67% 12.73% 5000000 636500
ordinary
shares 50.00% 15.25% 15000000 2287500
debt 33.33% 4.20% 10000000 420000
total 30000000 3344000
WACC = cost of capital (amount)/total capital
= 3344000/30000000
=11.14%
Thus, it can be seen from the above calculation that weighted average cost of capital is
11.14%
3. Calculation of Net present value of two projects
Particulars
Project 1
$
Project 2
$
cash inflow 19000000 12000000
Discounted value 143684974.63 14368497.6
Less : Initial outlay 74000000 52000000
NPV 69684974.63 -37631502.4
Discount factor = (1/1+r)^r
Discount factor @ 9 % = 4.435
Discount factor @ 15% = 11.97
Project 1 : Discount value = 19000000*4.435 = 14368497.63
Project 2 : Discount value = 12000000*11.97 = 14368497.6
7
⊘ This is a preview!⊘
Do you want full access?
Subscribe today to unlock all pages.
Trusted by 1+ million students worldwide
Interpretation : From the above calculation, it can be interpreted that the NPV of project
1 is positive at the $ 69684974.63 as compared to the project 2 whose NPV is negative which is
$-37631502.4. The scientist is advisable to accept the project 1 because the net present value of
the cash flow of it is positive which means that this project will add value to the wealth of the
client while project 2 which have the negative NPV will bring losses to the client if the
investment is done in it. Thus, project 1 should be accepted by the client.
CONCLUSION
From the above project report, it can be summarised that business finance is the most
essential thing without which a company cannot be run. Finance is required for undertaking all
the commercial activities for which an organisation has been set up. Procuring finance and
optimally allocating to the most productive use is the main purpose of financial management. In
the project report, it was seen that before making huge investment in a project or asset, it is
advisable to look into the viability and profitability of the asset intending to be purchased. This is
necessary because the amount involved in investment is so huge that it decision went wrong, it
can bring huge losses for the company. Evaluation of the project could be done by using NPV
method which analyses the profitability of the different project that tells which project should be
taken up and which not.
8
Paraphrase This Document
Need a fresh take? Get an instant paraphrase of this document with our AI Paraphraser
REFERENCES
Books and Journals
Abor, J.Y., 2017. Evaluating Capital Investment Decisions: Capital Budgeting.
In Entrepreneurial Finance for MSMEs (pp. 293-320). Palgrave Macmillan, Cham.
Al-Mutairi, A., Naser, K. and Saeid, M., 2018. Capital budgeting practices by non-financial
companies listed on Kuwait Stock Exchange (KSE). Cogent Economics & Finance. 6(1).
p.1468232.
Andor, G., Mohanty, S. K. and Toth, T., 2015. Capital budgeting practices: A survey of Central
and Eastern European firms. Emerging Markets Review. 23. pp.148-172.
Ang, J. S., 2018. Toward a Corporate Finance Theory for the Entrepreneurial Firm. FSU College
of Law, Public Law Research Paper, (872).
Nawaiseh, M.E and et.al., 2017, September. The Use of Capital Budgeting Techniques as a Tool
for Management Decisions: Evidence from Jordan. In International Conference on
Engineering, Project, and Product Management (pp. 301-309). Springer, Cham.
Smit, H. T. and Trigeorgis, L., 2017. Strategic NPV: Real options and strategic games under
different information structures. Strategic Management Journal. 38(13). pp.2555-2578.
Turner, M.J., 2017. Precursors to the financial and strategic orientation of hotel property capital
budgeting. Journal of Hospitality and Tourism Management. 33. pp.31-42.
Online
Capital Asset Pricing Model (CAPM). 2019. [Online] Available through :
<https://investinganswers.com/dictionary/c/capital-asset-pricing-model-capm>
Efficient Capital Market.2002. [Online] Available through
<http://www.econlib.org/library/Enc1/EfficientCapitalMarkets.html>
9
1 out of 11
Related Documents


Your All-in-One AI-Powered Toolkit for Academic Success.
+13062052269
info@desklib.com
Available 24*7 on WhatsApp / Email
![[object Object]](/_next/static/media/star-bottom.7253800d.svg)
Unlock your academic potential
Copyright © 2020–2026 A2Z Services. All Rights Reserved. Developed and managed by ZUCOL.