Canterbury Christ Church Business Decision Making Report

Verified

Added on  2023/06/08

|9
|1510
|288
Report
AI Summary
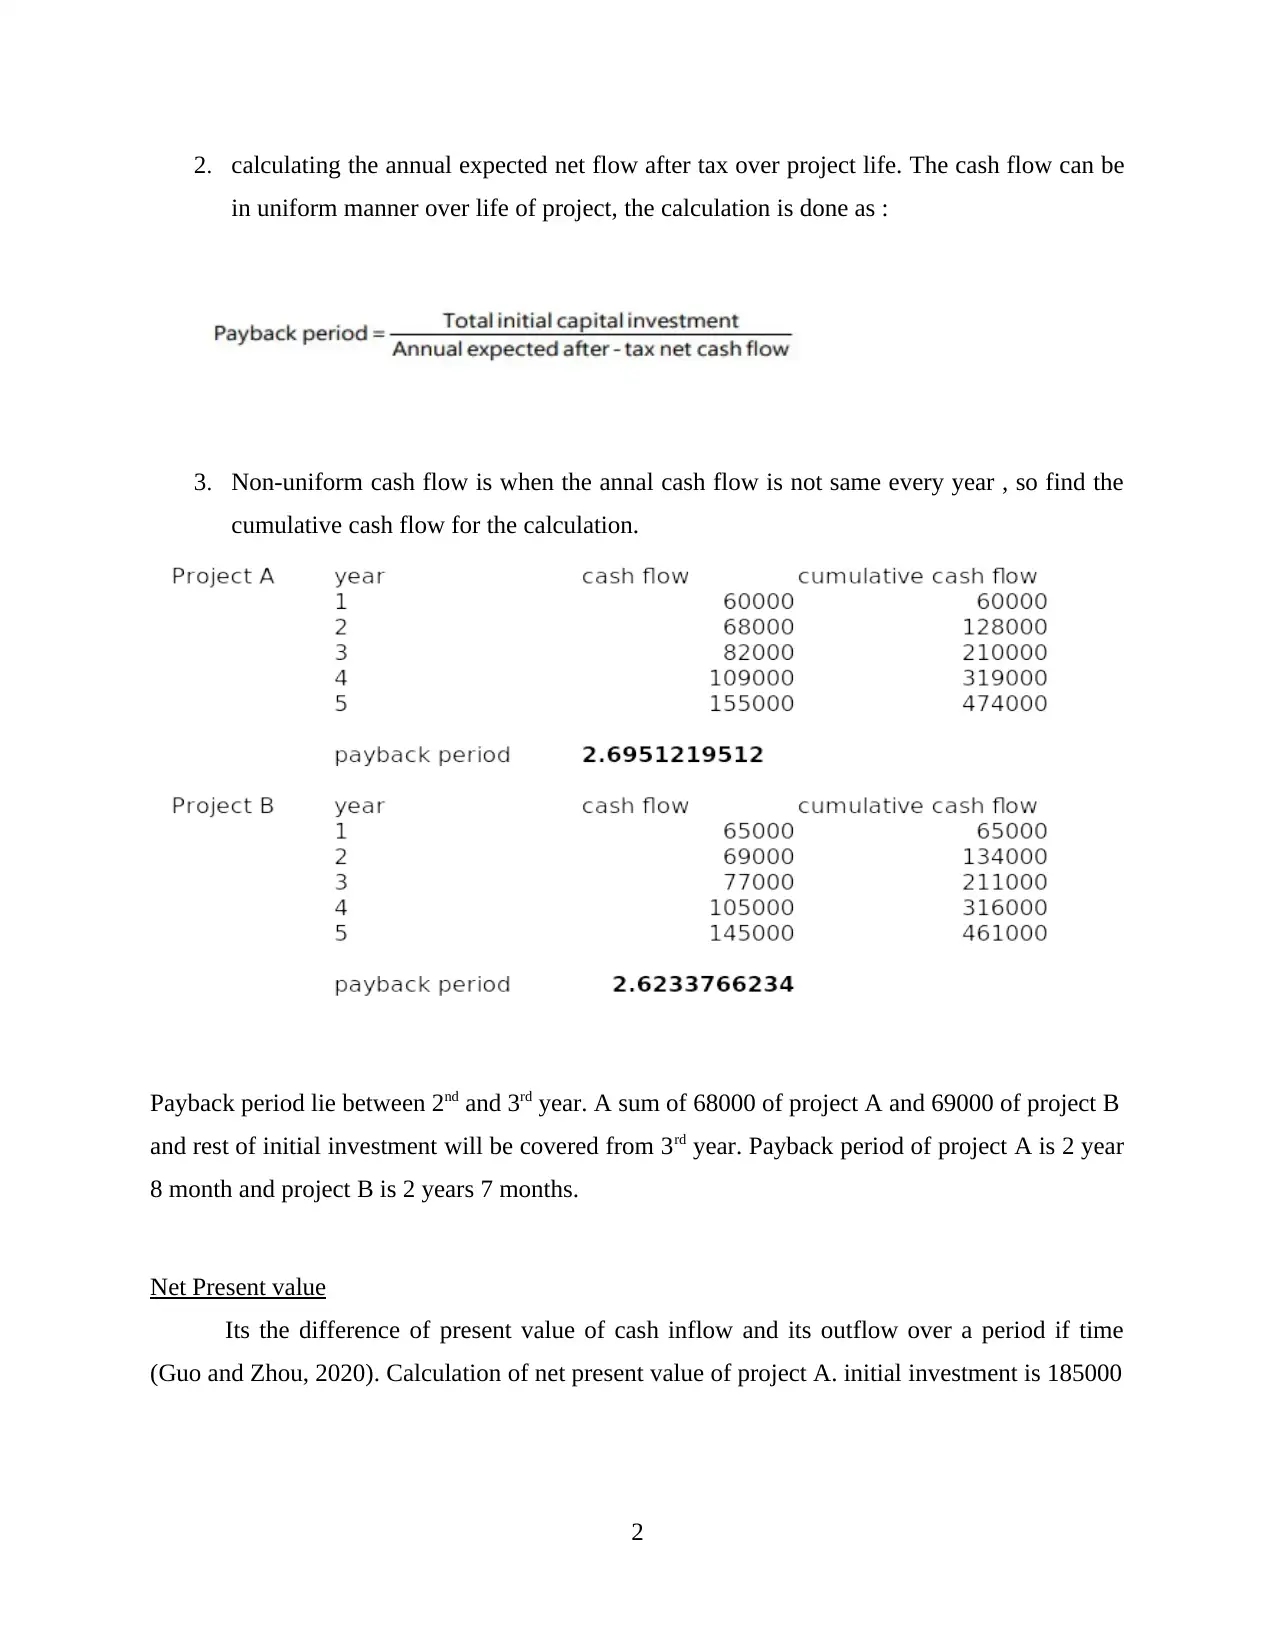
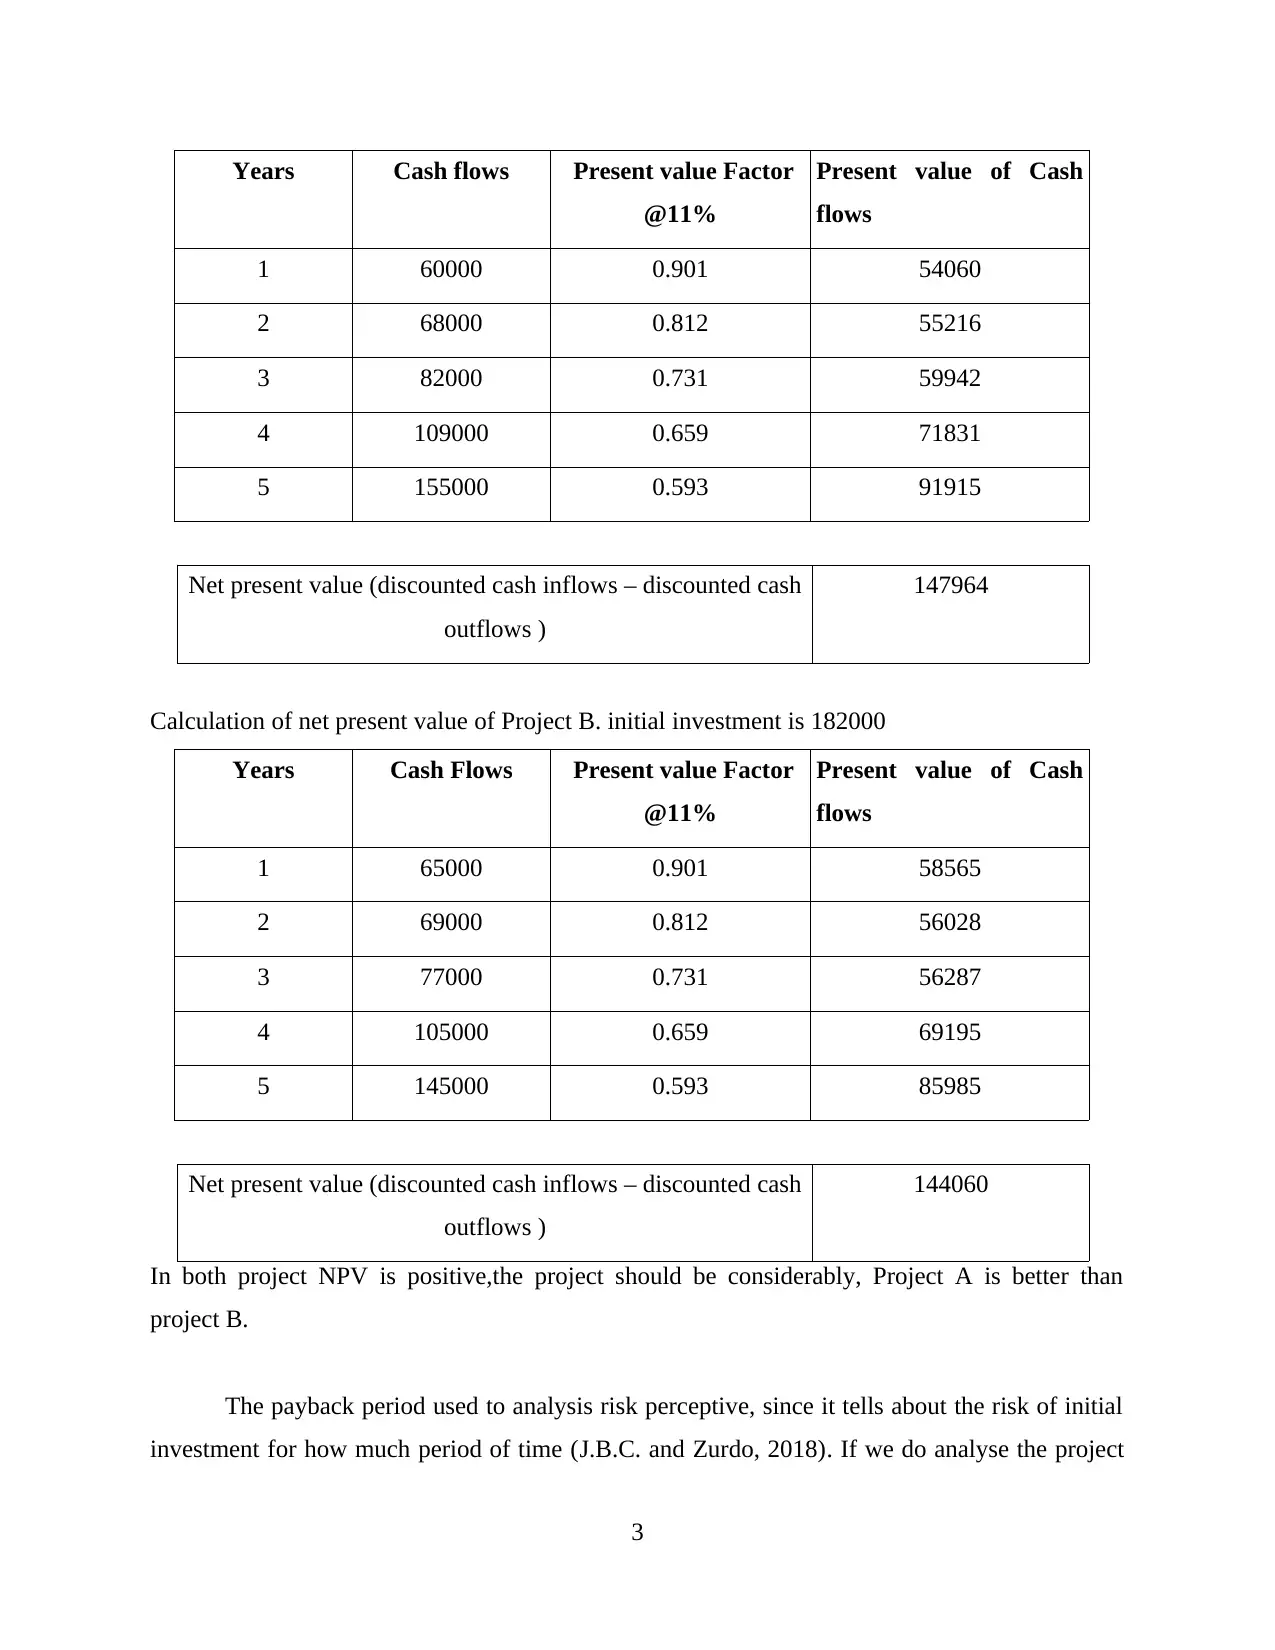
This report examines the business decision-making process, focusing on investment appraisal techniques to analyze two projects: synthetic leather bags (Project A) and clothes bags (Project B). It delves into the payback period and net present value (NPV) methods, calculating and comparing the financial outcomes of each project. The analysis includes detailed calculations of cash flows, present values, and discounted cash inflows to determine the profitability and risk associated with each investment. Financial and non-financial factors influencing the decisions are also explored, with considerations for risk, inflation, and the limitations of each method. The report concludes that Project A is the better option based on the analysis and discusses the importance of financial and non-financial factors in investment decision-making. The report references various books and journals to support the analysis.
tabler-icon-diamond-filled.svg

Contribute Materials

Your contribution can guide someone’s learning journey. Share your documents today.
Document Page
Business Decision
tabler-icon-diamond-filled.svg

Secure Best Marks with AI Grader

Need help grading? Try our AI Grader for instant feedback on your assignments.
Document Page
Table of Contents
INTRODUCTION...........................................................................................................................1
Business Decision Making...........................................................................................................1
MAIN BODY ..................................................................................................................................1
Payback period.............................................................................................................................1
Net Present value.........................................................................................................................2
Financial factors...........................................................................................................................4
Non-financial factors...................................................................................................................5
CONCLUSION................................................................................................................................5
REFERENCES................................................................................................................................6
Books and journals.......................................................................................................................6
Document Page
Document Page
INTRODUCTION
Business Decision Making
Process involves identifying goals, gathering relevant and necessary information and
considering alternative in order to make a decision. The concept sound simple, but many
overlook the critical steps and risk involved in decision making. Decision maker use various
different decision making model to understand the analysis and overcome the challenges
(Goswami and Sharma, 2021). This report contains the analysis of investment appraisal
techniques like payback period and net present value method. In order to maximise the dividend
to shareholder, business must select the best and most profitable model to chosen according to
companies dynamics.
MAIN BODY
Initial investment required for project A (synthetic leather bags) is £185,000 and for
project B (clothes bags) is £182,000. The discount rate required is at 11%. The net cash flows for
two projects can be summarized as below:
Year Project A – Synthetic Leather Bags
Net cashflow £
Project B –Clothes Bags
Net cashflow £
1 60,000 65,000
2 68,000 69,000
3 82,000 77,000
4 109,000 105,000
5 155,000 145,000
An organisation uses one or more than one techniques for capital investment evaluation. Some
most used techniques are payback period, Net present value, internal rate of return and many
more.
Payback period
Time needed to recover initial cash investment or length of time it takes an investor to
reach break even.
Steps to calculate payback period:
1. Determining the total original capital invested (cash flow)
1
tabler-icon-diamond-filled.svg

Secure Best Marks with AI Grader

Need help grading? Try our AI Grader for instant feedback on your assignments.
Document Page
2. calculating the annual expected net flow after tax over project life. The cash flow can be
in uniform manner over life of project, the calculation is done as :
3. Non-uniform cash flow is when the annal cash flow is not same every year , so find the
cumulative cash flow for the calculation.
Payback period lie between 2nd and 3rd year. A sum of 68000 of project A and 69000 of project B
and rest of initial investment will be covered from 3rd year. Payback period of project A is 2 year
8 month and project B is 2 years 7 months.
Net Present value
Its the difference of present value of cash inflow and its outflow over a period if time
(Guo and Zhou, 2020). Calculation of net present value of project A. initial investment is 185000
2
Document Page
Years Cash flows Present value Factor
@11%
Present value of Cash
flows
1 60000 0.901 54060
2 68000 0.812 55216
3 82000 0.731 59942
4 109000 0.659 71831
5 155000 0.593 91915
Net present value (discounted cash inflows – discounted cash
outflows )
147964
Calculation of net present value of Project B. initial investment is 182000
Years Cash Flows Present value Factor
@11%
Present value of Cash
flows
1 65000 0.901 58565
2 69000 0.812 56028
3 77000 0.731 56287
4 105000 0.659 69195
5 145000 0.593 85985
Net present value (discounted cash inflows – discounted cash
outflows )
144060
In both project NPV is positive,the project should be considerably, Project A is better than
project B.
The payback period used to analysis risk perceptive, since it tells about the risk of initial
investment for how much period of time (J.B.C. and Zurdo, 2018). If we do analyse the project
3
Document Page
using payback period then accept those who have a rapid period of payback and the decline those
which have the longer one. In this Project A and Project B have a payback period of 2.695 and
2.623 (I.e. 2 years and 8 mouth and 2 years and 7 months) respectively. The difference is small
but the investment in project B is less, so risk comparative less than Project A. The asset life
span expires immediately after its initial investment is recovered and additional cash flow would
not be generated .
The net present value is one the most famous tools to evaluating capital project. It identified total
estimated value of the project expressed in pounds. By comparing the project A and project B
we can figure out which is more promising and better choice to invest in by their figures. Net
present value of Project A is £147964 and net present value of Project B is £144060. Both the
figures are positive. So lets compare the figures, NPV of project A is Higher which means its
more profitable then the other one. Doing both project is fine but the difference in minute or its
can be also analyse by finding its profitability index dividing each project's NPV to its upfront
costs.
The profit index if project A is higher means more profit made at each 1 pound invested.
The payback period cons are more than Net present value. Payback period overlooks the factor
like inflation and cost of capital. Payback period does not consider cash flow beyond a time
horizon and these cash flow can be substantial. Its important for S&P plc needs this to think
about. If we look on other hand, then NPV method lies on assumptions. If discount rate is not
correct then calculation will go off and the error would be unseen till the final big dump. The
combination of both method is also a good decision, payback period would eliminate and narrow
down the option and NPV possibly find a better project.
Financial factors
Financial factors indicates the effect on investment in cash flow of company. Internal
factors that influence financial decisions includes the nature of business, the size of the company,
the expected rate of return, the cost and risks involved, the company's assets structure, ownership
structure, investor expectations, the age of the company and includes liquidity. The impact of
financial factors on the business compare the expected rate of return with the cost of capital and
the cost of financing. Financial element includes increased production flexibility and quality
control. It monitors the growth of the market and increase in market share. It also improves the
4
tabler-icon-diamond-filled.svg

Paraphrase This Document

Need a fresh take? Get an instant paraphrase of this document with our AI Paraphraser
Document Page
company image, improves morale and job satisfaction and increase productivity. Whenever
possible, it is important to evaluate the return on investment financially (Messer, 2020).
Non-financial factors
It includes product quality, firm flexibility, resources utilization and market orientation
are regarded as important determinants in improving the profitability related performance of
company. Non financial factors fulfil current and future legal obligation. These comply with
benchmark standard and activity. It boost the employee morale and assist with personnel
recruitment. Supplier and clients relationship are enhanced, rising the company's goodwill. These
factors predicts future threats such as business protection of intellectual belongings from
potential rivalry (Nnamseh and Edema, 2020) .
CONCLUSION
As to summarised the report, Strategic management of S&P plc has two project A and
Project B. This report includes two techniques of capital investment which are Payback period
and Net present value that enable the management and other stakeholder to make important
decision regarding business techniques selection. This report selects the project A because it
better option than project B, Payback period and NPV of project A is better. It also talks about
the importance of financial and non financial factors on investment decision making.
5
Document Page
REFERENCES
Books and journals
Goswami, and Sharma, A., 2021. Realtime analysis and visualization of data for instant
decisions: A futuristic requirement of the digital world. Materials Today: Proceedings.
Guo, H and Zhou, Y., 2020. Location-inventory decisions for closed-loop supply chain
management in the presence of the secondary market. Annals of Operations Research, 291(1).
pp.361-386.
Lozano, J.B.C.and Zurdo, R.J.P., 2018. The management of forecasting in business decisions:
An empirical analysis. Revista Espacios.
Messer, R., 2020. Making a Lot of Decisions. In Financial Modeling for Decision Making: Using
MS-Excel in Accounting and Finance. Emerald Publishing Limited.
Nnamseh, M.P. and Edema, A.J.M., 2020. New Business Entry Density as a Pathway to
Strategic Decisions in Firm Formation and Job Creation in Akwa Ibom State, Nigeria. Journal of
Talent Development and Excellence, 12(1). pp.5154-5170.
6
chevron_up_icon
1 out of 9
circle_padding
hide_on_mobile
zoom_out_icon
logo.png

Your All-in-One AI-Powered Toolkit for Academic Success.

Available 24*7 on WhatsApp / Email

[object Object]