Financial Analysis Report: Business Plan and Loan Recommendation
VerifiedAdded on 2022/12/15
|7
|931
|156
Report
AI Summary
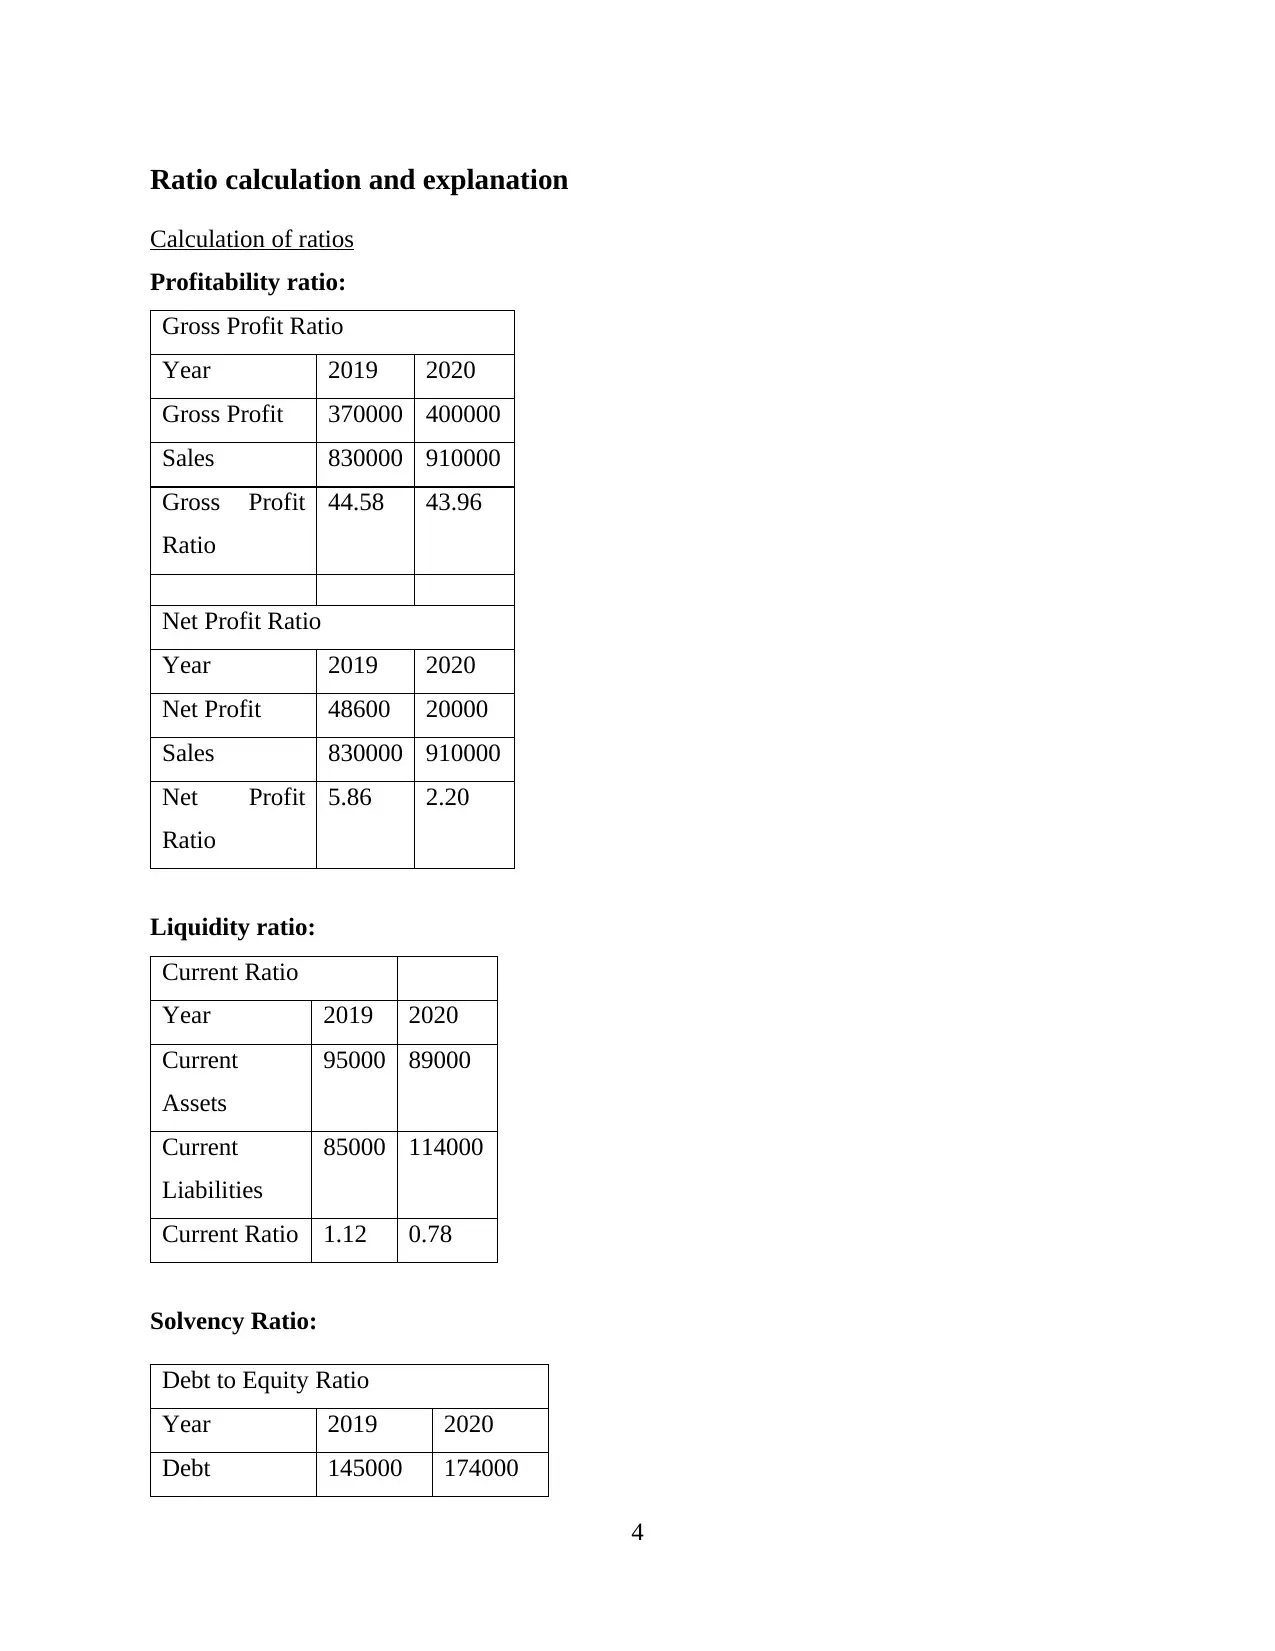
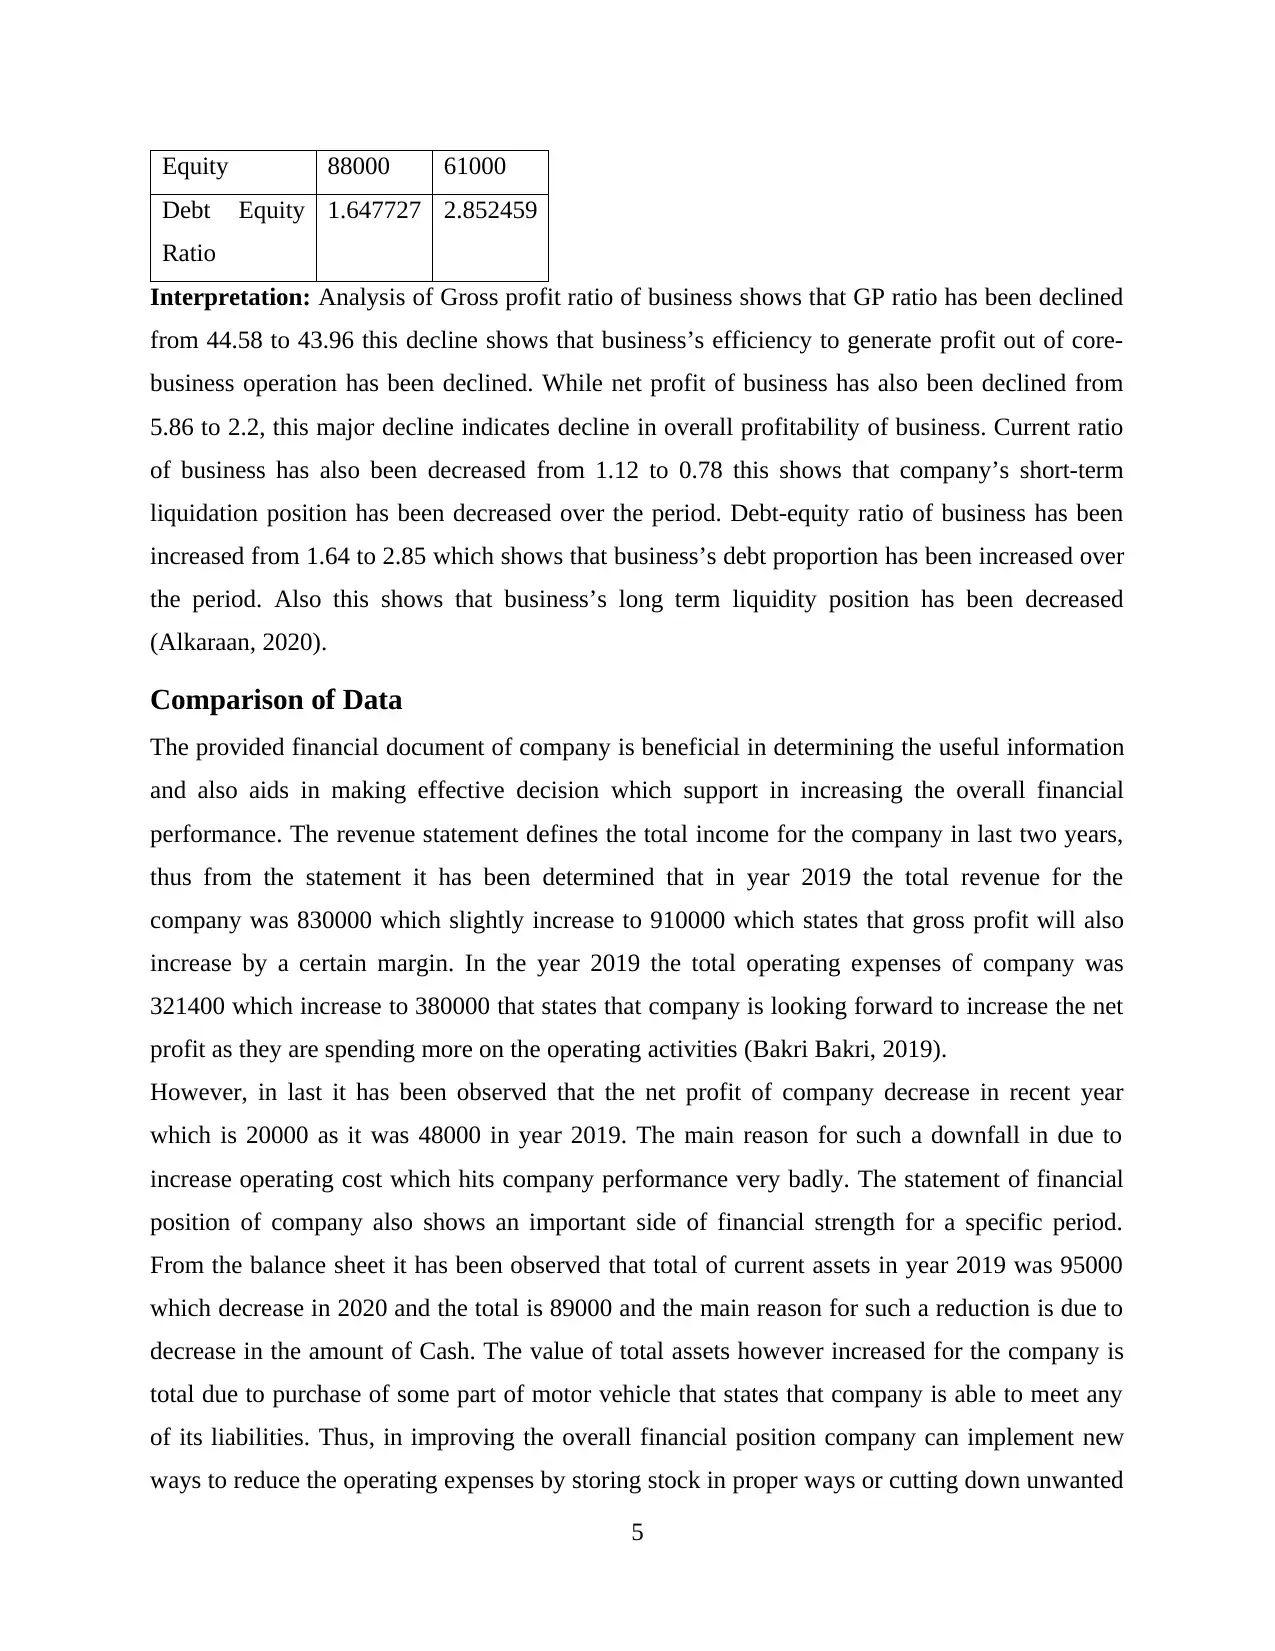
This report provides a financial analysis of a business plan, focusing on ratio calculations and data comparison to assess the company's financial performance over two years (2019 and 2020). The report includes an executive summary, calculation and explanation of profitability (Gross Profit, Net Profit), liquidity (Current Ratio), and solvency (Debt-to-Equity) ratios. The analysis reveals trends, highlighting a decline in profitability and liquidity, and an increase in debt. The comparison of financial data aids in effective decision-making. Based on the analysis, the report offers a recommendation regarding a loan option, advising against further long-term debt. The report concludes by emphasizing the importance of financial planning and ratio analysis in improving financial performance. References to relevant academic sources are also included.

Finance Business Plan
(Business plan)
1
(Business plan)
1
Paraphrase This Document
Need a fresh take? Get an instant paraphrase of this document with our AI Paraphraser

Executive summary
The file summarizes the detailed calculation of ratios for two years and their explanation to
determine the trends, financial data is compared to analyse the improvements. The following
report also covers recommendation for the company weather to accept or reject the loan option.
2
The file summarizes the detailed calculation of ratios for two years and their explanation to
determine the trends, financial data is compared to analyse the improvements. The following
report also covers recommendation for the company weather to accept or reject the loan option.
2

Contents
Executive summary.........................................................................................................................2
Contents...........................................................................................................................................3
Ratio calculation and explanation....................................................................................................4
Calculation of ratios.....................................................................................................................4
Comparison of Data.........................................................................................................................5
Recommendation.............................................................................................................................5
Conclusion.......................................................................................................................................5
3
⊘ This is a preview!⊘
Do you want full access?
Subscribe today to unlock all pages.

Trusted by 1+ million students worldwide

Ratio calculation and explanation
Calculation of ratios
Profitability ratio:
Gross Profit Ratio
Year 2019 2020
Gross Profit 370000 400000
Sales 830000 910000
Gross Profit
Ratio
44.58 43.96
Net Profit Ratio
Year 2019 2020
Net Profit 48600 20000
Sales 830000 910000
Net Profit
Ratio
5.86 2.20
Liquidity ratio:
Current Ratio
Year 2019 2020
Current
Assets
95000 89000
Current
Liabilities
85000 114000
Current Ratio 1.12 0.78
Solvency Ratio:
Debt to Equity Ratio
Year 2019 2020
Debt 145000 174000
4
Paraphrase This Document
Need a fresh take? Get an instant paraphrase of this document with our AI Paraphraser

Equity 88000 61000
Debt Equity
Ratio
1.647727 2.852459
Interpretation: Analysis of Gross profit ratio of business shows that GP ratio has been declined
from 44.58 to 43.96 this decline shows that business’s efficiency to generate profit out of core-
business operation has been declined. While net profit of business has also been declined from
5.86 to 2.2, this major decline indicates decline in overall profitability of business. Current ratio
of business has also been decreased from 1.12 to 0.78 this shows that company’s short-term
liquidation position has been decreased over the period. Debt-equity ratio of business has been
increased from 1.64 to 2.85 which shows that business’s debt proportion has been increased over
the period. Also this shows that business’s long term liquidity position has been decreased
(Alkaraan, 2020).
Comparison of Data
The provided financial document of company is beneficial in determining the useful information
and also aids in making effective decision which support in increasing the overall financial
performance. The revenue statement defines the total income for the company in last two years,
thus from the statement it has been determined that in year 2019 the total revenue for the
company was 830000 which slightly increase to 910000 which states that gross profit will also
increase by a certain margin. In the year 2019 the total operating expenses of company was
321400 which increase to 380000 that states that company is looking forward to increase the net
profit as they are spending more on the operating activities (Bakri Bakri, 2019).
However, in last it has been observed that the net profit of company decrease in recent year
which is 20000 as it was 48000 in year 2019. The main reason for such a downfall in due to
increase operating cost which hits company performance very badly. The statement of financial
position of company also shows an important side of financial strength for a specific period.
From the balance sheet it has been observed that total of current assets in year 2019 was 95000
which decrease in 2020 and the total is 89000 and the main reason for such a reduction is due to
decrease in the amount of Cash. The value of total assets however increased for the company is
total due to purchase of some part of motor vehicle that states that company is able to meet any
of its liabilities. Thus, in improving the overall financial position company can implement new
ways to reduce the operating expenses by storing stock in proper ways or cutting down unwanted
5

activities which are not profitable. Company can consider current debts and notice if that can
combine them into a low interest, low fee product. When refinancing the current debt, make sure
you shop around to see if you can you get a better deal elsewhere (Javed, Zeadally and Hamida,
2019).
Recommendation
As stated form above analysis that business’s overall debts have been increased significantly
which is not a good sign for business’s long term liquidity performance. Also, short term
liquidity position has been declined over the stated period since business’s current ratio has been
declined (Islam, Sharma and Rajan, 2019). So overall analysis shows that company should not
take further debt especially long term debt.
Conclusion
The above report, is helpful in founding that proper financial plans support in making
informed decision which directly increase the financial performance and strength for respective
years. Ratio analysis is beneficial in determining the trends between two years that performance
in increasing or decreasing so measures can be made to improve the declining performance.
6
⊘ This is a preview!⊘
Do you want full access?
Subscribe today to unlock all pages.

Trusted by 1+ million students worldwide

References
Books and journals
Alkaraan, F., 2020. Strategic investment decision-making practices in large manufacturing
companies. Meditari Accountancy Research.
Bakri Bakri, A., 2019. Capital investment appraisal: the case of Lebanon (Doctoral dissertation,
University of Dundee).
Islam, M.J., Sharma, A. and Rajan, H., 2019. A cyberinfrastructure for big data transportation
engineering. Journal of Big Data Analytics in Transportation, 1(1), pp.83-94.
Javed, M.A., Zeadally, S. and Hamida, E.B., 2019. Data analytics for cooperative intelligent
transport systems. Vehicular communications, 15, pp.63-72.
7
1 out of 7
Related Documents

Your All-in-One AI-Powered Toolkit for Academic Success.
+13062052269
info@desklib.com
Available 24*7 on WhatsApp / Email
Unlock your academic potential
Copyright © 2020–2025 A2Z Services. All Rights Reserved. Developed and managed by ZUCOL.