Business Decision Making Report: WM Morrison Case Study
VerifiedAdded on 2019/12/03
|19
|4029
|507
Report
AI Summary
This report provides a detailed analysis of WM Morrison's business decision-making processes. The study begins with an introduction to the competitive retail environment and the importance of strategic, tactical, and operational decisions. Task 1 focuses on the collection of primary and secondary data, including survey methodology and questionnaire design to understand consumer behavior regarding food discount retailing. Task 2 involves summarizing sales and profit data, analyzing results using descriptive statistics, measures of dispersion, quartile, percentile and correlation coefficient to draw valid conclusions about the company's performance. Task 3 covers the production of graphs using spreadsheets, trend lines for sales forecasting, and the creation of a business presentation and formal report. Finally, Task 4 explores the use of information processing tools, planning activities, and financial tools for decision-making, culminating in a conclusion that summarizes the key findings and recommendations for WM Morrison.
BUSINESS DECISION
MAKING
MAKING
Paraphrase This Document
Need a fresh take? Get an instant paraphrase of this document with our AI Paraphraser
Table of Contents
INTRODUCTION...........................................................................................................................1
TASK 1............................................................................................................................................1
1.1 Plan for collection of primary and secondary information....................................................1
1.2 Survey methodology and sampling frame used.....................................................................2
1.3 Questionnaire for the survey..................................................................................................2
TASK 2............................................................................................................................................4
2.1 Information for decision making by summarizing information............................................4
2.2 Analyze results to draw valid conclusions.............................................................................5
2.3 Analyzing data using measures of dispersion........................................................................5
2.4 Explain how quartile, percentile and correlation coefficient are used to draw valid
conclusion....................................................................................................................................5
TASK 3............................................................................................................................................7
3.1 Producing graphs using spreadsheet......................................................................................7
3.2 Trend lines in spreadsheet for forecasting sales revenue.....................................................10
3.3 Business presentation...........................................................................................................13
3.4 Formal business report.........................................................................................................13
TASK 4..........................................................................................................................................13
4.1 Appropriate information processing tools...........................................................................13
4.2 Plan for the activity and determination of the critical path for Wm Morrison plc..............14
4.3 Use of financial tools for decision making..........................................................................15
CONCLUSION..............................................................................................................................16
REFERENCES..............................................................................................................................18
INTRODUCTION
In present era, organizations operate in the competitive environment due to which it has
become difficult for firms to sustain in the market for longer period of time and is leading to
decline in their overall efficiency level. Further, various decisions have to be taken by the
management which are linked with the overall development and growth of company in market
(Leach, 2011). Decisions have to be taken by top authorities of firm at strategic, tactical and
operational level. Moreover, without analysing the market conditions, it is not possible for
enterprise to take appropriate decisions and in turn, it acts as the hurdle in accomplishment of
desired goals and objectives. For carrying out the present study, organization chosen is WM
Morrison which operates in retail sector and is well known in the market for range of products
which it offers to its target market. The basic aim of present research is to understand the
consumer behaviour and attitude of people in relation with food discount survey and through
this, business enterprise can take effective decisions. Various tasks have been covered in the
study which involves plan for the collection of primary and secondary data, survey methodology
etc.
TASK 1
1.1 Plan for collection of primary and secondary information
In order to obtain effective decisions, it is necessary to collect the information from both
primary and secondary sources so that organization can easily enhance its performance in the
market. Main mission of organization is to make it “Different and better than ever”. Main stress
of management is on enhancing the efficiency, capturing the growth and driving the top line.
Therefore, by considering both primary and secondary data, it is possible for firm to know the
perception of consumers about food discount retailing (Smit and Trigeorgis, 2011).
Plan for collection of primary information
For collection of primary information, technique of online survey has been considered
and well structured questionnaire has been designed with the help of which attitude and overall
preferences of customers can be known in Greater London regarding food discount retailing. Due
to this basic reason, collection of primary information is considered to be more effective and in
turn, leads to the accomplishment of desired goals and objectives (Jankowicz, 2004).
Plan for collection of secondary data
1
⊘ This is a preview!⊘
Do you want full access?
Subscribe today to unlock all pages.
Trusted by 1+ million students worldwide
For acquiring secondary information, various books, journals and online articles have
been referred. Further, specific information has been taken from annual report of WM Morrison
with the help of which effective decisions can be taken easily.
1.2 Survey methodology and sampling frame used
Survey methodology
For conducting survey in an effective manner, customers of WM Morrison have been
selected who are living in Greater London. Main aim behind carrying out survey is to determine
the behaviour of consumers and preferences towards food retailing by WM Morrison (Day,
2005). Further, for conducting online survey, email id of customers has been obtained who are
living in Greater London. So, with the help of this survey methodology, it is possible to obtain
effective primary information and it can support in accomplishing the aim of research as well.
Sampling frame
Sampling frame is associated with the selection of sample size from which data has to be
collected (Greasley, 2004). For acquiring information, technique of simple random has been
adopted where every individual is having equal chance of being selected for providing the
information regarding food retailing. Sample size of 40 customers has been selected who are
above the age group of 18 and are regarded as adult. Therefore, by considering customers of WM
Morrison as the sample, it is possible to collect accurate and up to date information and effective
decisions can be taken easily.
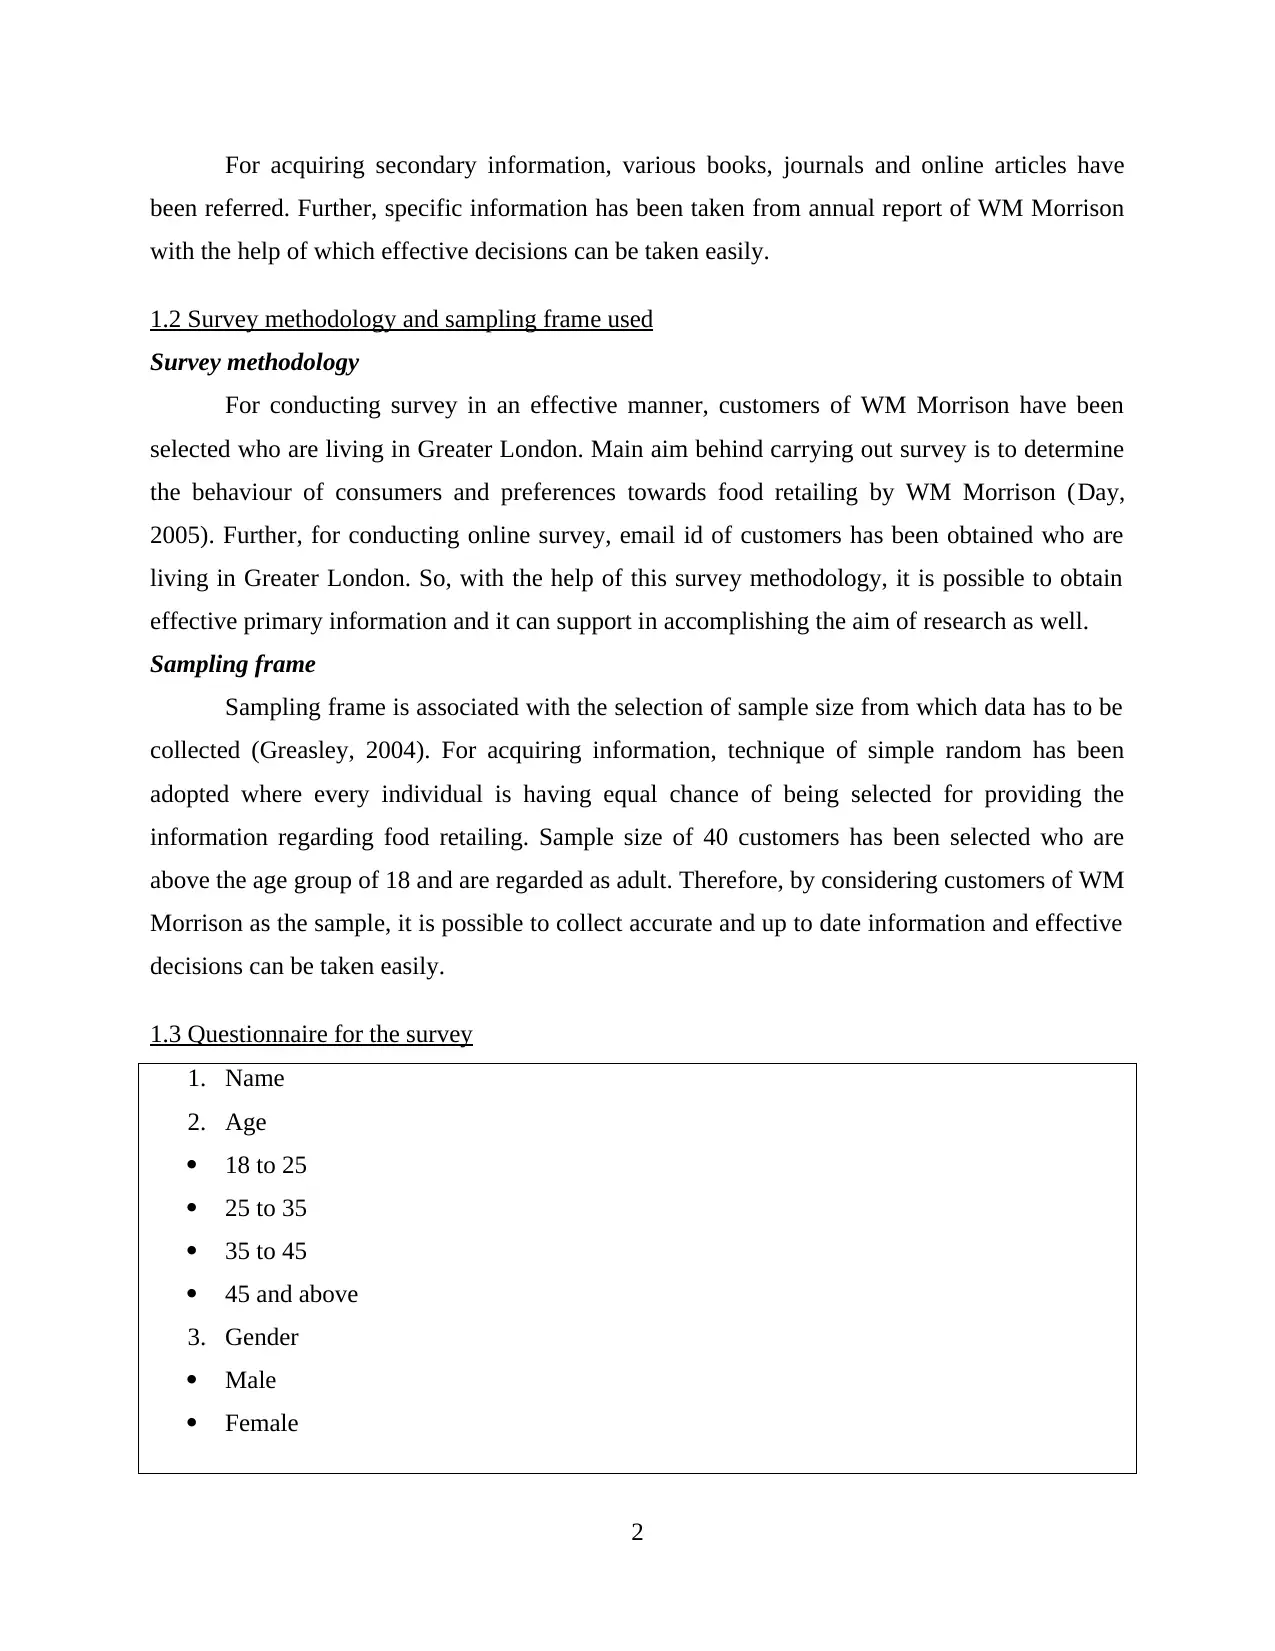
1.3 Questionnaire for the survey
1. Name
2. Age
18 to 25
25 to 35
35 to 45
45 and above
3. Gender
Male
Female
2
been referred. Further, specific information has been taken from annual report of WM Morrison
with the help of which effective decisions can be taken easily.
1.2 Survey methodology and sampling frame used
Survey methodology
For conducting survey in an effective manner, customers of WM Morrison have been
selected who are living in Greater London. Main aim behind carrying out survey is to determine
the behaviour of consumers and preferences towards food retailing by WM Morrison (Day,
2005). Further, for conducting online survey, email id of customers has been obtained who are
living in Greater London. So, with the help of this survey methodology, it is possible to obtain
effective primary information and it can support in accomplishing the aim of research as well.
Sampling frame
Sampling frame is associated with the selection of sample size from which data has to be
collected (Greasley, 2004). For acquiring information, technique of simple random has been
adopted where every individual is having equal chance of being selected for providing the
information regarding food retailing. Sample size of 40 customers has been selected who are
above the age group of 18 and are regarded as adult. Therefore, by considering customers of WM
Morrison as the sample, it is possible to collect accurate and up to date information and effective
decisions can be taken easily.
1.3 Questionnaire for the survey
1. Name
2. Age
18 to 25
25 to 35
35 to 45
45 and above
3. Gender
Male
Female
2
Paraphrase This Document
Need a fresh take? Get an instant paraphrase of this document with our AI Paraphraser
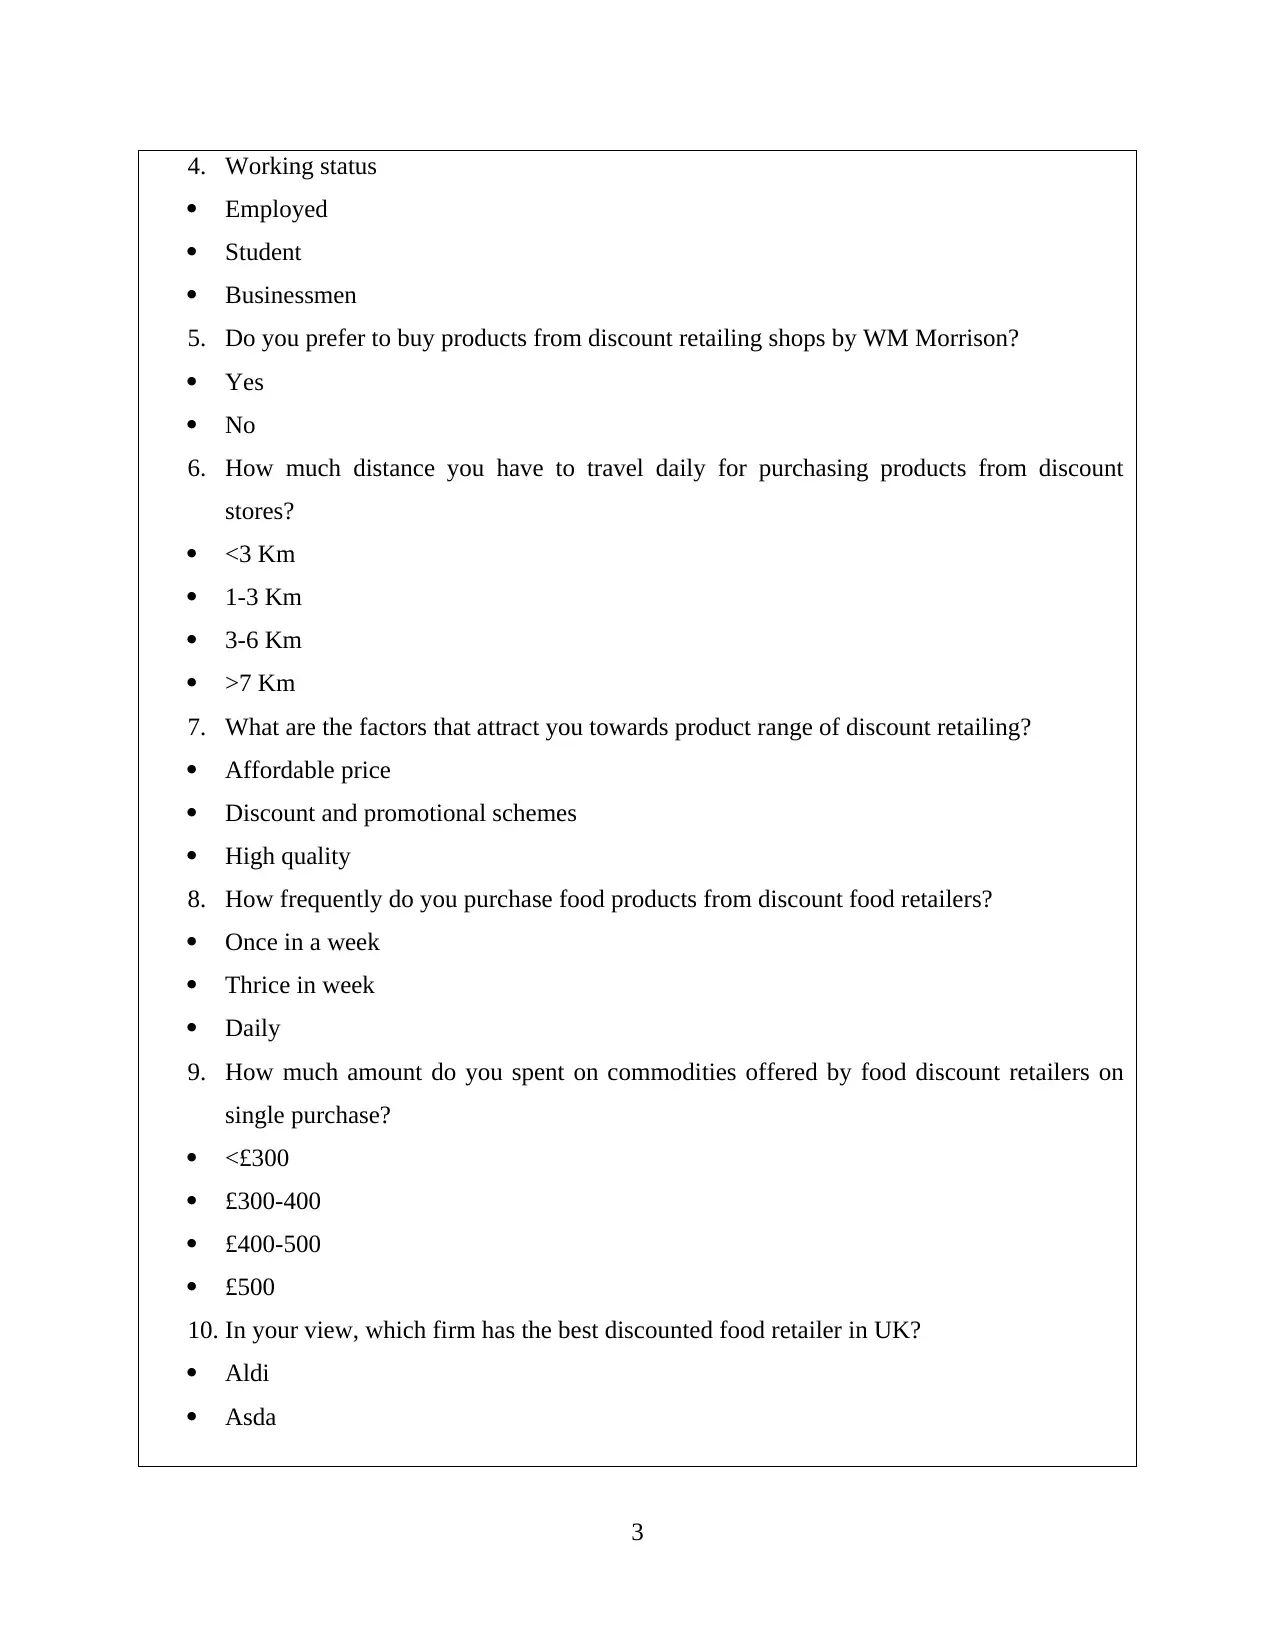
4. Working status
Employed
Student
Businessmen
5. Do you prefer to buy products from discount retailing shops by WM Morrison?
Yes
No
6. How much distance you have to travel daily for purchasing products from discount
stores?
<3 Km
1-3 Km
3-6 Km
>7 Km
7. What are the factors that attract you towards product range of discount retailing?
Affordable price
Discount and promotional schemes
High quality
8. How frequently do you purchase food products from discount food retailers?
Once in a week
Thrice in week
Daily
9. How much amount do you spent on commodities offered by food discount retailers on
single purchase?
<£300
£300-400
£400-500
£500
10. In your view, which firm has the best discounted food retailer in UK?
Aldi
Asda
3
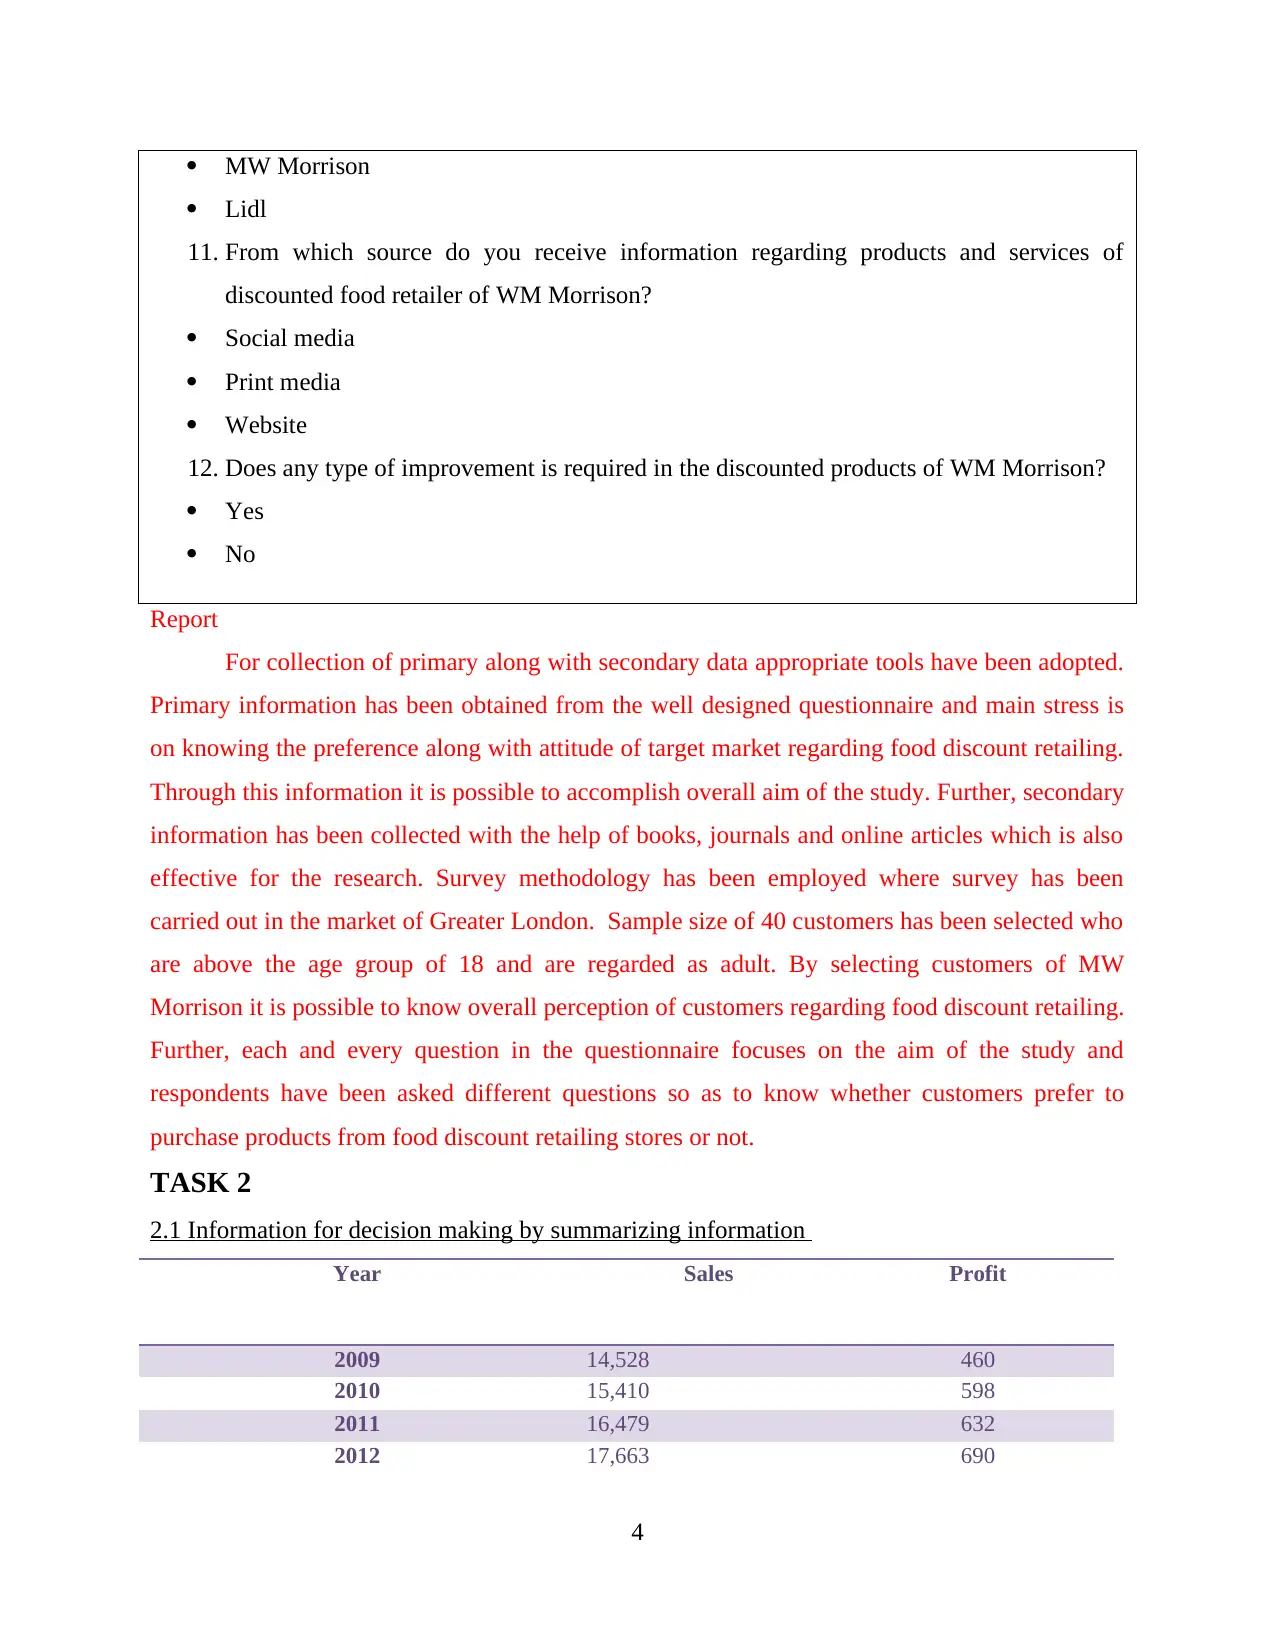
MW Morrison
Lidl
11. From which source do you receive information regarding products and services of
discounted food retailer of WM Morrison?
Social media
Print media
Website
12. Does any type of improvement is required in the discounted products of WM Morrison?
Yes
No
Report
For collection of primary along with secondary data appropriate tools have been adopted.
Primary information has been obtained from the well designed questionnaire and main stress is
on knowing the preference along with attitude of target market regarding food discount retailing.
Through this information it is possible to accomplish overall aim of the study. Further, secondary
information has been collected with the help of books, journals and online articles which is also
effective for the research. Survey methodology has been employed where survey has been
carried out in the market of Greater London. Sample size of 40 customers has been selected who
are above the age group of 18 and are regarded as adult. By selecting customers of MW
Morrison it is possible to know overall perception of customers regarding food discount retailing.
Further, each and every question in the questionnaire focuses on the aim of the study and
respondents have been asked different questions so as to know whether customers prefer to
purchase products from food discount retailing stores or not.
TASK 2
2.1 Information for decision making by summarizing information
Year Sales Profit
2009 14,528 460
2010 15,410 598
2011 16,479 632
2012 17,663 690
4
⊘ This is a preview!⊘
Do you want full access?
Subscribe today to unlock all pages.
Trusted by 1+ million students worldwide
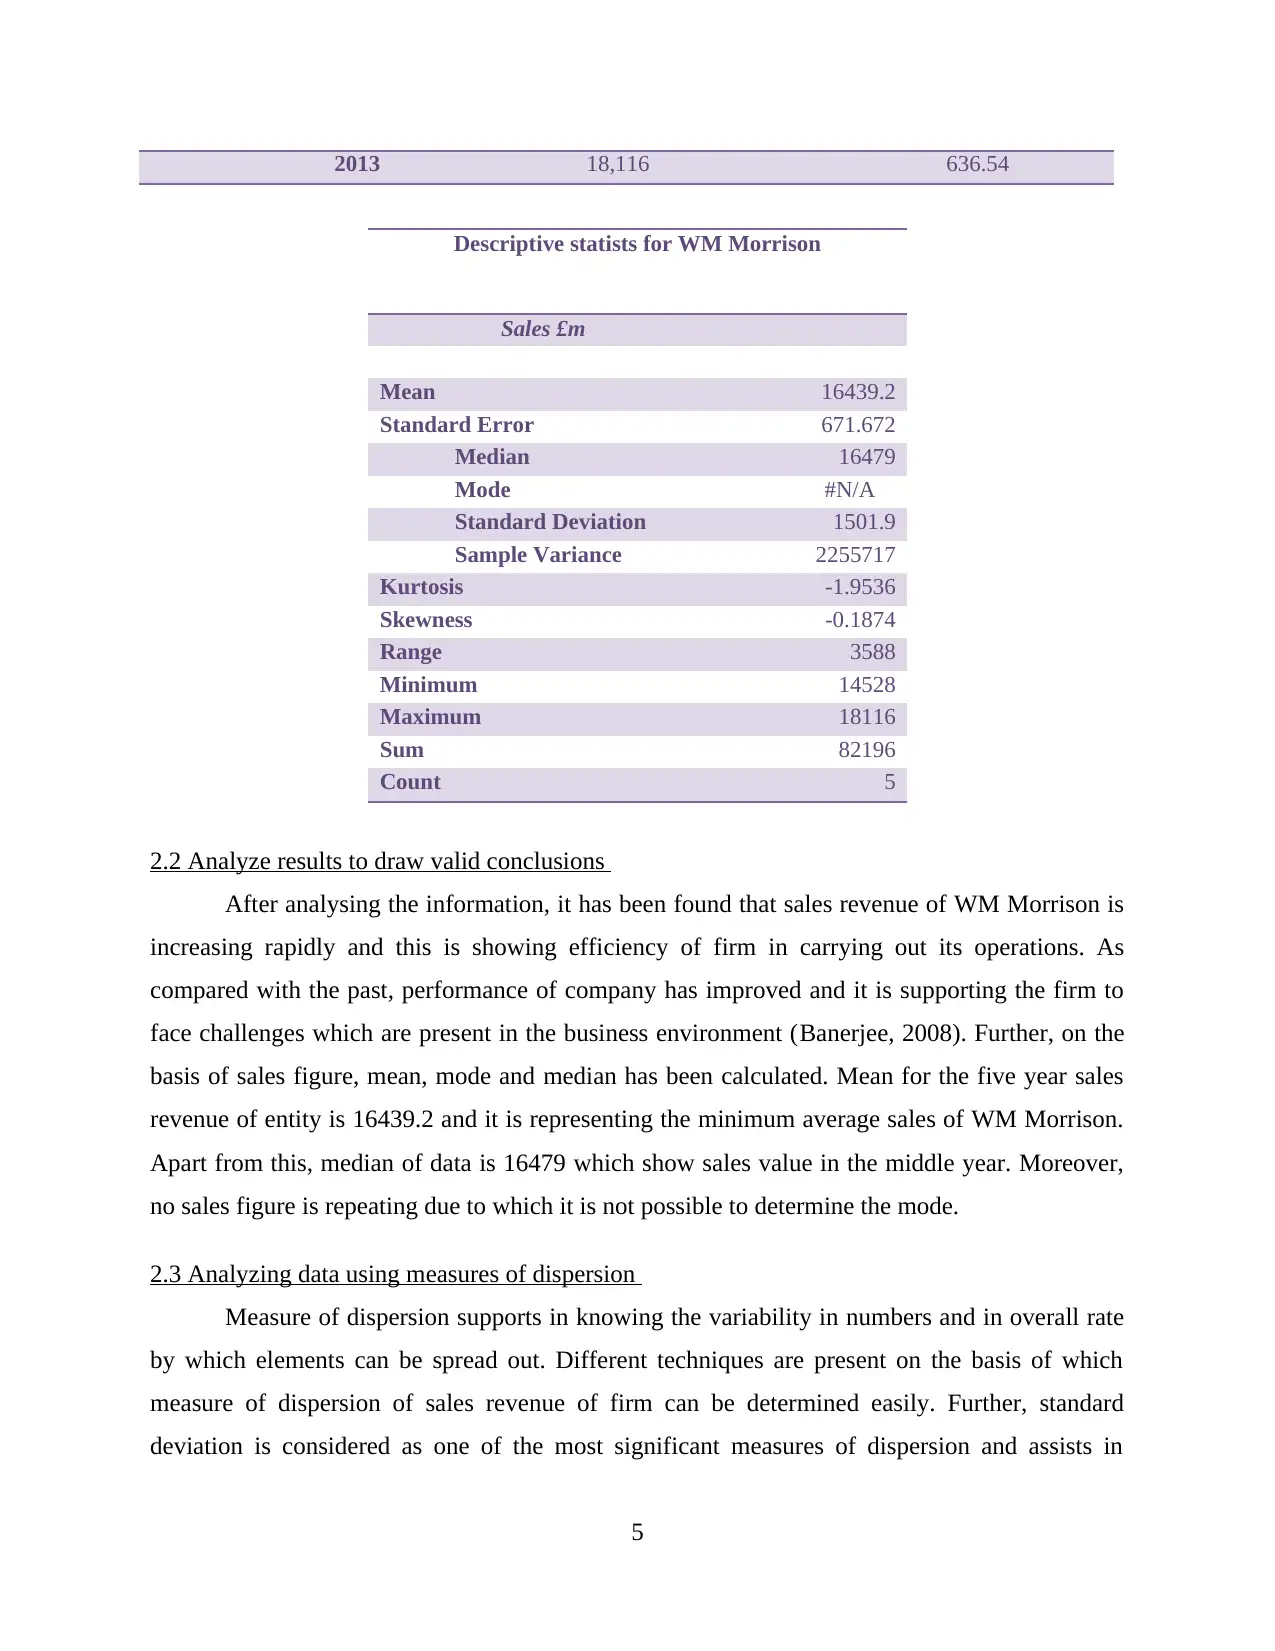
2013 18,116 636.54
Descriptive statists for WM Morrison
Sales £m
Mean 16439.2
Standard Error 671.672
Median 16479
Mode #N/A
Standard Deviation 1501.9
Sample Variance 2255717
Kurtosis -1.9536
Skewness -0.1874
Range 3588
Minimum 14528
Maximum 18116
Sum 82196
Count 5
2.2 Analyze results to draw valid conclusions
After analysing the information, it has been found that sales revenue of WM Morrison is
increasing rapidly and this is showing efficiency of firm in carrying out its operations. As
compared with the past, performance of company has improved and it is supporting the firm to
face challenges which are present in the business environment (Banerjee, 2008). Further, on the
basis of sales figure, mean, mode and median has been calculated. Mean for the five year sales
revenue of entity is 16439.2 and it is representing the minimum average sales of WM Morrison.
Apart from this, median of data is 16479 which show sales value in the middle year. Moreover,
no sales figure is repeating due to which it is not possible to determine the mode.
2.3 Analyzing data using measures of dispersion
Measure of dispersion supports in knowing the variability in numbers and in overall rate
by which elements can be spread out. Different techniques are present on the basis of which
measure of dispersion of sales revenue of firm can be determined easily. Further, standard
deviation is considered as one of the most significant measures of dispersion and assists in
5
Paraphrase This Document
Need a fresh take? Get an instant paraphrase of this document with our AI Paraphraser
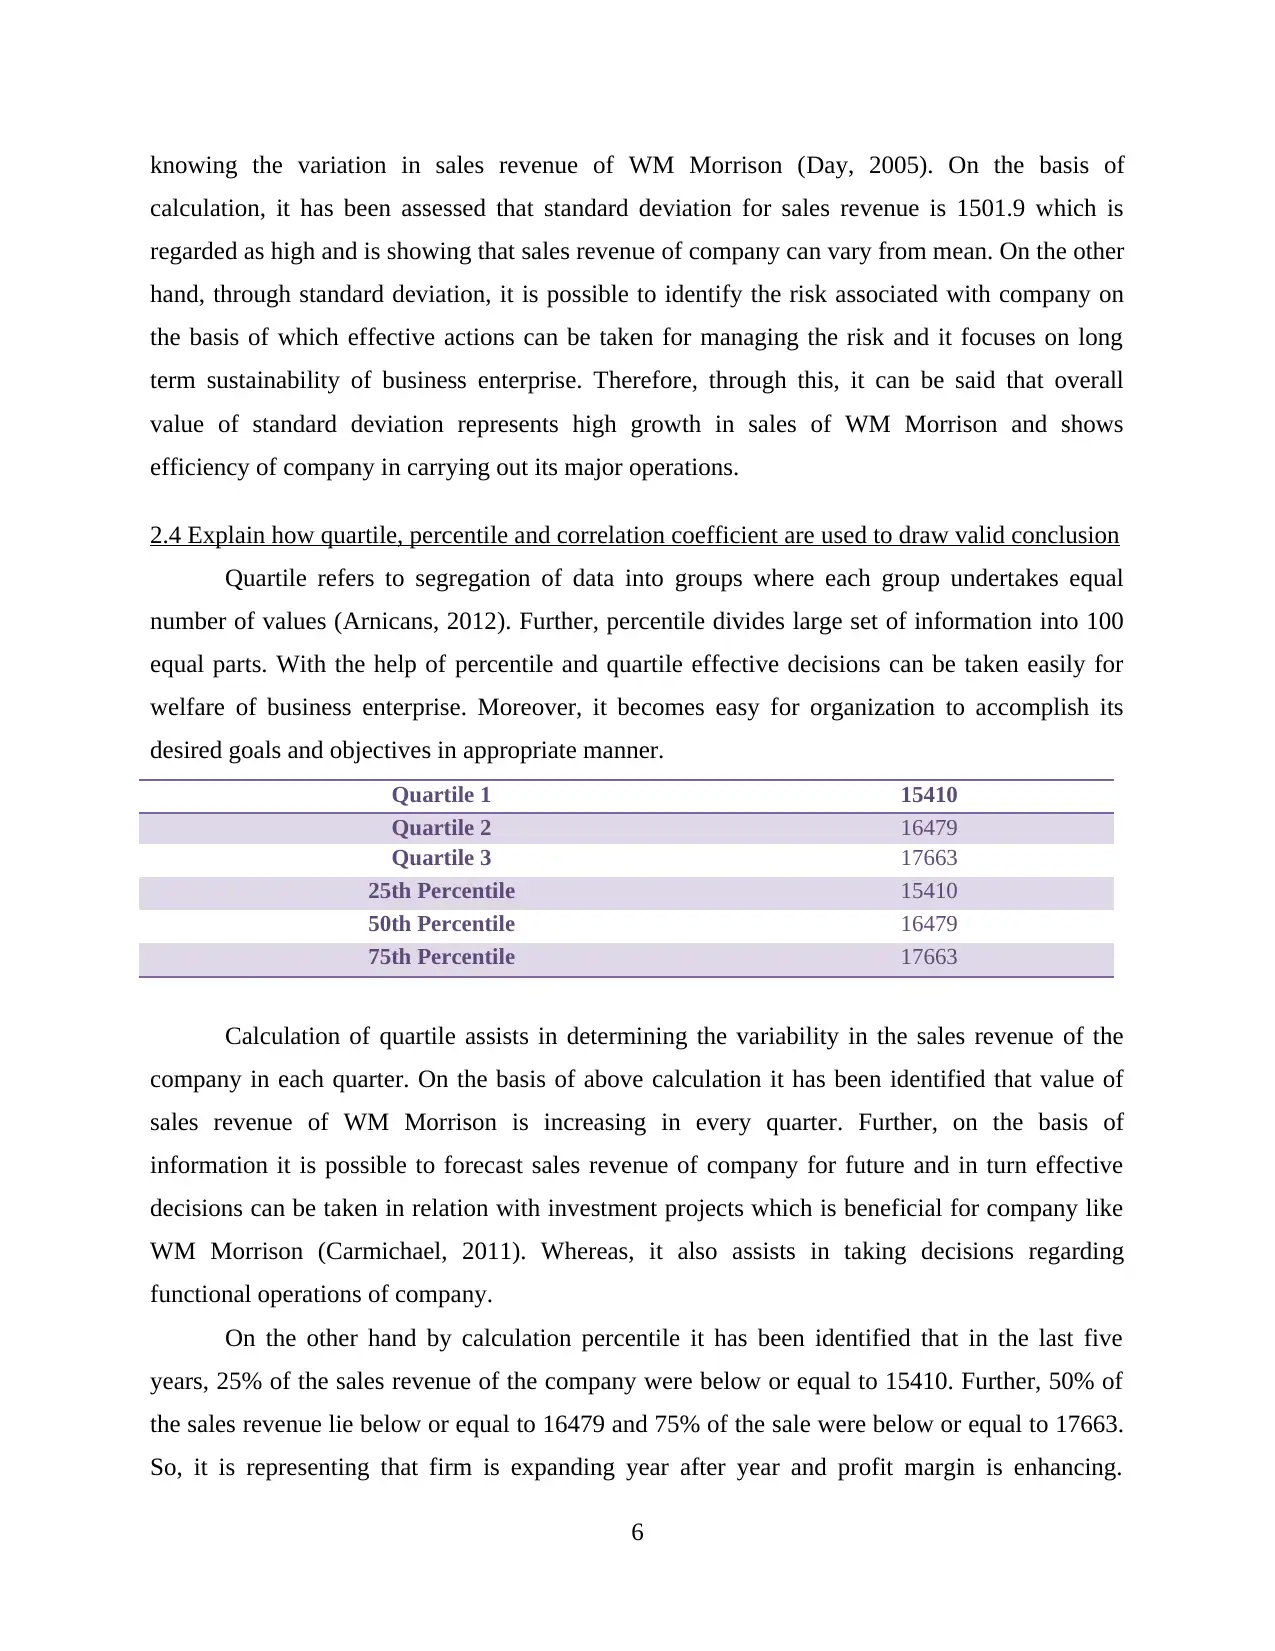
knowing the variation in sales revenue of WM Morrison (Day, 2005). On the basis of
calculation, it has been assessed that standard deviation for sales revenue is 1501.9 which is
regarded as high and is showing that sales revenue of company can vary from mean. On the other
hand, through standard deviation, it is possible to identify the risk associated with company on
the basis of which effective actions can be taken for managing the risk and it focuses on long
term sustainability of business enterprise. Therefore, through this, it can be said that overall
value of standard deviation represents high growth in sales of WM Morrison and shows
efficiency of company in carrying out its major operations.
2.4 Explain how quartile, percentile and correlation coefficient are used to draw valid conclusion
Quartile refers to segregation of data into groups where each group undertakes equal
number of values (Arnicans, 2012). Further, percentile divides large set of information into 100
equal parts. With the help of percentile and quartile effective decisions can be taken easily for
welfare of business enterprise. Moreover, it becomes easy for organization to accomplish its
desired goals and objectives in appropriate manner.
Quartile 1 15410
Quartile 2 16479
Quartile 3 17663
25th Percentile 15410
50th Percentile 16479
75th Percentile 17663
Calculation of quartile assists in determining the variability in the sales revenue of the
company in each quarter. On the basis of above calculation it has been identified that value of
sales revenue of WM Morrison is increasing in every quarter. Further, on the basis of
information it is possible to forecast sales revenue of company for future and in turn effective
decisions can be taken in relation with investment projects which is beneficial for company like
WM Morrison (Carmichael, 2011). Whereas, it also assists in taking decisions regarding
functional operations of company.
On the other hand by calculation percentile it has been identified that in the last five
years, 25% of the sales revenue of the company were below or equal to 15410. Further, 50% of
the sales revenue lie below or equal to 16479 and 75% of the sale were below or equal to 17663.
So, it is representing that firm is expanding year after year and profit margin is enhancing.
6
Percentile also assists in taking different type of strategic as well as management decisions of
firm (Cumulative Frequency, Quartiles and Percentiles, 2014).
Correlation coefficient
Correlation of coefficient assists in knowing the relationship between two or more
variables in a given set of information (Van, Kurth-Nelson and Redish, 2012). In order to
calculate correlation of coefficient researcher has acquired secondary information such as
profitability of WM Morrison and it has been determined for the sales and profitability
information of the organization.
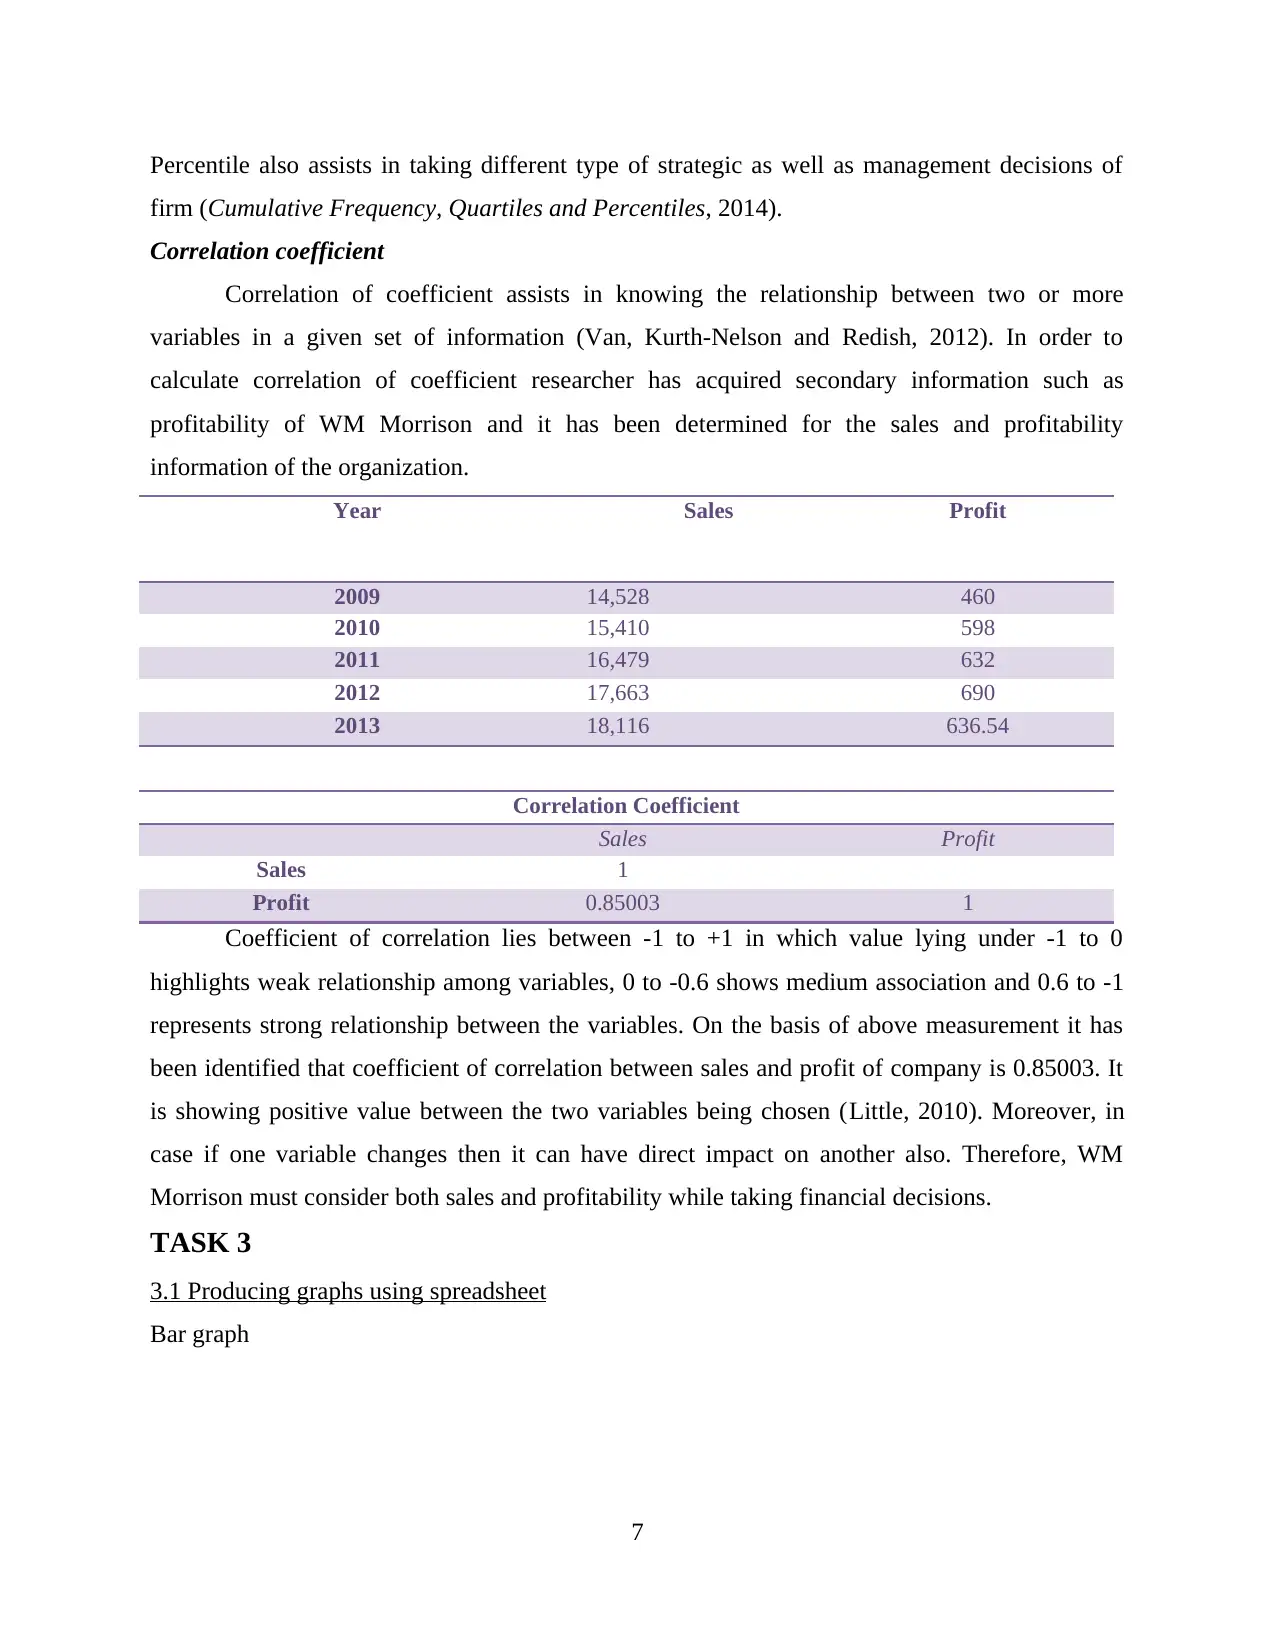
Year Sales Profit
2009 14,528 460
2010 15,410 598
2011 16,479 632
2012 17,663 690
2013 18,116 636.54
Correlation Coefficient
Sales Profit
Sales 1
Profit 0.85003 1
Coefficient of correlation lies between -1 to +1 in which value lying under -1 to 0
highlights weak relationship among variables, 0 to -0.6 shows medium association and 0.6 to -1
represents strong relationship between the variables. On the basis of above measurement it has
been identified that coefficient of correlation between sales and profit of company is 0.85003. It
is showing positive value between the two variables being chosen (Little, 2010). Moreover, in
case if one variable changes then it can have direct impact on another also. Therefore, WM
Morrison must consider both sales and profitability while taking financial decisions.
TASK 3
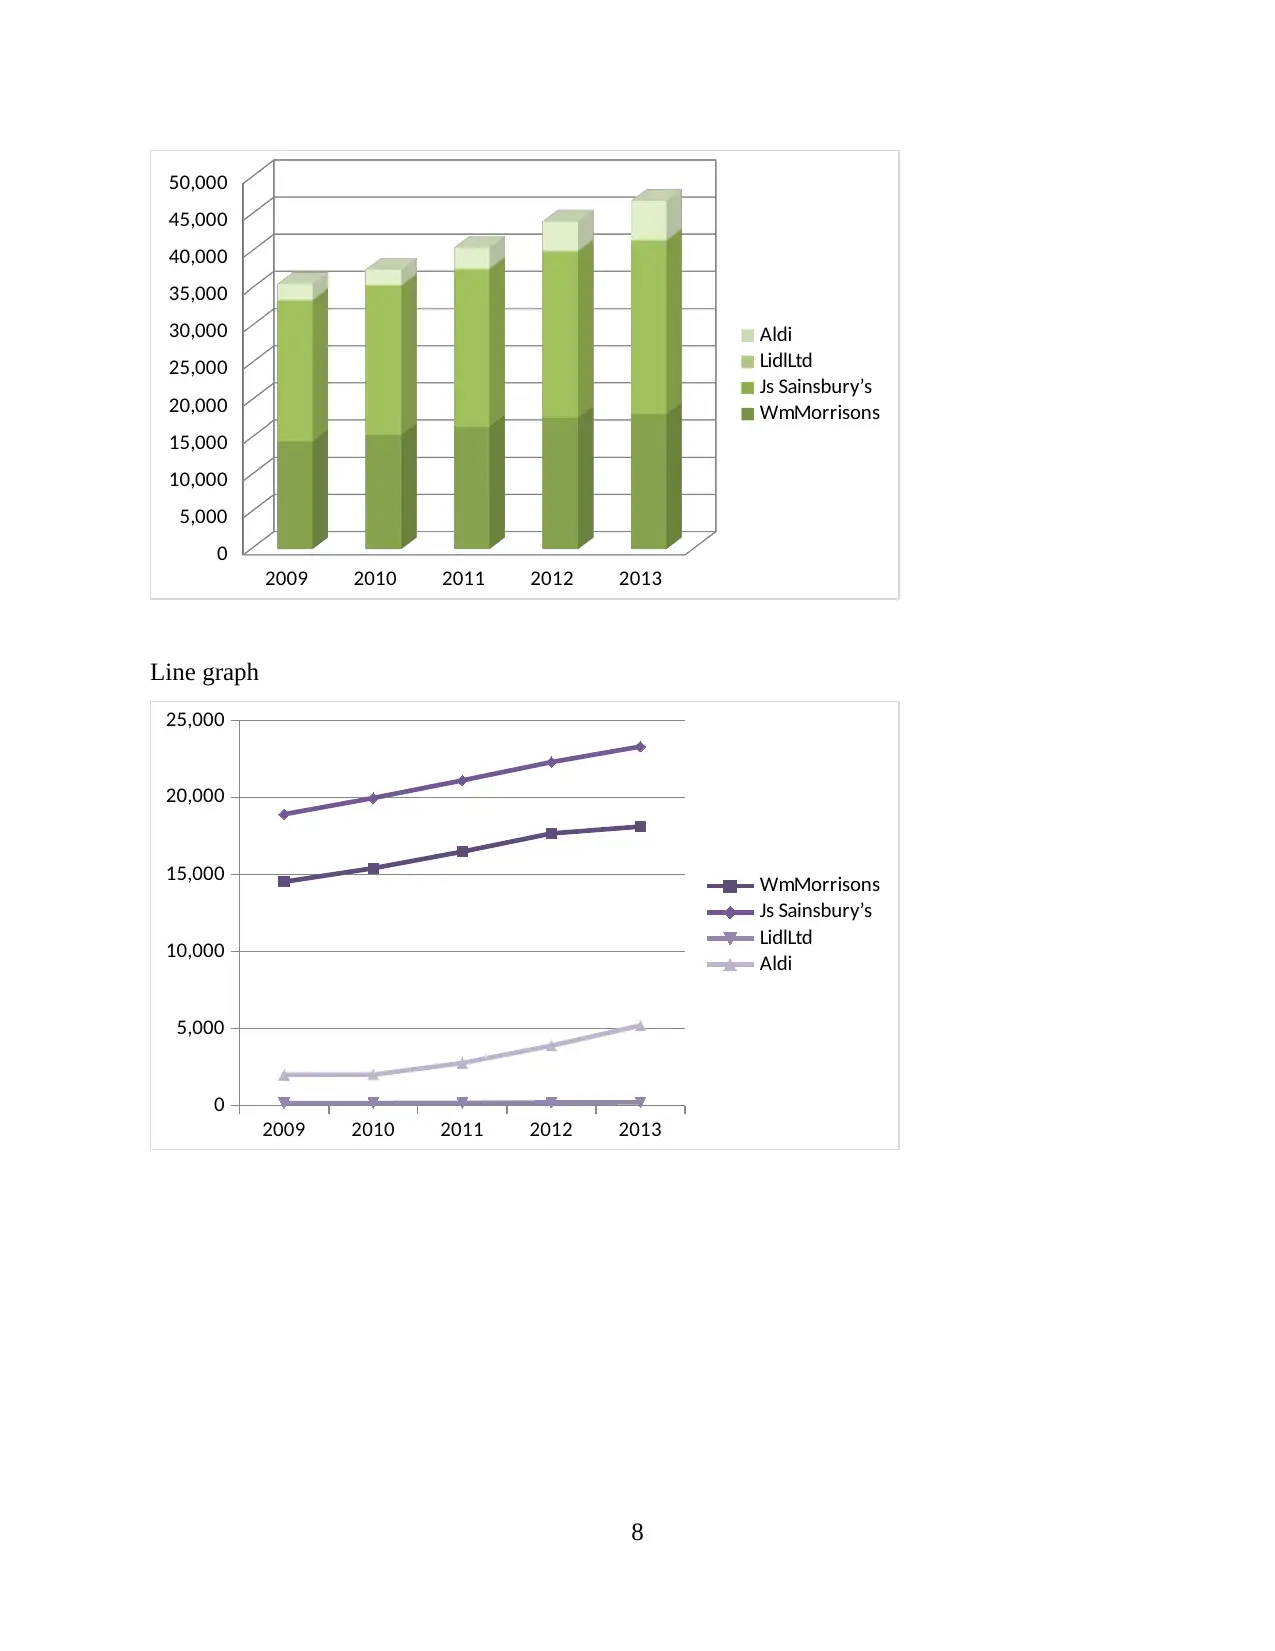
3.1 Producing graphs using spreadsheet
Bar graph
7
firm (Cumulative Frequency, Quartiles and Percentiles, 2014).
Correlation coefficient
Correlation of coefficient assists in knowing the relationship between two or more
variables in a given set of information (Van, Kurth-Nelson and Redish, 2012). In order to
calculate correlation of coefficient researcher has acquired secondary information such as
profitability of WM Morrison and it has been determined for the sales and profitability
information of the organization.
Year Sales Profit
2009 14,528 460
2010 15,410 598
2011 16,479 632
2012 17,663 690
2013 18,116 636.54
Correlation Coefficient
Sales Profit
Sales 1
Profit 0.85003 1
Coefficient of correlation lies between -1 to +1 in which value lying under -1 to 0
highlights weak relationship among variables, 0 to -0.6 shows medium association and 0.6 to -1
represents strong relationship between the variables. On the basis of above measurement it has
been identified that coefficient of correlation between sales and profit of company is 0.85003. It
is showing positive value between the two variables being chosen (Little, 2010). Moreover, in
case if one variable changes then it can have direct impact on another also. Therefore, WM
Morrison must consider both sales and profitability while taking financial decisions.
TASK 3
3.1 Producing graphs using spreadsheet
Bar graph
7
⊘ This is a preview!⊘
Do you want full access?
Subscribe today to unlock all pages.
Trusted by 1+ million students worldwide
2009 2010 2011 2012 2013
0
5,000
10,000
15,000
20,000
25,000
30,000
35,000
40,000
45,000
50,000
Aldi
LidlLtd
Js Sainsbury’s
WmMorrisons
Line graph
2009 2010 2011 2012 2013
0
5,000
10,000
15,000
20,000
25,000
WmMorrisons
Js Sainsbury’s
LidlLtd
Aldi
8
0
5,000
10,000
15,000
20,000
25,000
30,000
35,000
40,000
45,000
50,000
Aldi
LidlLtd
Js Sainsbury’s
WmMorrisons
Line graph
2009 2010 2011 2012 2013
0
5,000
10,000
15,000
20,000
25,000
WmMorrisons
Js Sainsbury’s
LidlLtd
Aldi
8
Paraphrase This Document
Need a fresh take? Get an instant paraphrase of this document with our AI Paraphraser
15410-16909 16910-18409
0
0.5
1
1.5
2
2.5
2 2
Morrisons
19964-21463 21464-22963 22964-24463
0
0.5
1
1.5
2
2.5
2
1 1
Sainsbury
9
0
0.5
1
1.5
2
2.5
2 2
Morrisons
19964-21463 21464-22963 22964-24463
0
0.5
1
1.5
2
2.5
2
1 1
Sainsbury
9
167.9-187.9 187.9-207.9 207.9-227.9
0
0.5
1
1.5
2
2.5
2
1 1
Lidl Ltd
1500-2499 2500-3499 3500-4499 4500-5499
0
0.2
0.4
0.6
0.8
1
1.2
1 1 1 1
Aldi
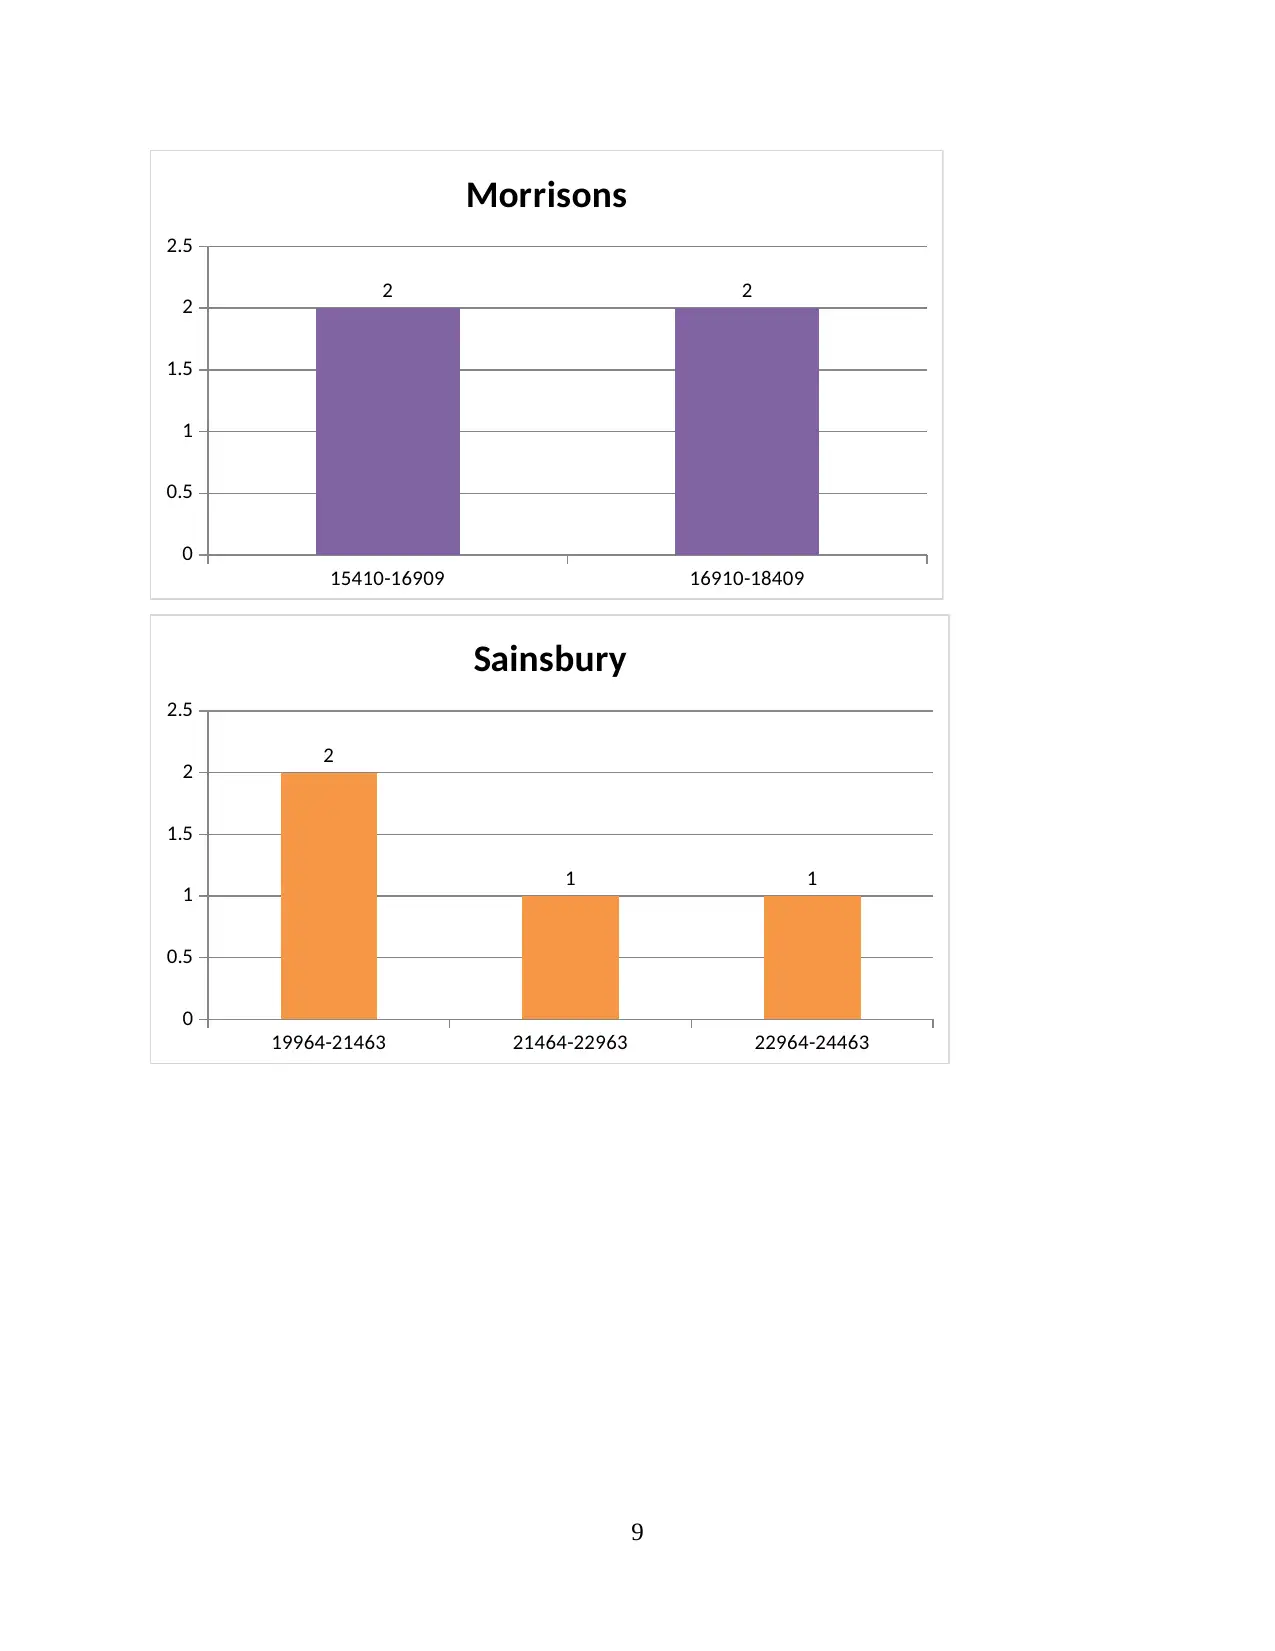
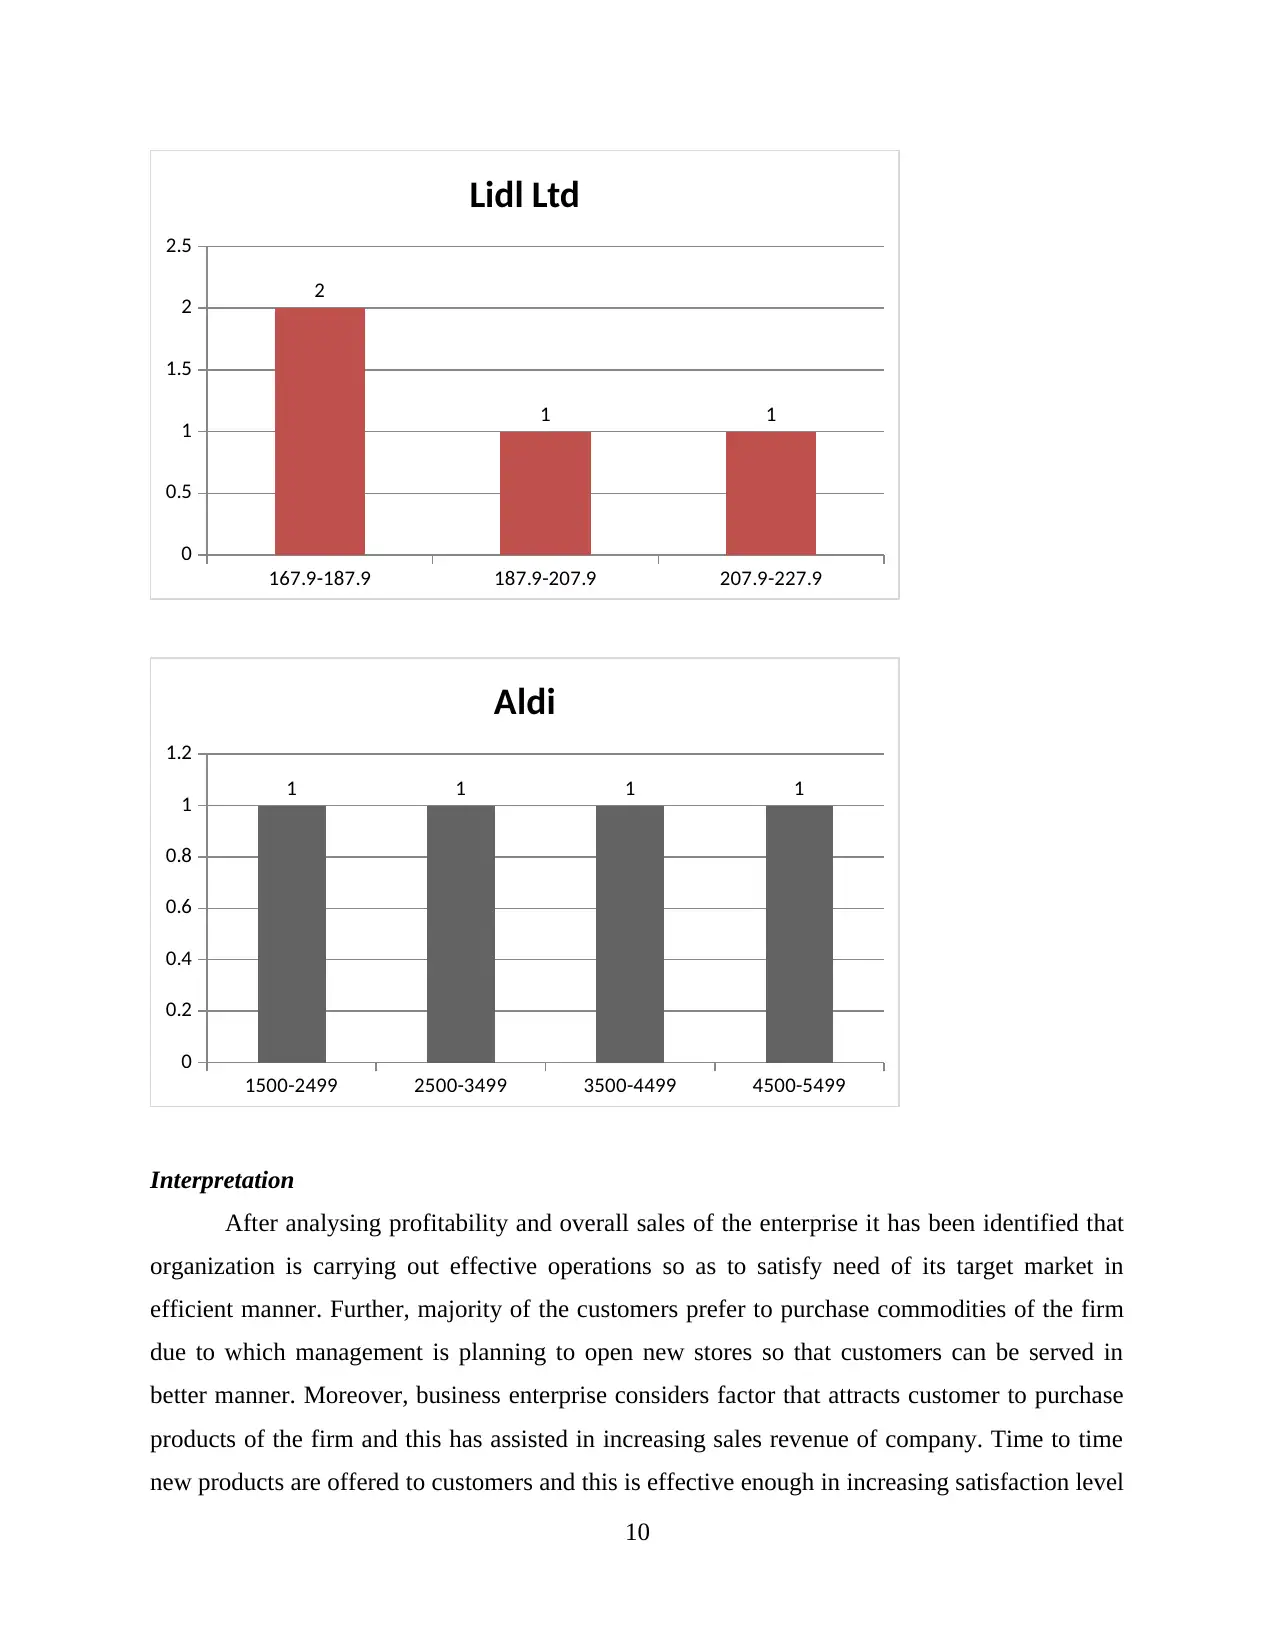
Interpretation
After analysing profitability and overall sales of the enterprise it has been identified that
organization is carrying out effective operations so as to satisfy need of its target market in
efficient manner. Further, majority of the customers prefer to purchase commodities of the firm
due to which management is planning to open new stores so that customers can be served in
better manner. Moreover, business enterprise considers factor that attracts customer to purchase
products of the firm and this has assisted in increasing sales revenue of company. Time to time
new products are offered to customers and this is effective enough in increasing satisfaction level
10
0
0.5
1
1.5
2
2.5
2
1 1
Lidl Ltd
1500-2499 2500-3499 3500-4499 4500-5499
0
0.2
0.4
0.6
0.8
1
1.2
1 1 1 1
Aldi
Interpretation
After analysing profitability and overall sales of the enterprise it has been identified that
organization is carrying out effective operations so as to satisfy need of its target market in
efficient manner. Further, majority of the customers prefer to purchase commodities of the firm
due to which management is planning to open new stores so that customers can be served in
better manner. Moreover, business enterprise considers factor that attracts customer to purchase
products of the firm and this has assisted in increasing sales revenue of company. Time to time
new products are offered to customers and this is effective enough in increasing satisfaction level
10
⊘ This is a preview!⊘
Do you want full access?
Subscribe today to unlock all pages.
Trusted by 1+ million students worldwide
1 out of 19
Related Documents


Your All-in-One AI-Powered Toolkit for Academic Success.
+13062052269
info@desklib.com
Available 24*7 on WhatsApp / Email
![[object Object]](/_next/static/media/star-bottom.7253800d.svg)
Unlock your academic potential
Copyright © 2020–2026 A2Z Services. All Rights Reserved. Developed and managed by ZUCOL.