Business Decision Making Report: Blackfriars Restaurant Analysis
VerifiedAdded on 2020/02/12
|20
|4759
|29
Report
AI Summary
This report provides a comprehensive analysis of the business decision-making process at Blackfriars Restaurant, focusing on its expansion strategy. It begins with an introduction to business decision-making and then delves into Task 1, which covers primary and secondary data, survey methodology, and questionnaire design for the restaurant. Task 2 explores data summarization using representative values, analysis of results, dispersion measures, and the application of quartiles, percentiles, and correlation coefficients. Task 3 focuses on data visualization using spreadsheets, trend line creation, presentation preparation, and formal report writing. Finally, Task 4 discusses information processing tools, project planning, and financial tools for decision-making. The report concludes with a summary of the findings and references.
Business Decision Making
Paraphrase This Document
Need a fresh take? Get an instant paraphrase of this document with our AI Paraphraser
Table of Contents
INTRODUCTION...........................................................................................................................4
TASK 1............................................................................................................................................5
1.1 Primary and secondary data of Blackfriars Restaurant.........................................................5
1.2 Present the survey methodology and sampling frame used..................................................6
1.3 Design a questionnaire for a given business problem...........................................................6
TASK 2............................................................................................................................................8
2.1 Create information for decision making by summarising data using representative values8
2.2Analyse the results to draw valid conclusions in a business context.....................................8
2.3 Analyse data using measures of dispersion to inform a given business scenario.................9
2.4 Explain how quartiles, percentiles and the correlation coefficient are used to draw useful
conclusions in a business context..............................................................................................10
TASK 3..........................................................................................................................................10
3.1 Produce graphs using Spreadsheets and draw valid conclusions based on the information
derived.......................................................................................................................................10
3.2 Create trend lines in spreadsheet graphs to assist in forecasting for specified business
information................................................................................................................................12
3.3 Prepare a business presentation using suitable software and techniques to disseminate
information effectively..............................................................................................................13
3.4 Produce a formal business report........................................................................................14
TASK 4..........................................................................................................................................15
4.1 Use appropriate information processing tools.....................................................................15
4.2 Prepare a project plan for an activity and determine the critical path ................................15
4.3 Use financial tools for decision making..............................................................................16
CONCLUSION..............................................................................................................................16
REFERENCES..............................................................................................................................17
INTRODUCTION
Business decision making refers to the effective strategies to be implemented to achieve
the ultimate goals of the entity and sustain in the long run. These strategies can be the effective
solutions to the challenges faced by the organisation or the expansion to grab the current
opportunities available in the market. The present report includes the detail scenario of the
information available to the business entity Blackfriars Restaurant which can be classified
into primary and secondary data. Primary data here means the data available within the
organisation through the R&D department who are continuously indulge in the collecting and
storing data so that it can be used in future adequately (Brown and et.al ., 2010). Moreover it also
signifies the IT soft wares and spreadsheets of data analysis so that the business entity could
easily used these information systems in future to enhance its productivity at all levels.
TASK 1
1.1 Primary and secondary data of Blackfriars Restaurant
Primary data:
Primary data collecting the process and creating the data. Data collection is input process
of company. This data is original data of company. This data identify the company profile.
Secondary data
Secondary data may be defined as the company's employees record . This data mentioned
in the record book like journal book or employee register.
Sources of primary and secondary data
There are two sources of primary and secondary data-internal sources and external
sources. Basically primary data use external sources like journal book paper etc. and secondary
data use internal sources like rate of cost ,customer satisfaction, market research (Brynjolfsson,
Hitt and Kim, 2011).
Planing of primary and secondary data for restaurant
⊘ This is a preview!⊘
Do you want full access?
Subscribe today to unlock all pages.
Trusted by 1+ million students worldwide
Primary data- black friars restaurant provide the veg. and non veg-food. This data
record the how many people prefer vegetarian food and non vegetarian food .
Secondary data -This data mentioned number of customers like veg and non veg food
and register employee salary. This data record the employee information.
1.2 Present the survey methodology and sampling frame used
Blackfriars Restaurant is planning to open its new restaurant chain in London, thus to
ensure the feasibility of his decision the owner is planning to collect the data from different
sources to understand the customers preferences, taste, habits, lifestyles and the location that is
viable to open the new venture. Stakeholders of the entity are keen to know the surveys made
and sampling frame used for the same. Sampling frame is the methodology that gives the brief
criteria of the market in less time rather than the detail questionnaire with the large population
which is expensive too (Elango and et.al., 2010 ). Person to person interaction is time consuming
thus sampling methodology have developed which is not too effective. Thus, Blackfriars
Restaurant have decided to conduct the quality assurance programmes that develop the specialise
attributes in all the employees rather than entire population survey like government surveys.
Sampling frame is the effective tool to have online surveys to gain information regarding
the clients and customers preferences to penetrate into the new market in London. Blackfriars
Restaurant is using the online surveys to understand the demographic, cultural, social and
economical aspects of the community to understand the habits, taste, lifestyle of the population
there. But this method too have some limitations that this process could even be biased (Ford and
Richardson, 2013).
1.3 Design a questionnaire for a given business problem
The questionnaire is the another tool to understand the market conditions to take effective
steps to resolve such problems and penetrate into the new market easily. Blackfriars Restaurant
R&D manger has decided to use the questionnaire tool to understand the new market in London.
Restaurant Questionnaire
Blackfriars Restaurant , British cuisine at Friars St. Newcastle in London meant for his
high quality food and beautiful wooden décor with pleasant environment. This questionnaire has
Paraphrase This Document
Need a fresh take? Get an instant paraphrase of this document with our AI Paraphraser
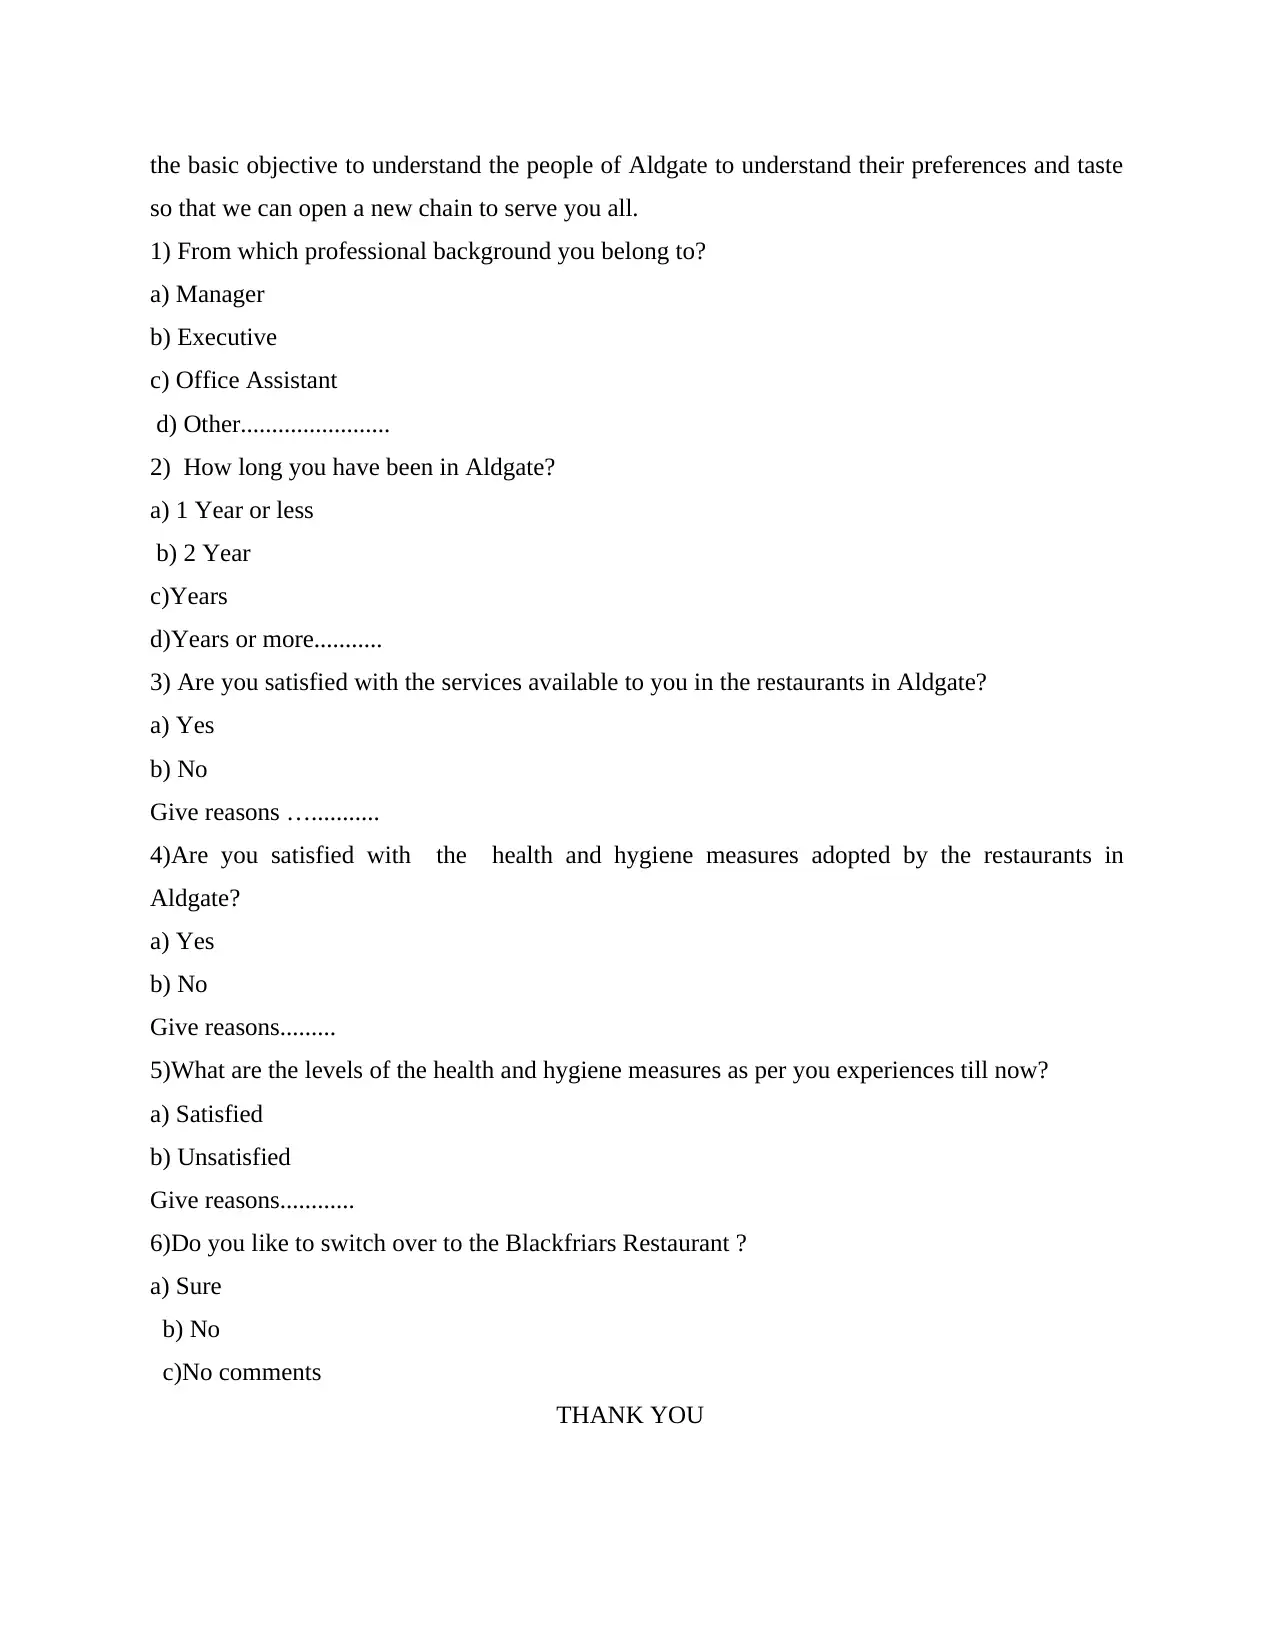
the basic objective to understand the people of Aldgate to understand their preferences and taste
so that we can open a new chain to serve you all.
1) From which professional background you belong to?
a) Manager
b) Executive
c) Office Assistant
d) Other........................
2) How long you have been in Aldgate?
a) 1 Year or less
b) 2 Year
c)Years
d)Years or more...........
3) Are you satisfied with the services available to you in the restaurants in Aldgate?
a) Yes
b) No
Give reasons …...........
4)Are you satisfied with the health and hygiene measures adopted by the restaurants in
Aldgate?
a) Yes
b) No
Give reasons.........
5)What are the levels of the health and hygiene measures as per you experiences till now?
a) Satisfied
b) Unsatisfied
Give reasons............
6)Do you like to switch over to the Blackfriars Restaurant ?
a) Sure
b) No
c)No comments
THANK YOU
Blackfriars Restaurant , British cuisine at Friars St. Newcastle in London
Manager: XYZ
TASK 2
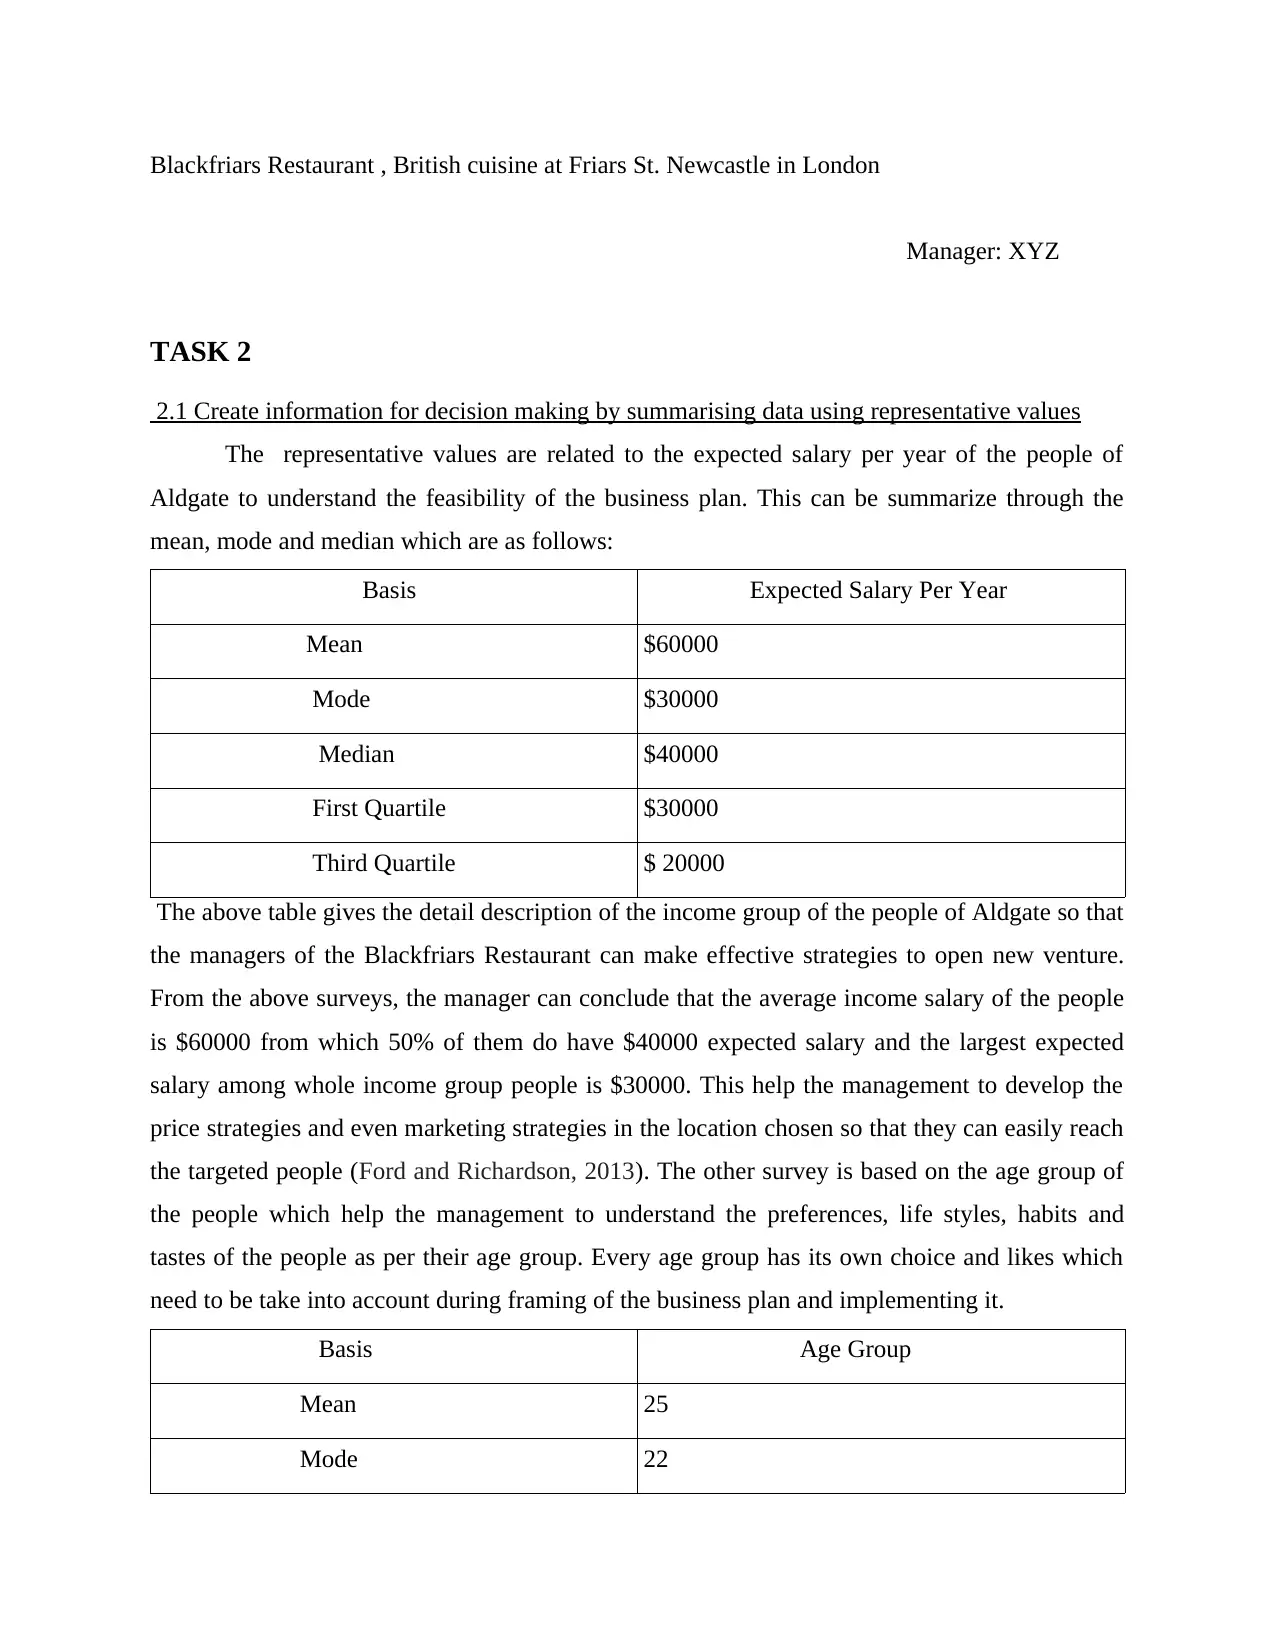
2.1 Create information for decision making by summarising data using representative values
The representative values are related to the expected salary per year of the people of
Aldgate to understand the feasibility of the business plan. This can be summarize through the
mean, mode and median which are as follows:
Basis Expected Salary Per Year
Mean $60000
Mode $30000
Median $40000
First Quartile $30000
Third Quartile $ 20000
The above table gives the detail description of the income group of the people of Aldgate so that
the managers of the Blackfriars Restaurant can make effective strategies to open new venture.
From the above surveys, the manager can conclude that the average income salary of the people
is $60000 from which 50% of them do have $40000 expected salary and the largest expected
salary among whole income group people is $30000. This help the management to develop the
price strategies and even marketing strategies in the location chosen so that they can easily reach
the targeted people (Ford and Richardson, 2013). The other survey is based on the age group of
the people which help the management to understand the preferences, life styles, habits and
tastes of the people as per their age group. Every age group has its own choice and likes which
need to be take into account during framing of the business plan and implementing it.
Basis Age Group
Mean 25
Mode 22
Manager: XYZ
TASK 2
2.1 Create information for decision making by summarising data using representative values
The representative values are related to the expected salary per year of the people of
Aldgate to understand the feasibility of the business plan. This can be summarize through the
mean, mode and median which are as follows:
Basis Expected Salary Per Year
Mean $60000
Mode $30000
Median $40000
First Quartile $30000
Third Quartile $ 20000
The above table gives the detail description of the income group of the people of Aldgate so that
the managers of the Blackfriars Restaurant can make effective strategies to open new venture.
From the above surveys, the manager can conclude that the average income salary of the people
is $60000 from which 50% of them do have $40000 expected salary and the largest expected
salary among whole income group people is $30000. This help the management to develop the
price strategies and even marketing strategies in the location chosen so that they can easily reach
the targeted people (Ford and Richardson, 2013). The other survey is based on the age group of
the people which help the management to understand the preferences, life styles, habits and
tastes of the people as per their age group. Every age group has its own choice and likes which
need to be take into account during framing of the business plan and implementing it.
Basis Age Group
Mean 25
Mode 22
⊘ This is a preview!⊘
Do you want full access?
Subscribe today to unlock all pages.
Trusted by 1+ million students worldwide
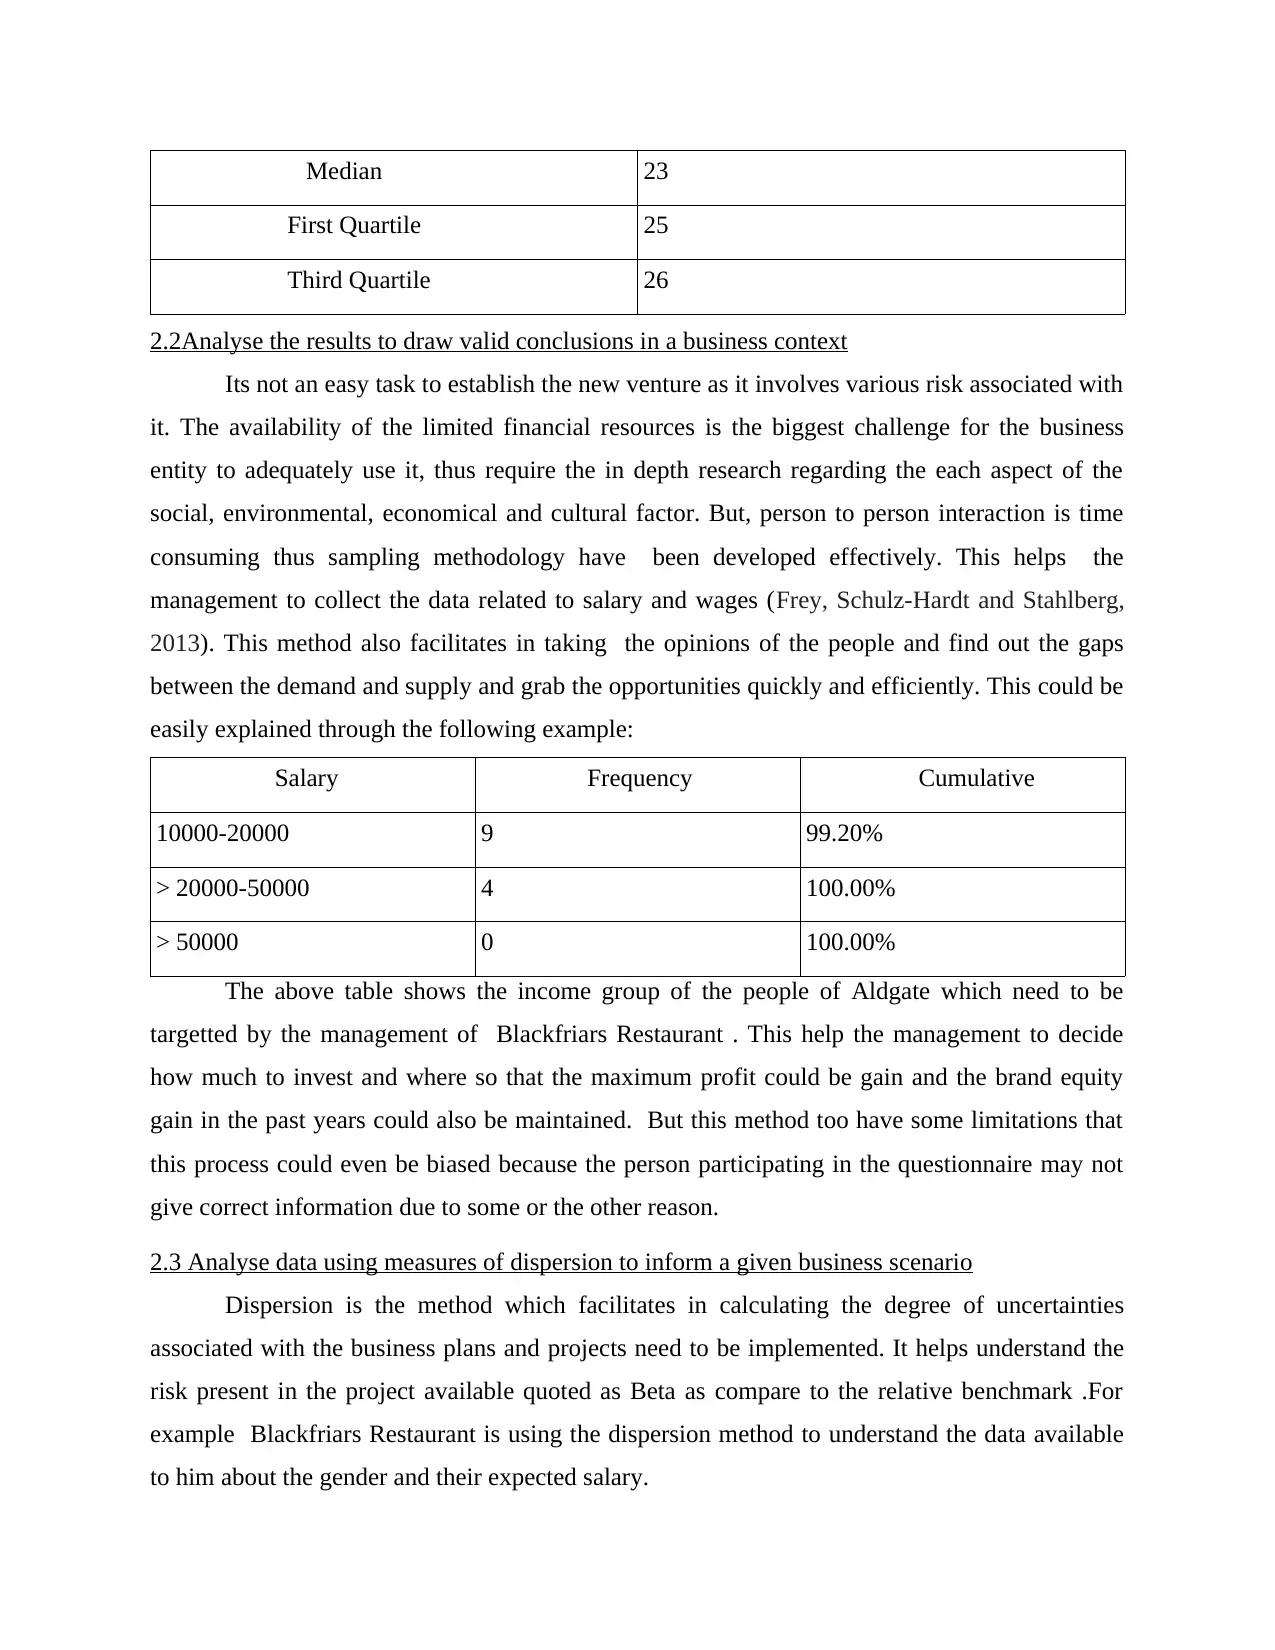
Median 23
First Quartile 25
Third Quartile 26
2.2Analyse the results to draw valid conclusions in a business context
Its not an easy task to establish the new venture as it involves various risk associated with
it. The availability of the limited financial resources is the biggest challenge for the business
entity to adequately use it, thus require the in depth research regarding the each aspect of the
social, environmental, economical and cultural factor. But, person to person interaction is time
consuming thus sampling methodology have been developed effectively. This helps the
management to collect the data related to salary and wages (Frey, Schulz-Hardt and Stahlberg,
2013). This method also facilitates in taking the opinions of the people and find out the gaps
between the demand and supply and grab the opportunities quickly and efficiently. This could be
easily explained through the following example:
Salary Frequency Cumulative
10000-20000 9 99.20%
> 20000-50000 4 100.00%
> 50000 0 100.00%
The above table shows the income group of the people of Aldgate which need to be
targetted by the management of Blackfriars Restaurant . This help the management to decide
how much to invest and where so that the maximum profit could be gain and the brand equity
gain in the past years could also be maintained. But this method too have some limitations that
this process could even be biased because the person participating in the questionnaire may not
give correct information due to some or the other reason.
2.3 Analyse data using measures of dispersion to inform a given business scenario
Dispersion is the method which facilitates in calculating the degree of uncertainties
associated with the business plans and projects need to be implemented. It helps understand the
risk present in the project available quoted as Beta as compare to the relative benchmark .For
example Blackfriars Restaurant is using the dispersion method to understand the data available
to him about the gender and their expected salary.
Paraphrase This Document
Need a fresh take? Get an instant paraphrase of this document with our AI Paraphraser
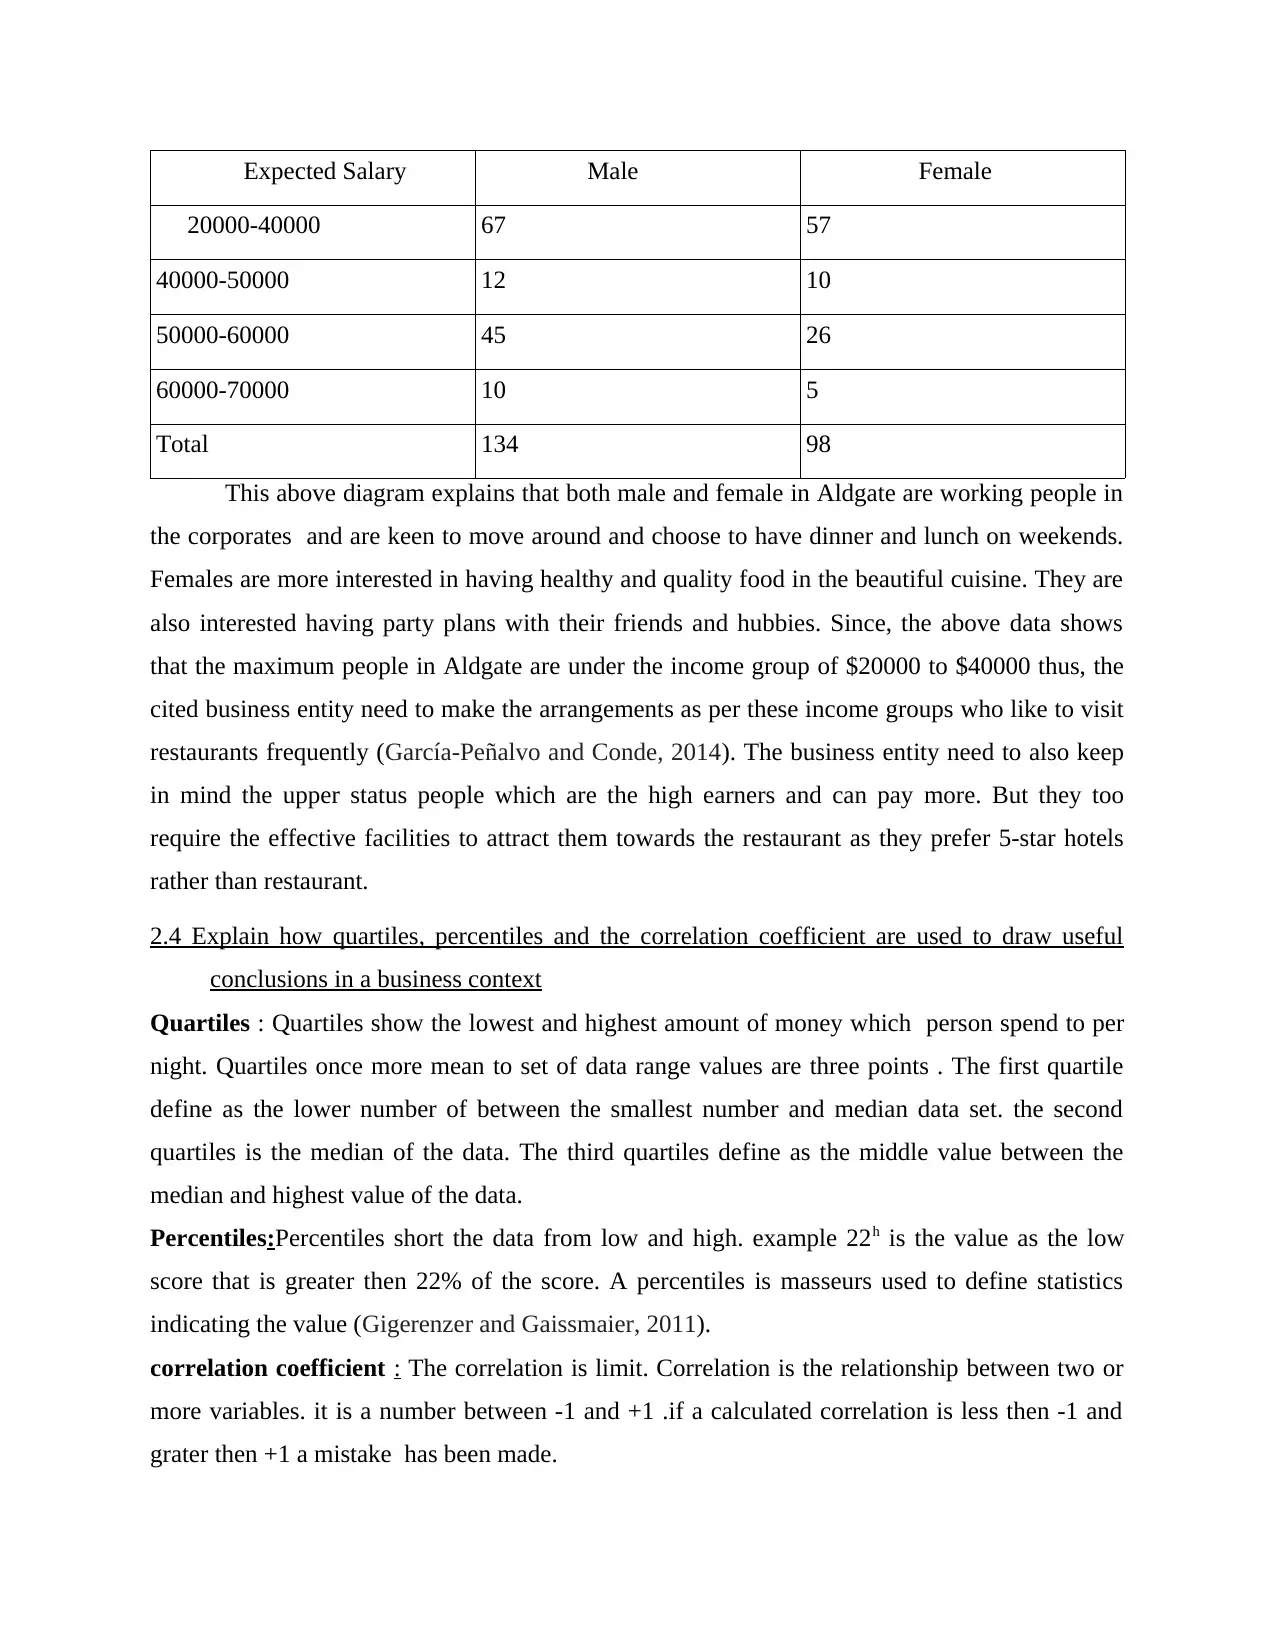
Expected Salary Male Female
20000-40000 67 57
40000-50000 12 10
50000-60000 45 26
60000-70000 10 5
Total 134 98
This above diagram explains that both male and female in Aldgate are working people in
the corporates and are keen to move around and choose to have dinner and lunch on weekends.
Females are more interested in having healthy and quality food in the beautiful cuisine. They are
also interested having party plans with their friends and hubbies. Since, the above data shows
that the maximum people in Aldgate are under the income group of $20000 to $40000 thus, the
cited business entity need to make the arrangements as per these income groups who like to visit
restaurants frequently (García-Peñalvo and Conde, 2014). The business entity need to also keep
in mind the upper status people which are the high earners and can pay more. But they too
require the effective facilities to attract them towards the restaurant as they prefer 5-star hotels
rather than restaurant.
2.4 Explain how quartiles, percentiles and the correlation coefficient are used to draw useful
conclusions in a business context
Quartiles : Quartiles show the lowest and highest amount of money which person spend to per
night. Quartiles once more mean to set of data range values are three points . The first quartile
define as the lower number of between the smallest number and median data set. the second
quartiles is the median of the data. The third quartiles define as the middle value between the
median and highest value of the data.
Percentiles:Percentiles short the data from low and high. example 22h is the value as the low
score that is greater then 22% of the score. A percentiles is masseurs used to define statistics
indicating the value (Gigerenzer and Gaissmaier, 2011).
correlation coefficient : The correlation is limit. Correlation is the relationship between two or
more variables. it is a number between -1 and +1 .if a calculated correlation is less then -1 and
grater then +1 a mistake has been made.
TASK 3
3.1 Produce graphs using Spreadsheets and draw valid conclusions based on the information
derived
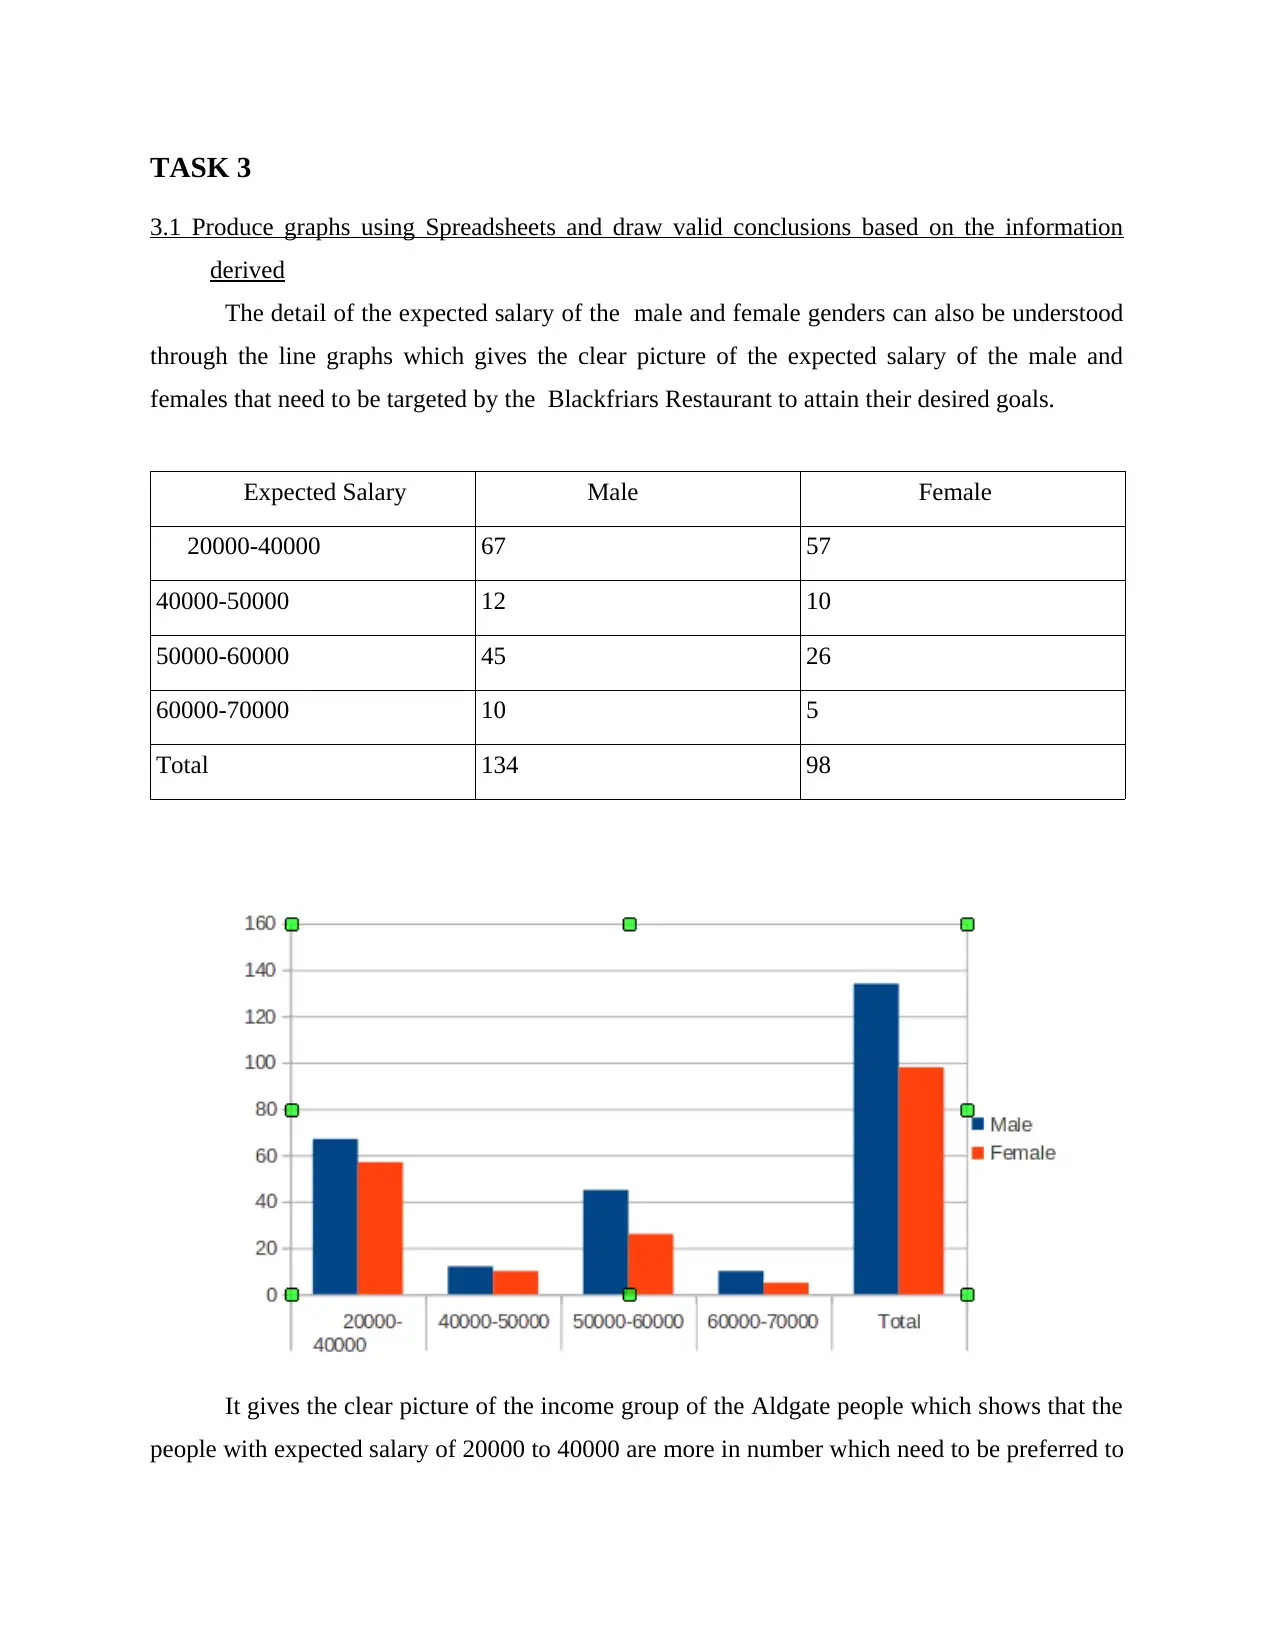
The detail of the expected salary of the male and female genders can also be understood
through the line graphs which gives the clear picture of the expected salary of the male and
females that need to be targeted by the Blackfriars Restaurant to attain their desired goals.
Expected Salary Male Female
20000-40000 67 57
40000-50000 12 10
50000-60000 45 26
60000-70000 10 5
Total 134 98
It gives the clear picture of the income group of the Aldgate people which shows that the
people with expected salary of 20000 to 40000 are more in number which need to be preferred to
3.1 Produce graphs using Spreadsheets and draw valid conclusions based on the information
derived
The detail of the expected salary of the male and female genders can also be understood
through the line graphs which gives the clear picture of the expected salary of the male and
females that need to be targeted by the Blackfriars Restaurant to attain their desired goals.
Expected Salary Male Female
20000-40000 67 57
40000-50000 12 10
50000-60000 45 26
60000-70000 10 5
Total 134 98
It gives the clear picture of the income group of the Aldgate people which shows that the
people with expected salary of 20000 to 40000 are more in number which need to be preferred to
⊘ This is a preview!⊘
Do you want full access?
Subscribe today to unlock all pages.
Trusted by 1+ million students worldwide
sustain in the competitive market and thus their tastes, likes and lifestyles are also be deeply
studied to make the effective arrangements as per their choice.
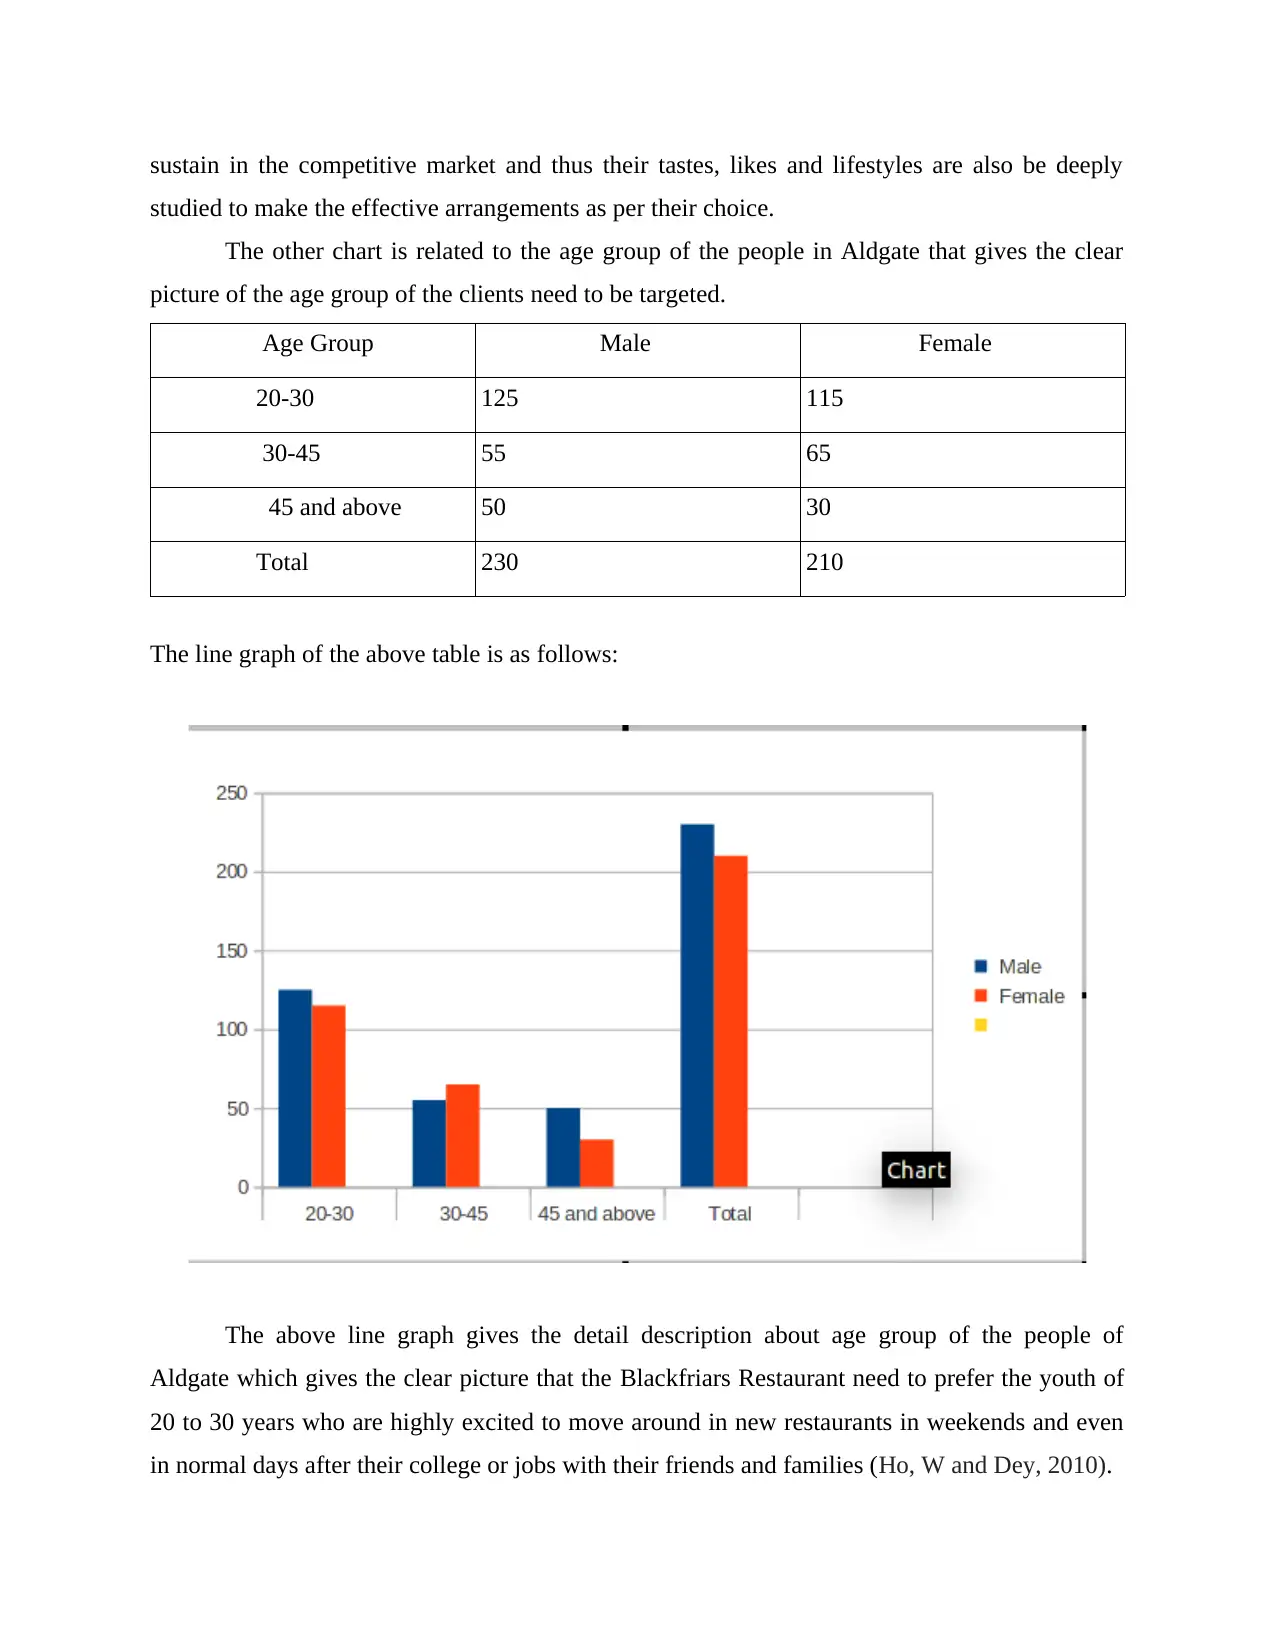
The other chart is related to the age group of the people in Aldgate that gives the clear
picture of the age group of the clients need to be targeted.
Age Group Male Female
20-30 125 115
30-45 55 65
45 and above 50 30
Total 230 210
The line graph of the above table is as follows:
The above line graph gives the detail description about age group of the people of
Aldgate which gives the clear picture that the Blackfriars Restaurant need to prefer the youth of
20 to 30 years who are highly excited to move around in new restaurants in weekends and even
in normal days after their college or jobs with their friends and families (Ho, W and Dey, 2010).
studied to make the effective arrangements as per their choice.
The other chart is related to the age group of the people in Aldgate that gives the clear
picture of the age group of the clients need to be targeted.
Age Group Male Female
20-30 125 115
30-45 55 65
45 and above 50 30
Total 230 210
The line graph of the above table is as follows:
The above line graph gives the detail description about age group of the people of
Aldgate which gives the clear picture that the Blackfriars Restaurant need to prefer the youth of
20 to 30 years who are highly excited to move around in new restaurants in weekends and even
in normal days after their college or jobs with their friends and families (Ho, W and Dey, 2010).
Paraphrase This Document
Need a fresh take? Get an instant paraphrase of this document with our AI Paraphraser
3.2 Create trend lines in spreadsheet graphs to assist in forecasting for specified business
information
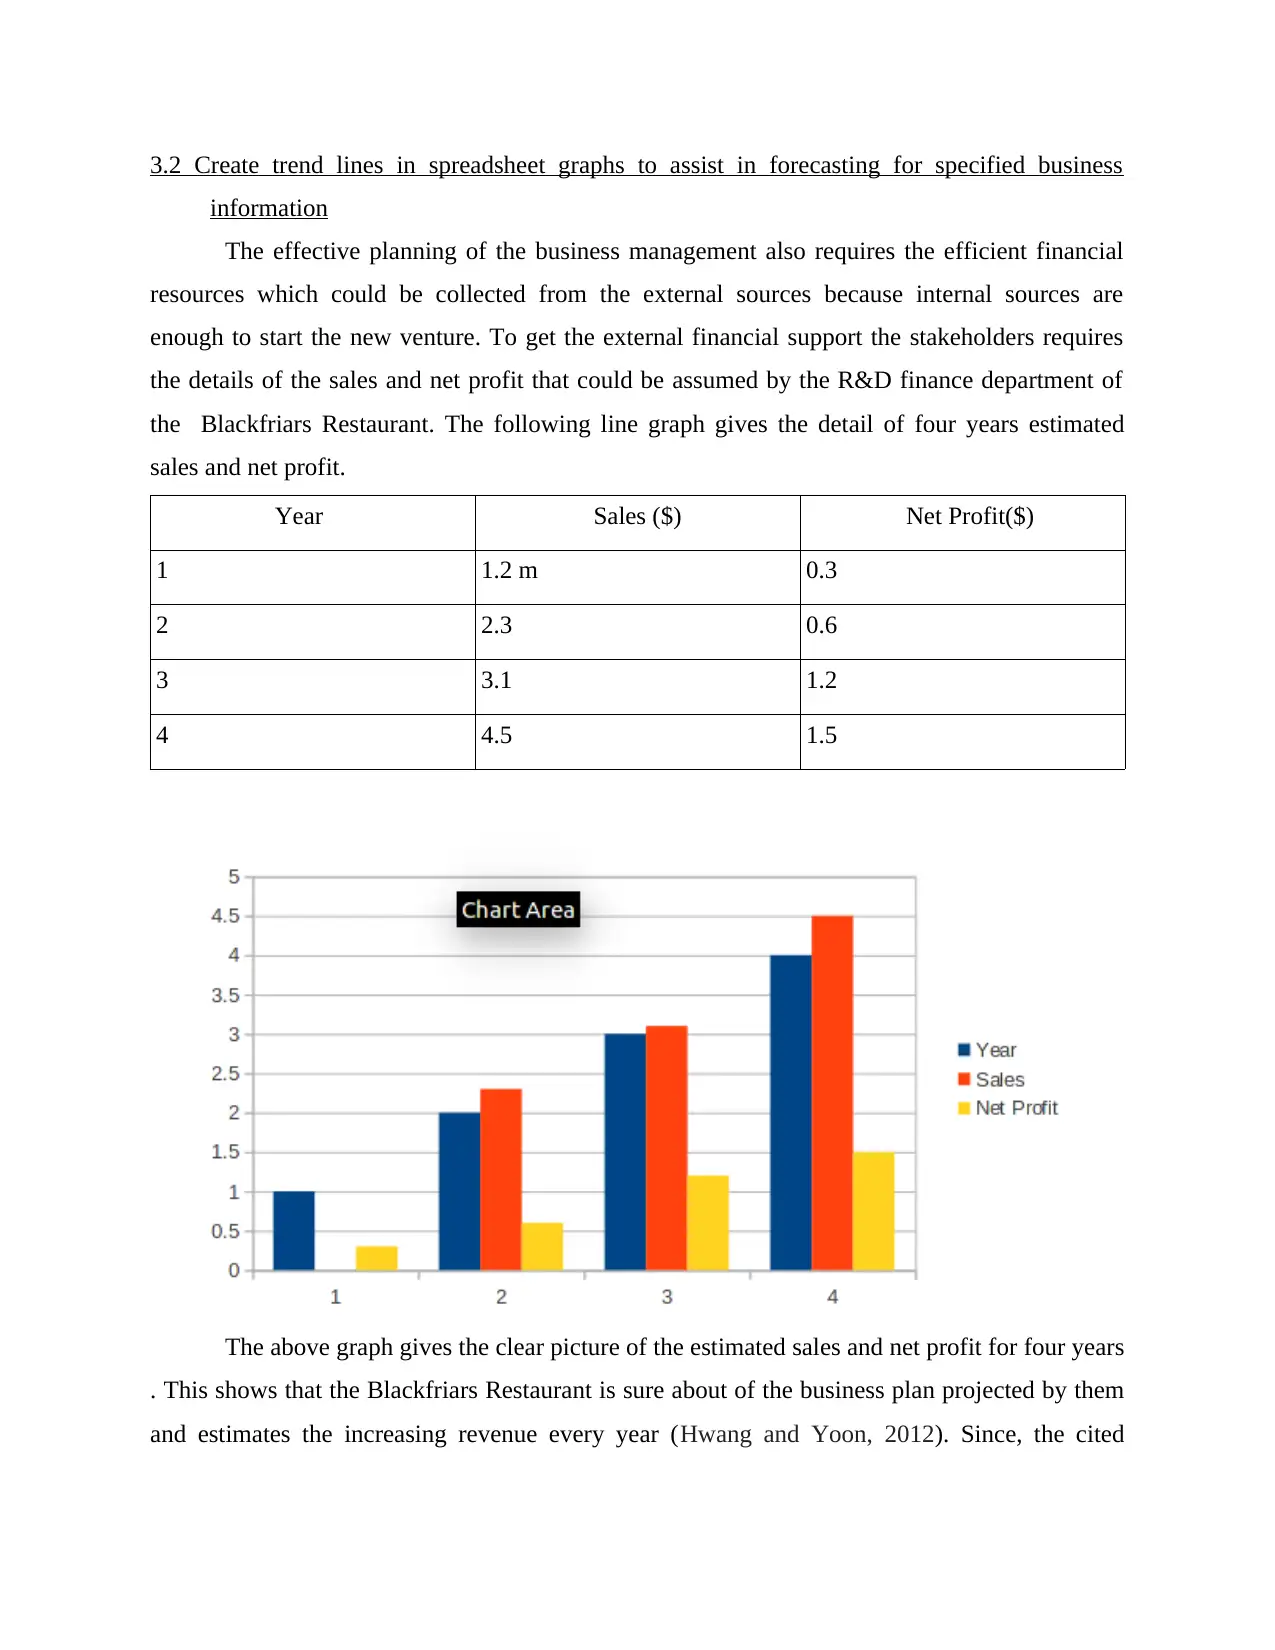
The effective planning of the business management also requires the efficient financial
resources which could be collected from the external sources because internal sources are
enough to start the new venture. To get the external financial support the stakeholders requires
the details of the sales and net profit that could be assumed by the R&D finance department of
the Blackfriars Restaurant. The following line graph gives the detail of four years estimated
sales and net profit.
Year Sales ($) Net Profit($)
1 1.2 m 0.3
2 2.3 0.6
3 3.1 1.2
4 4.5 1.5
The above graph gives the clear picture of the estimated sales and net profit for four years
. This shows that the Blackfriars Restaurant is sure about of the business plan projected by them
and estimates the increasing revenue every year (Hwang and Yoon, 2012). Since, the cited
information
The effective planning of the business management also requires the efficient financial
resources which could be collected from the external sources because internal sources are
enough to start the new venture. To get the external financial support the stakeholders requires
the details of the sales and net profit that could be assumed by the R&D finance department of
the Blackfriars Restaurant. The following line graph gives the detail of four years estimated
sales and net profit.
Year Sales ($) Net Profit($)
1 1.2 m 0.3
2 2.3 0.6
3 3.1 1.2
4 4.5 1.5
The above graph gives the clear picture of the estimated sales and net profit for four years
. This shows that the Blackfriars Restaurant is sure about of the business plan projected by them
and estimates the increasing revenue every year (Hwang and Yoon, 2012). Since, the cited
company is the one of the famous restaurants in London, thus their estimations are credible
enough to satisfy the external financial sources like banks .
3.3 Prepare a business presentation using suitable software and techniques to disseminate
information effectively
To
THE CEO
Subject : latter of indoctrination for purpose of a sales contract
Dear sir,
we are writhing to you on behalf IT company. We are analysis your company product
and your annual sales revenue 2 cr. If you growth your business your move on digital marketing .
Digital marketing is most way to reach consumer. It is a includes social media marketing ,search
engine optimization (SEO),Display advertising,mobile phone (SMS and MMS) any other from
digital media. Its time to need a new approach to marketing and new understanding of costumer
mind.
Search engine optimization (SEO) ;
SEO is a short for search engine optimization its to increase the amount of visitor to a web page
by high ranking in google search. It is a part of Search engine optimization (google , yahoo , big
and other search engine).
Mobile phone :
mobile phone marketing means use to bulk message through we application and app. Like -bulk
text message , what's up etc.
social media :
social media is increase references or sales and easy to rich the consumer. social media informed
about the new offer ,spacial event (Nowduri, 2011). They are many platforms of SMM
Facebook,you tube ,twitter,Pinterest etc.
3.4 Produce a formal business report
Business report is one of the most effective way to communicate in present business
world. Business and individual can use the report to and these reports helps them to make
⊘ This is a preview!⊘
Do you want full access?
Subscribe today to unlock all pages.
Trusted by 1+ million students worldwide
1 out of 20
Related Documents


Your All-in-One AI-Powered Toolkit for Academic Success.
+13062052269
info@desklib.com
Available 24*7 on WhatsApp / Email
![[object Object]](/_next/static/media/star-bottom.7253800d.svg)
Unlock your academic potential
Copyright © 2020–2026 A2Z Services. All Rights Reserved. Developed and managed by ZUCOL.