Business Decision Making Report: Food For Friends Outlet in London
VerifiedAdded on 2020/09/08
|18
|4673
|256
Report
AI Summary
This report analyzes the business decision-making process for Food For Friends, considering opening a new outlet in London, UK. It details the planning and collection of primary and secondary data, including survey methodologies, questionnaire design, and sampling frames. The report presents data analysis, including the determination of mean, median, mode, measures of dispersion, and correlation coefficients. Furthermore, it incorporates the creation of graphs, charts, and trend lines, along with the use of software-generated information, Gantt charts, network diagrams, and financial tools to aid in the decision-making process. The report concludes with recommendations based on the analysis conducted, offering insights into customer preferences and potential locations for the new outlet.
Business Decision Making
Paraphrase This Document
Need a fresh take? Get an instant paraphrase of this document with our AI Paraphraser
Table of Contents
INTRODUCTION...........................................................................................................................1
TASK 1............................................................................................................................................1
1.1 Plan for collecting primary and secondary data...............................................................1
1.2 Survey methodology and sampling frame used................................................................2
1.3 Design a questionnaire.....................................................................................................3
2.1 Creation of information....................................................................................................4
2.2 Determination of mean, median and mode.......................................................................5
2.3 Evaluation of measure of dispersion................................................................................6
2.4 Determination of quartile and correlation coefficient......................................................6
TASK 2............................................................................................................................................7
3.1 Creation of graphs and charts...........................................................................................7
3.2 Formulation of trend lines................................................................................................9
3.3 Presentation....................................................................................................................11
3.4 Formal business report...................................................................................................11
TASK 3..........................................................................................................................................11
4.1 Use of software generated information in decision making process..............................11
4.2 Use of Gantt Chart and network diagram.......................................................................12
4.3 Financial tools interference for decision making...........................................................14
CONCLUSION..............................................................................................................................15
REFERENCES..............................................................................................................................16
INTRODUCTION
Business require more and absolute consideration and inspection of various number of
activities so that better and appropriate judgement lead to carried down (Barlett, 2016). In this
consideration, it require critical inspection so that better and absolute working lead to carried
down. Management need to work in an appropriate frame by considering all major and
associated aspects. For this relation, they required to organise a survey and collect appropriate
information through that. It will also enables to interpret the results properly which further
manage in evaluating the things effectively. Moreover, data interpretation will lead to
disseminate the information data properly for making it better understandable. The software
generated information will enables in evaluating the aspects in better concentrative manner. Such
all aspects will going to bring out for Food For friends whom want to open up another outlet in
London, UK.
TASK 1
1.1 Plan for collecting primary and secondary data
Planning is an important aspect for every research or data which enable and facilitate to
collect information from diverse sources (Beach and Lipshitz, 2017). There are mainly two kinds
of data get determine which support in deriving best and appropriate judgement. Food For
friends want to organise a survey which clearly focus on opening of another outlet in London,
UK. Thus study could utilise the primary or secondary information so that better and effective
judgement lead to carried down.
Primary data: These are such kind of data which gather through raw sources and highly
based on personal interaction process. Primary study facilitate an option to carried down
appropriate results which enable in evaluating aspects clearly which could be utilise in
the form of feedback. Various approaches for gather primary source of data is
questionnaire, personal interviews etc.
Secondary data: These are such data which already lead to take place and have
concluded by any other individual. These data could be in the form of company records
or profile which could be analyse and assess easily and get from any internet sources
(Blondel and Müller-Rommel, 2016).
1
⊘ This is a preview!⊘
Do you want full access?
Subscribe today to unlock all pages.
Trusted by 1+ million students worldwide
Food For friends study lead to involve about primary data process in which questionnaire survey
lead to organise properly. The plan for collecting primary source of information define as follow:
Determine the cause or problem
Select appropriate method for study
Evaluate or select the target audience
Analyse the data
Conclude the decision
1.2 Survey methodology and sampling frame used
Surveys play an important role in order to gain and collect appropriate information from
diverse number of individuals. Survey define and simplify various kinds of methods which
facilitate an option to bring out positive and appropriate reflection (Drucker, 2017). Thus,
following are the several number of survey methodologies which could be utilise by each and
every individual so that they lead to work in better and appropriate frame. Questionnaire: This is a primary form of data collection process where several number
of questions get asked to an individual. This enable in providing personal response of
each and every individual so that better and appropriate understanding could be
promoted.
Survey Monkey: Another data collection method depicts about survey monkey where
information gather through online medium or by creating questionnaire through digital
source. This get deliver through messages which enable in gaining response of every
person properly
With all these aspects, several more number of considerations which support in selecting the
sample is sampling frame (Goleman, 2017). There are various kinds of sampling frame could be
utilise by management of FFF which are:
Random sampling
Cluster sampling
Out of various kinds of survey methods and sampling frame, FFF will going to adopt
questionnaire method and random sampling technique which enable them to target 80
respondents by distributing a questionnaire includes 10 questions.
2
Paraphrase This Document
Need a fresh take? Get an instant paraphrase of this document with our AI Paraphraser
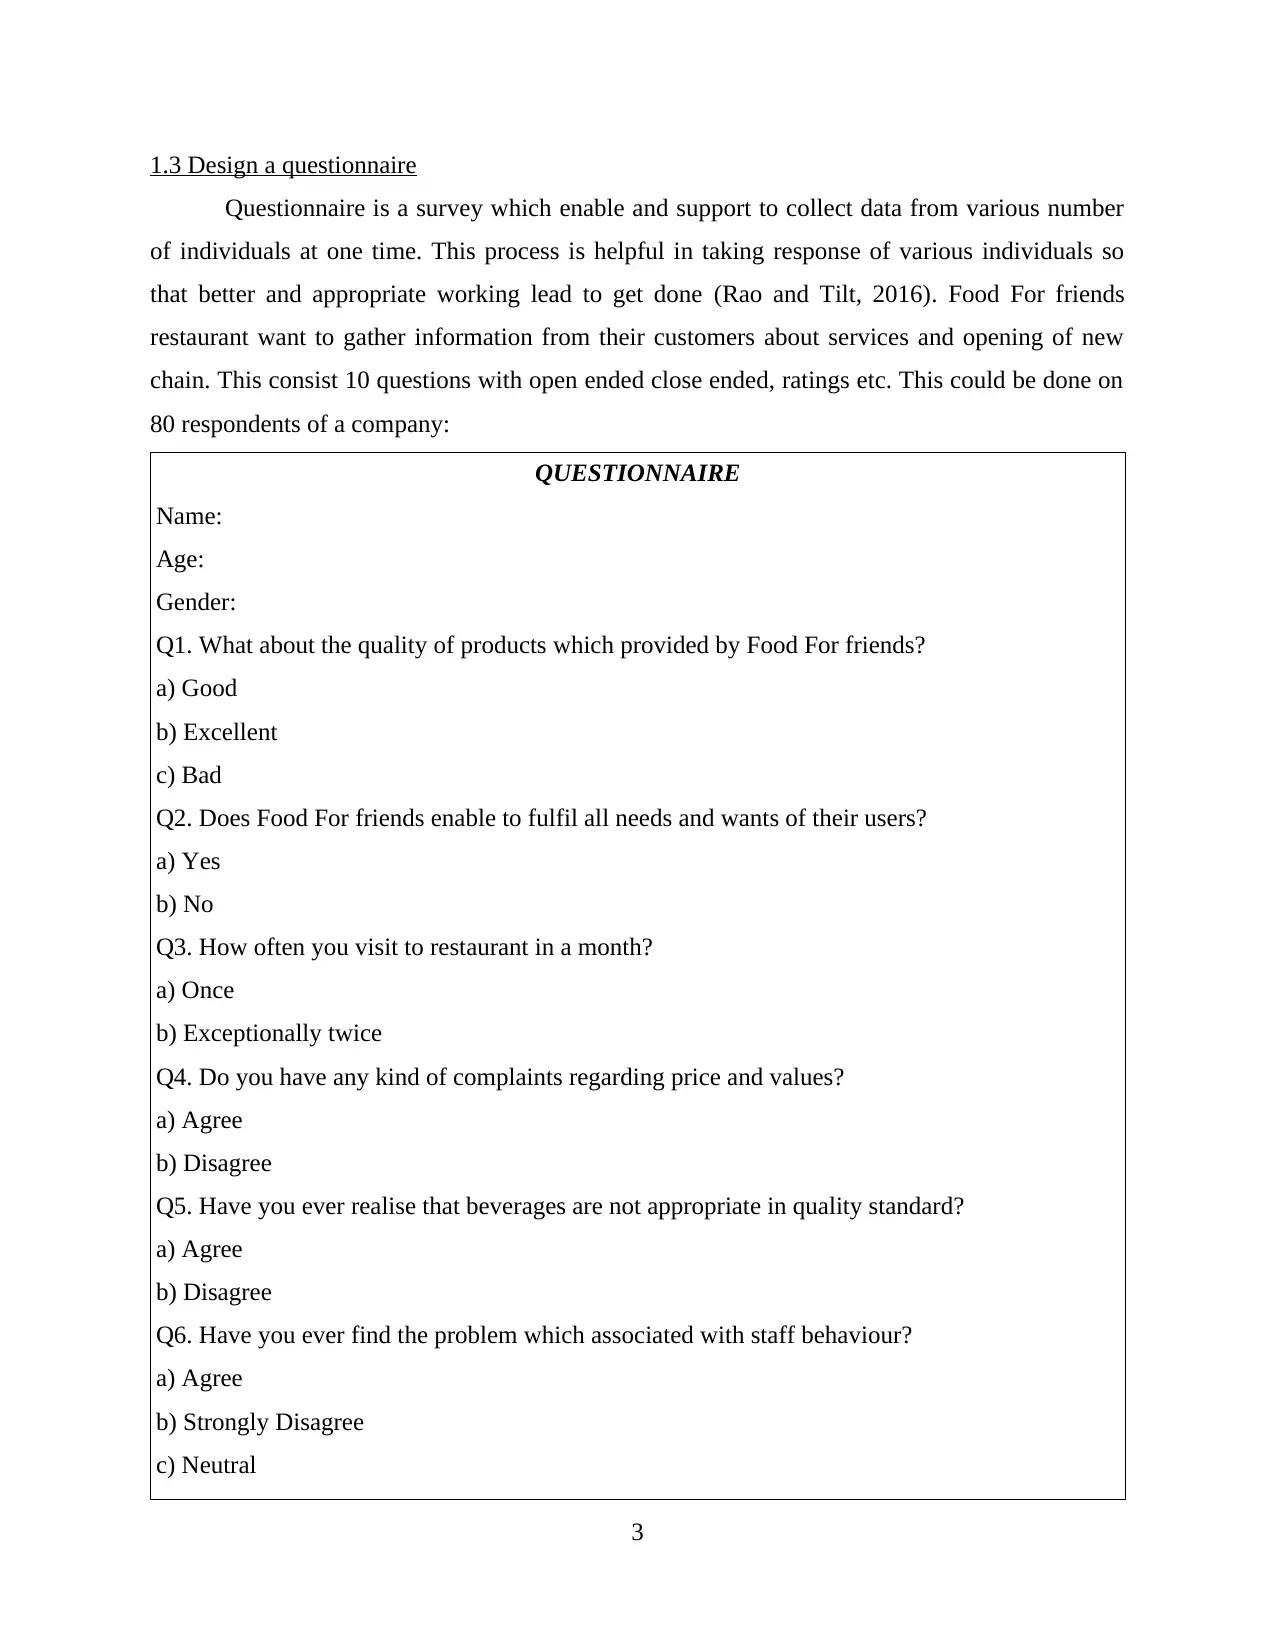
1.3 Design a questionnaire
Questionnaire is a survey which enable and support to collect data from various number
of individuals at one time. This process is helpful in taking response of various individuals so
that better and appropriate working lead to get done (Rao and Tilt, 2016). Food For friends
restaurant want to gather information from their customers about services and opening of new
chain. This consist 10 questions with open ended close ended, ratings etc. This could be done on
80 respondents of a company:
QUESTIONNAIRE
Name:
Age:
Gender:
Q1. What about the quality of products which provided by Food For friends?
a) Good
b) Excellent
c) Bad
Q2. Does Food For friends enable to fulfil all needs and wants of their users?
a) Yes
b) No
Q3. How often you visit to restaurant in a month?
a) Once
b) Exceptionally twice
Q4. Do you have any kind of complaints regarding price and values?
a) Agree
b) Disagree
Q5. Have you ever realise that beverages are not appropriate in quality standard?
a) Agree
b) Disagree
Q6. Have you ever find the problem which associated with staff behaviour?
a) Agree
b) Strongly Disagree
c) Neutral
3
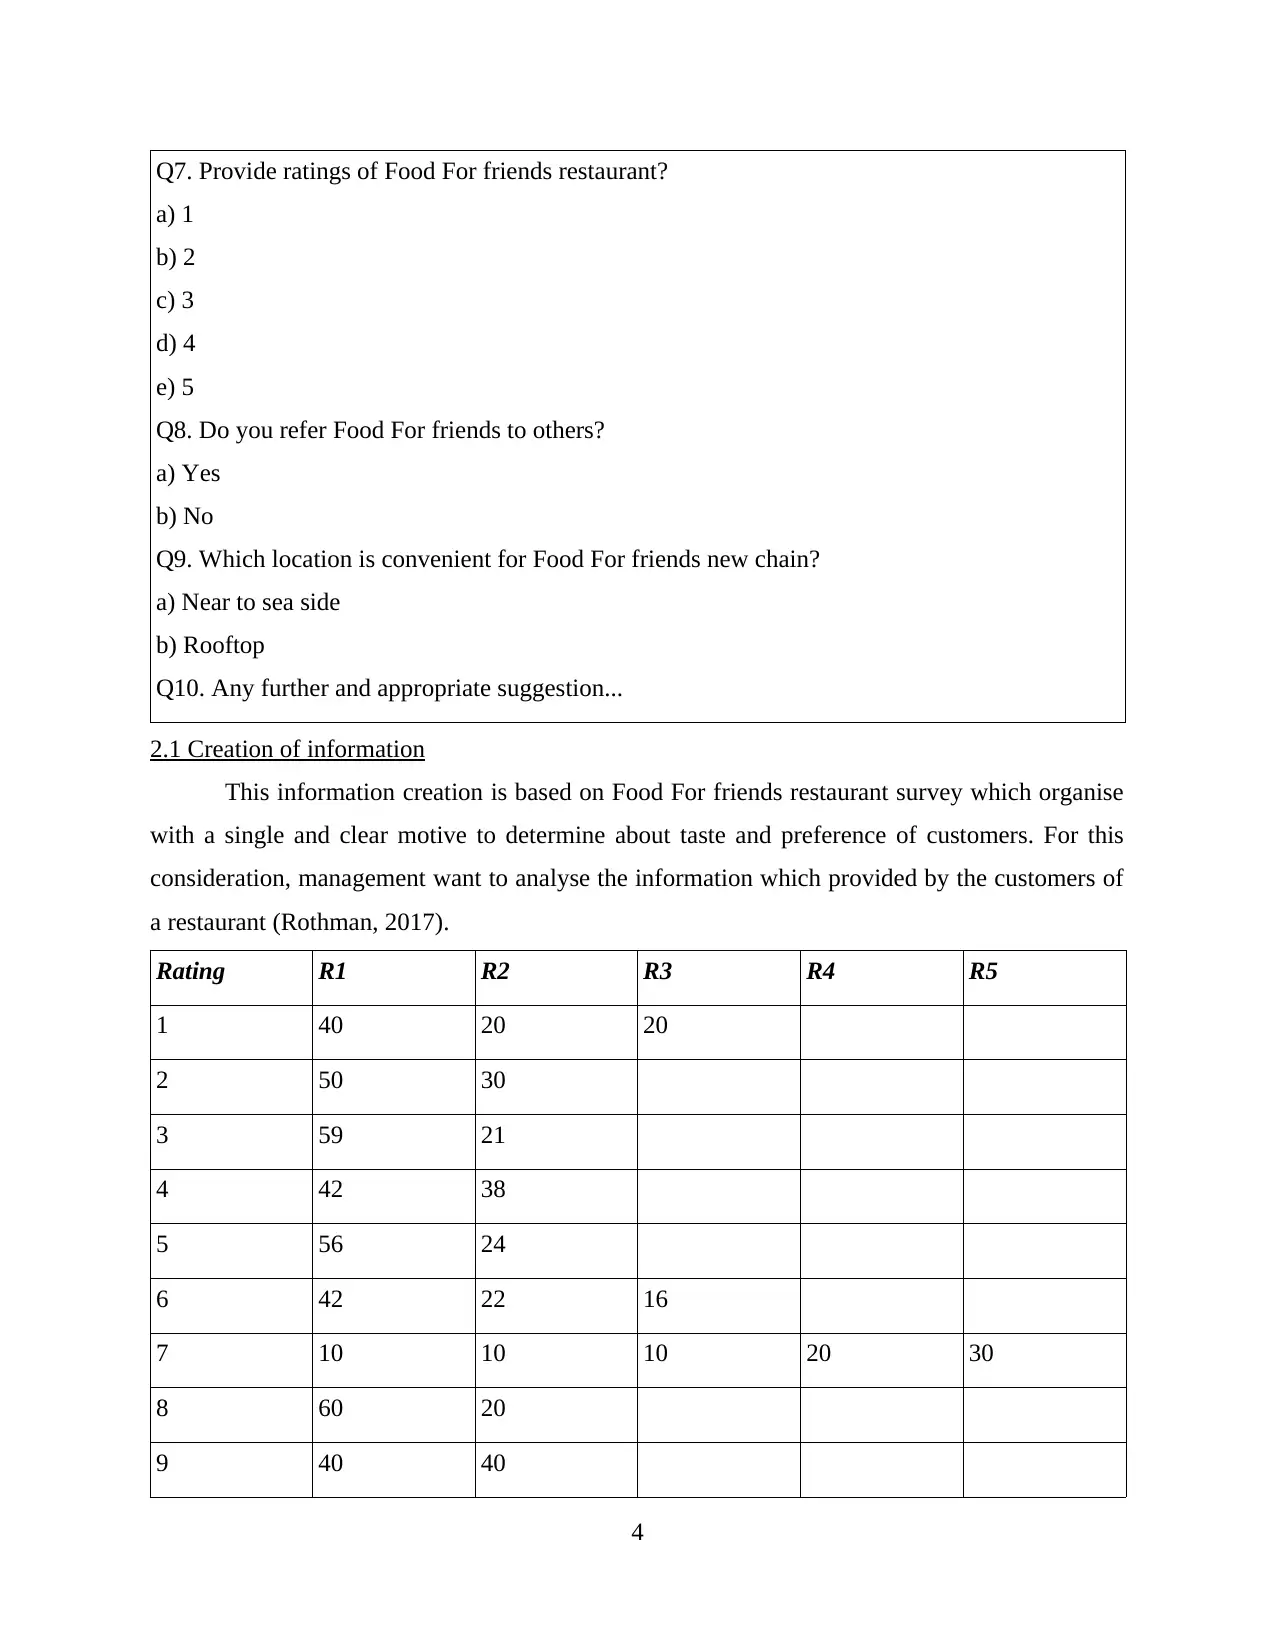
Q7. Provide ratings of Food For friends restaurant?
a) 1
b) 2
c) 3
d) 4
e) 5
Q8. Do you refer Food For friends to others?
a) Yes
b) No
Q9. Which location is convenient for Food For friends new chain?
a) Near to sea side
b) Rooftop
Q10. Any further and appropriate suggestion...
2.1 Creation of information
This information creation is based on Food For friends restaurant survey which organise
with a single and clear motive to determine about taste and preference of customers. For this
consideration, management want to analyse the information which provided by the customers of
a restaurant (Rothman, 2017).
Rating R1 R2 R3 R4 R5
1 40 20 20
2 50 30
3 59 21
4 42 38
5 56 24
6 42 22 16
7 10 10 10 20 30
8 60 20
9 40 40
4
⊘ This is a preview!⊘
Do you want full access?
Subscribe today to unlock all pages.
Trusted by 1+ million students worldwide
This information stated that company need to work on their staff behaviour as they need
more and more training. Many individuals define that goods and services are high quality
standard in nature which support in made individuals satisfied. Seaside is convenient location for
Food For friends restaurant which enable them to attract wide range of individuals. This
consideration enable them to gain competitive advantage and made an association differ from
others. Thus, chances of managing and enhancing better outcome become possible in frame.
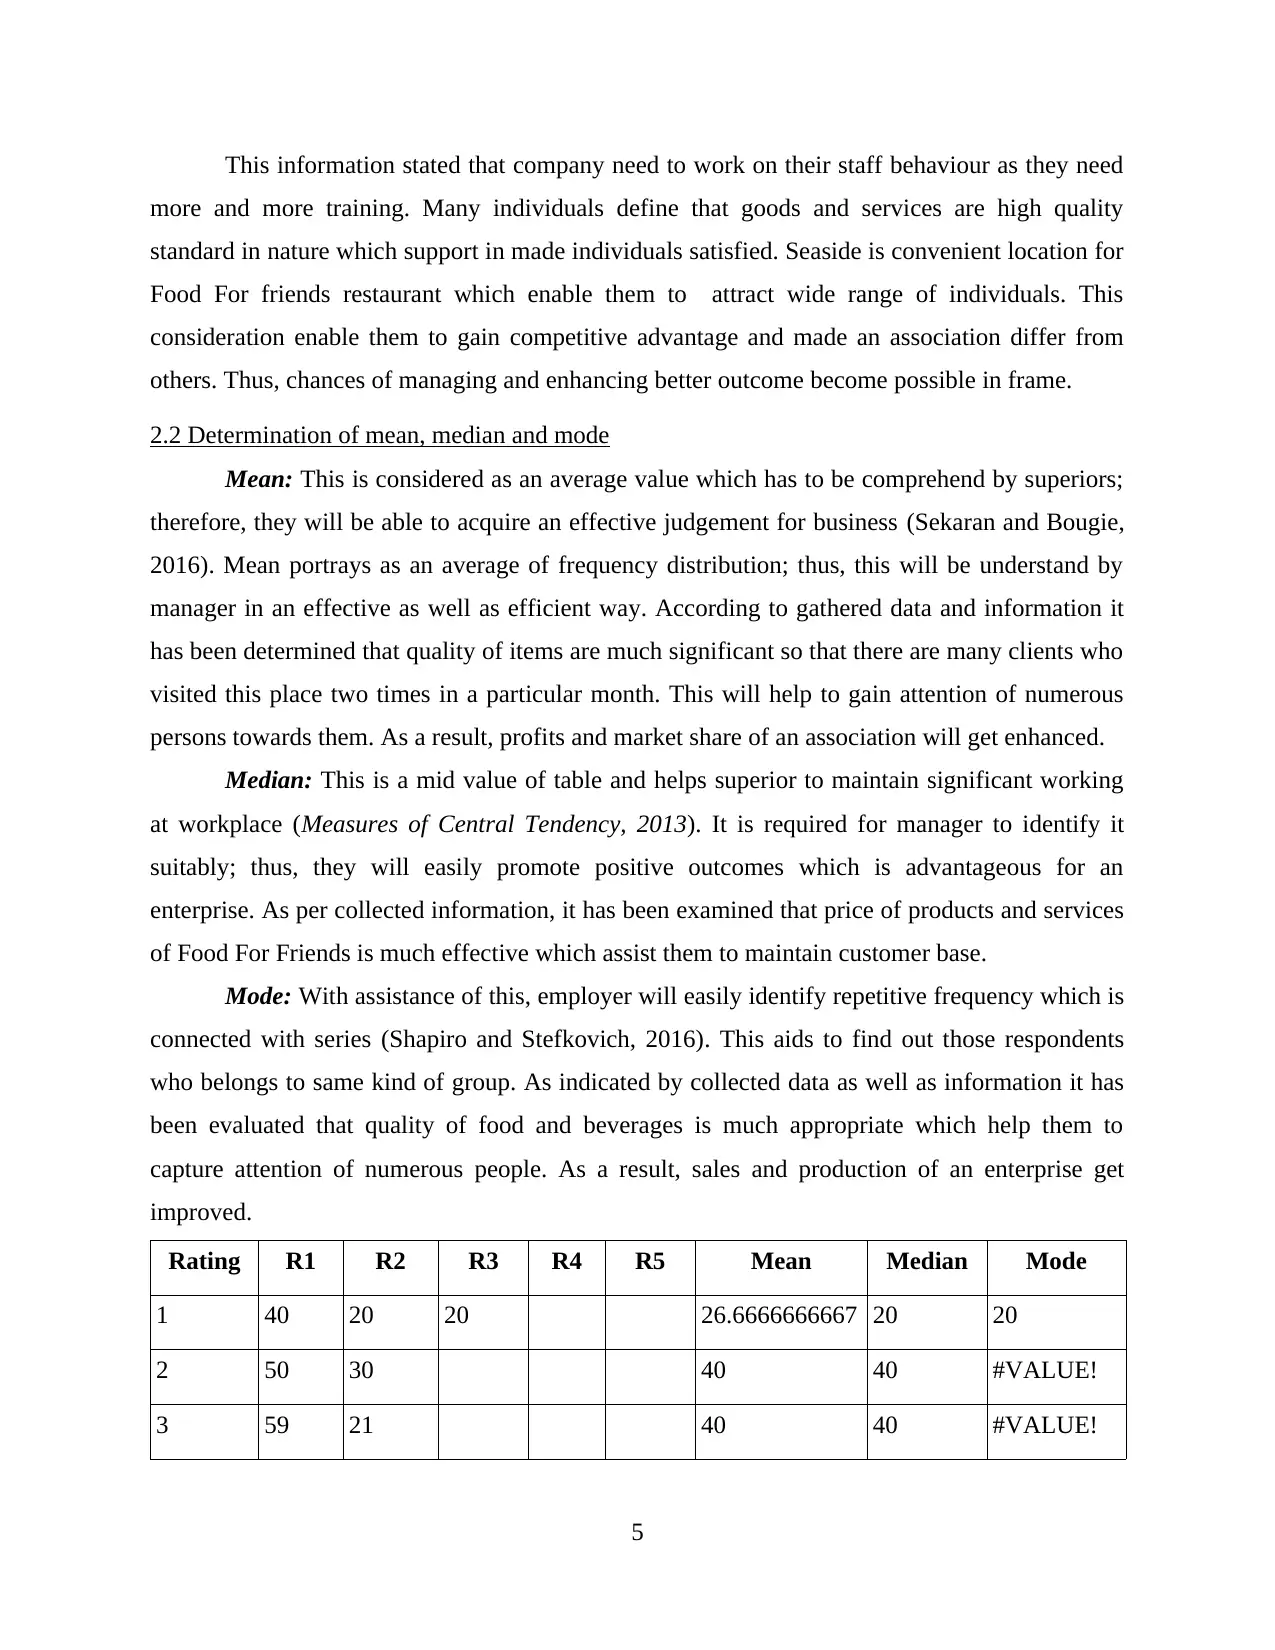
2.2 Determination of mean, median and mode
Mean: This is considered as an average value which has to be comprehend by superiors;
therefore, they will be able to acquire an effective judgement for business (Sekaran and Bougie,
2016). Mean portrays as an average of frequency distribution; thus, this will be understand by
manager in an effective as well as efficient way. According to gathered data and information it
has been determined that quality of items are much significant so that there are many clients who
visited this place two times in a particular month. This will help to gain attention of numerous
persons towards them. As a result, profits and market share of an association will get enhanced.
Median: This is a mid value of table and helps superior to maintain significant working
at workplace (Measures of Central Tendency, 2013). It is required for manager to identify it
suitably; thus, they will easily promote positive outcomes which is advantageous for an
enterprise. As per collected information, it has been examined that price of products and services
of Food For Friends is much effective which assist them to maintain customer base.
Mode: With assistance of this, employer will easily identify repetitive frequency which is
connected with series (Shapiro and Stefkovich, 2016). This aids to find out those respondents
who belongs to same kind of group. As indicated by collected data as well as information it has
been evaluated that quality of food and beverages is much appropriate which help them to
capture attention of numerous people. As a result, sales and production of an enterprise get
improved.
Rating R1 R2 R3 R4 R5 Mean Median Mode
1 40 20 20 26.6666666667 20 20
2 50 30 40 40 #VALUE!
3 59 21 40 40 #VALUE!
5
more and more training. Many individuals define that goods and services are high quality
standard in nature which support in made individuals satisfied. Seaside is convenient location for
Food For friends restaurant which enable them to attract wide range of individuals. This
consideration enable them to gain competitive advantage and made an association differ from
others. Thus, chances of managing and enhancing better outcome become possible in frame.
2.2 Determination of mean, median and mode
Mean: This is considered as an average value which has to be comprehend by superiors;
therefore, they will be able to acquire an effective judgement for business (Sekaran and Bougie,
2016). Mean portrays as an average of frequency distribution; thus, this will be understand by
manager in an effective as well as efficient way. According to gathered data and information it
has been determined that quality of items are much significant so that there are many clients who
visited this place two times in a particular month. This will help to gain attention of numerous
persons towards them. As a result, profits and market share of an association will get enhanced.
Median: This is a mid value of table and helps superior to maintain significant working
at workplace (Measures of Central Tendency, 2013). It is required for manager to identify it
suitably; thus, they will easily promote positive outcomes which is advantageous for an
enterprise. As per collected information, it has been examined that price of products and services
of Food For Friends is much effective which assist them to maintain customer base.
Mode: With assistance of this, employer will easily identify repetitive frequency which is
connected with series (Shapiro and Stefkovich, 2016). This aids to find out those respondents
who belongs to same kind of group. As indicated by collected data as well as information it has
been evaluated that quality of food and beverages is much appropriate which help them to
capture attention of numerous people. As a result, sales and production of an enterprise get
improved.
Rating R1 R2 R3 R4 R5 Mean Median Mode
1 40 20 20 26.6666666667 20 20
2 50 30 40 40 #VALUE!
3 59 21 40 40 #VALUE!
5
Paraphrase This Document
Need a fresh take? Get an instant paraphrase of this document with our AI Paraphraser
Rating R1 R2 R3 R4 R5 Mean Median Mode
4 42 38 40 40 #VALUE!
5 56 24 40 40 #VALUE!
6 42 22 16 26.6666666667 22 #VALUE!
7 10 10 10 20 30 10 10 10
8 60 20 40 40 #VALUE!
9 40 40 40 40 40
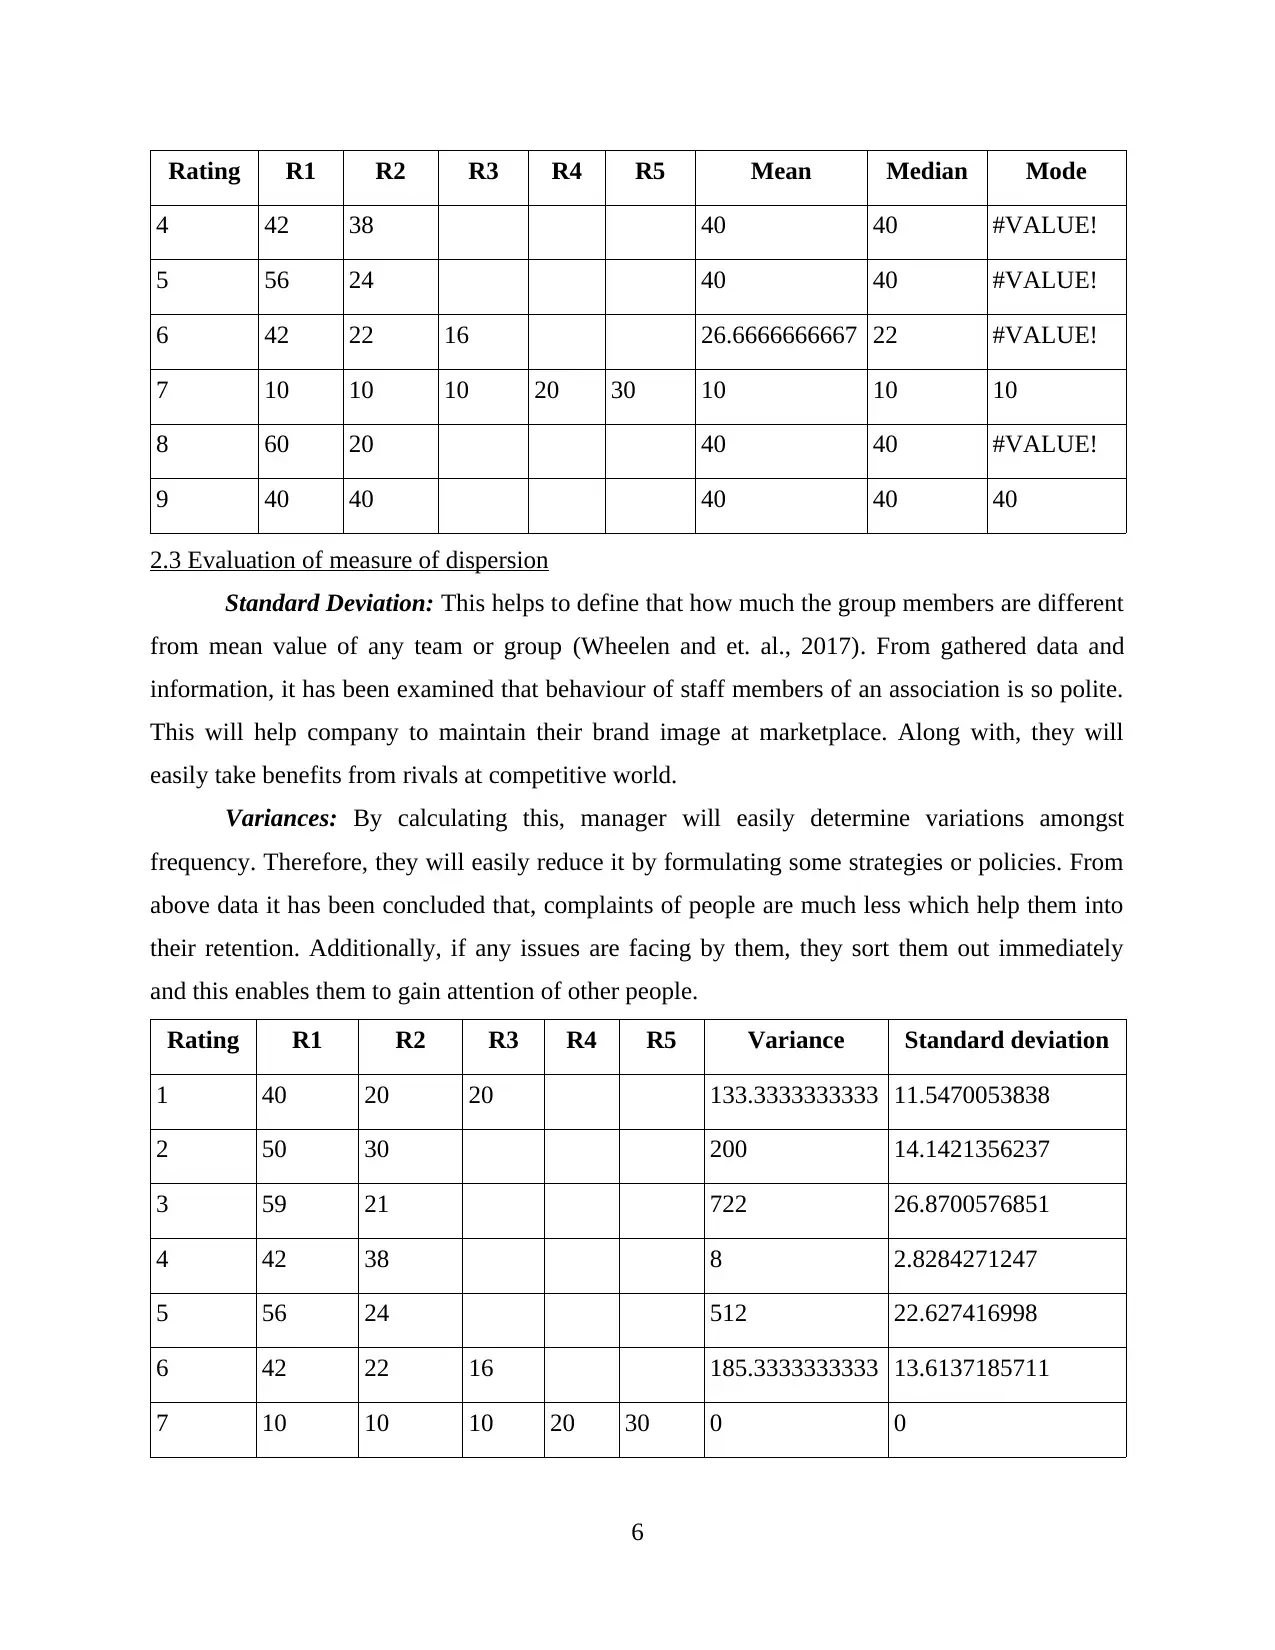
2.3 Evaluation of measure of dispersion
Standard Deviation: This helps to define that how much the group members are different
from mean value of any team or group (Wheelen and et. al., 2017). From gathered data and
information, it has been examined that behaviour of staff members of an association is so polite.
This will help company to maintain their brand image at marketplace. Along with, they will
easily take benefits from rivals at competitive world.
Variances: By calculating this, manager will easily determine variations amongst
frequency. Therefore, they will easily reduce it by formulating some strategies or policies. From
above data it has been concluded that, complaints of people are much less which help them into
their retention. Additionally, if any issues are facing by them, they sort them out immediately
and this enables them to gain attention of other people.
Rating R1 R2 R3 R4 R5 Variance Standard deviation
1 40 20 20 133.3333333333 11.5470053838
2 50 30 200 14.1421356237
3 59 21 722 26.8700576851
4 42 38 8 2.8284271247
5 56 24 512 22.627416998
6 42 22 16 185.3333333333 13.6137185711
7 10 10 10 20 30 0 0
6
4 42 38 40 40 #VALUE!
5 56 24 40 40 #VALUE!
6 42 22 16 26.6666666667 22 #VALUE!
7 10 10 10 20 30 10 10 10
8 60 20 40 40 #VALUE!
9 40 40 40 40 40
2.3 Evaluation of measure of dispersion
Standard Deviation: This helps to define that how much the group members are different
from mean value of any team or group (Wheelen and et. al., 2017). From gathered data and
information, it has been examined that behaviour of staff members of an association is so polite.
This will help company to maintain their brand image at marketplace. Along with, they will
easily take benefits from rivals at competitive world.
Variances: By calculating this, manager will easily determine variations amongst
frequency. Therefore, they will easily reduce it by formulating some strategies or policies. From
above data it has been concluded that, complaints of people are much less which help them into
their retention. Additionally, if any issues are facing by them, they sort them out immediately
and this enables them to gain attention of other people.
Rating R1 R2 R3 R4 R5 Variance Standard deviation
1 40 20 20 133.3333333333 11.5470053838
2 50 30 200 14.1421356237
3 59 21 722 26.8700576851
4 42 38 8 2.8284271247
5 56 24 512 22.627416998
6 42 22 16 185.3333333333 13.6137185711
7 10 10 10 20 30 0 0
6
Rating R1 R2 R3 R4 R5 Variance Standard deviation
8 60 20 800 28.2842712475
9 40 40 0 0
2.4 Determination of quartile and correlation coefficient
Rating R1 R2 R3 R4 R5 Correlation
Coefficient
1 40 20 20 0.9754172691 relationship
between 1 and 6
2 50 30
3 59 21
4 42 38 1 relationship
between 4 and 8
5 56 24
6 42 22 16
7 10 10 10 20 30
8 60 20
9 40 40
Correlation coefficient: It is must for manager to set some connection amongst two or
more elements; therefore, they will be able to acquire best and effective decision for an
organisation (Zavadskas and et. al., 2016). This will assists organisation to attain coveted targets
within limited period of time. It has been examined that quality of products and services of an
affiliation is much appropriate which will help to acquire attention of numerous individuals
towards them. There are many people who visited this place more than two times in a month
with their friends or families.
Quartile: This will be classified into four parts which will help superior to understand
entire things in a significant manner. From above gathered data as well as information, it has
7
⊘ This is a preview!⊘
Do you want full access?
Subscribe today to unlock all pages.
Trusted by 1+ million students worldwide
been comprehended that location of restaurant need to be much appropriate for their new outlet
as this helps to gain attention of numerous people towards them. As a result, profits and
productivity of an affiliation will get enhanced.
TASK 2
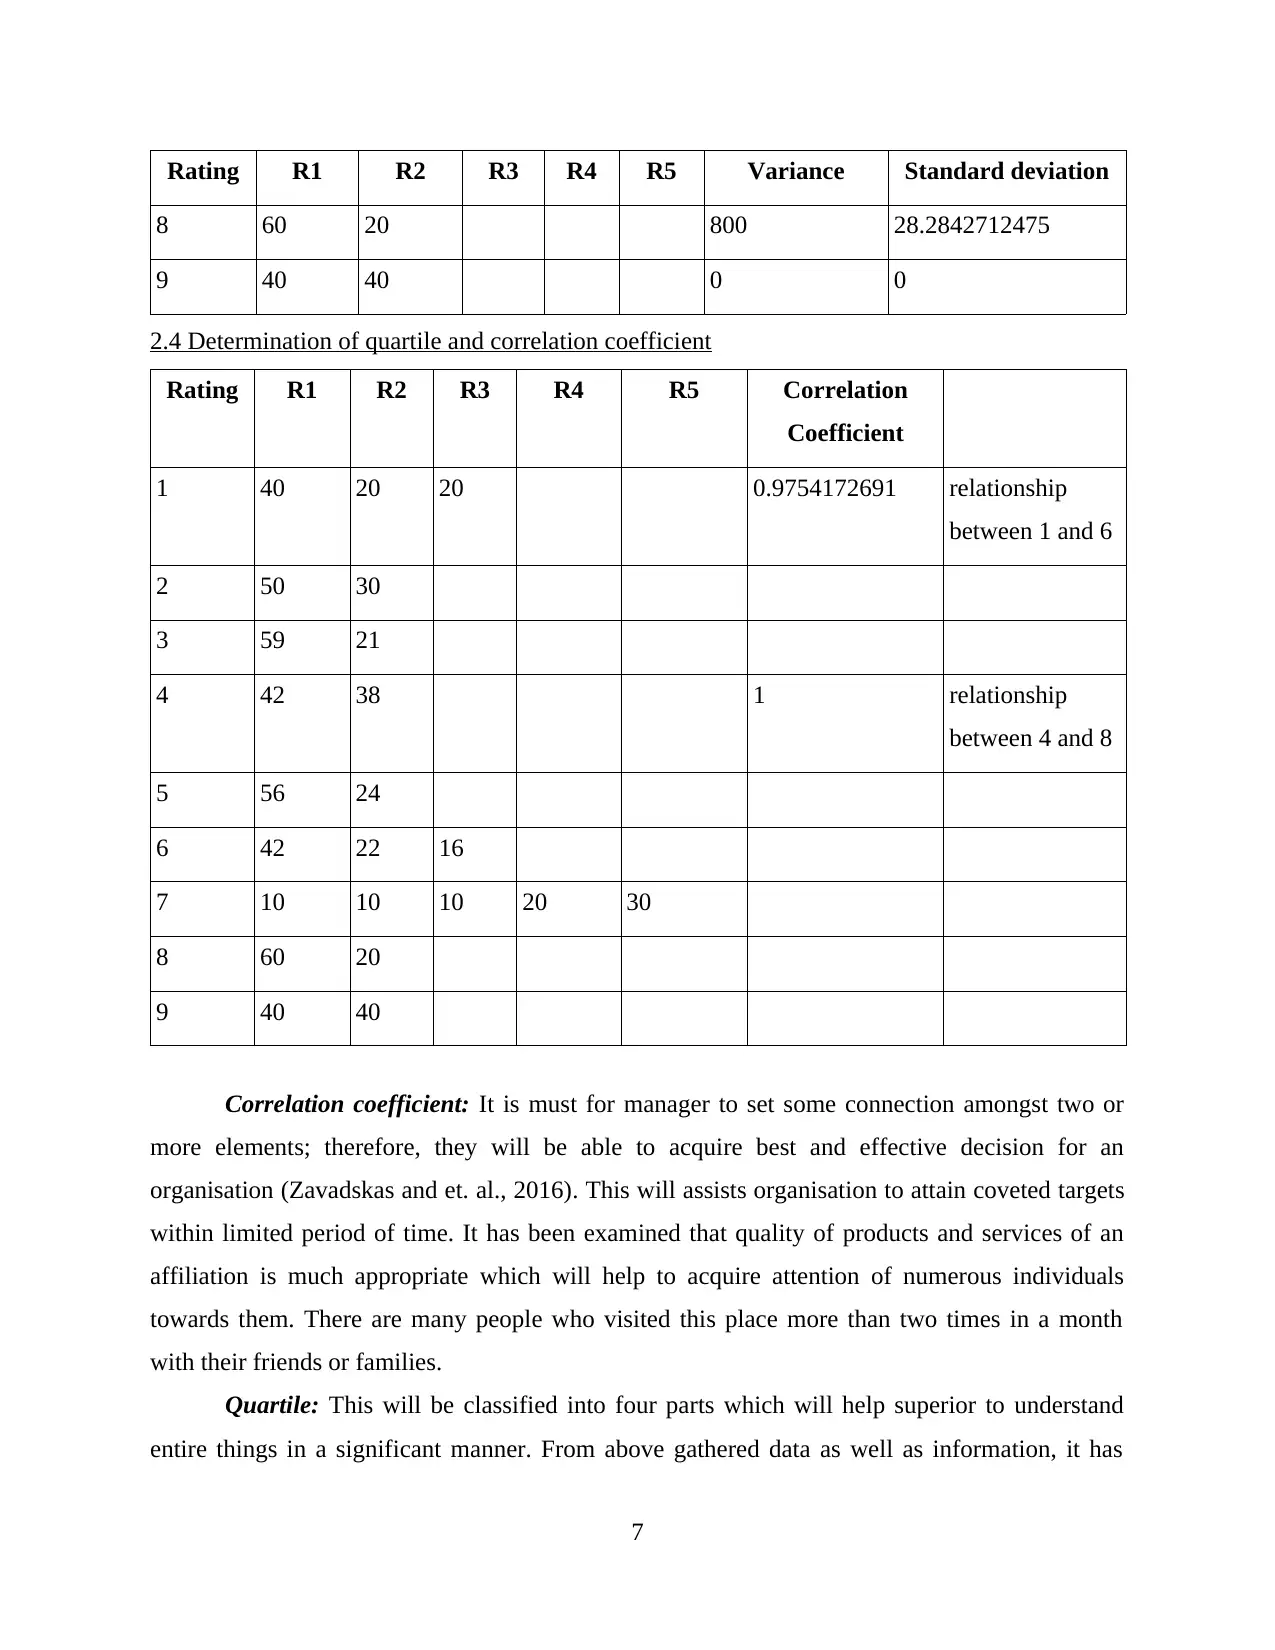
3.1 Creation of graphs and charts
Theme 1: Quality of products and services of Food For Friends is much appropriate
Good Excellent Best
0
5
10
15
20
25
30
35
40
Column B
Interpretation: Quality of goods and services of company is much appropriate which aid
to gain attention of numerous individuals towards them. From above graph, it has been analysed
that almost 40 individuals are favouring this argument but, 20 people are termed it as an
excellent and remaining respondents considered it as a best.
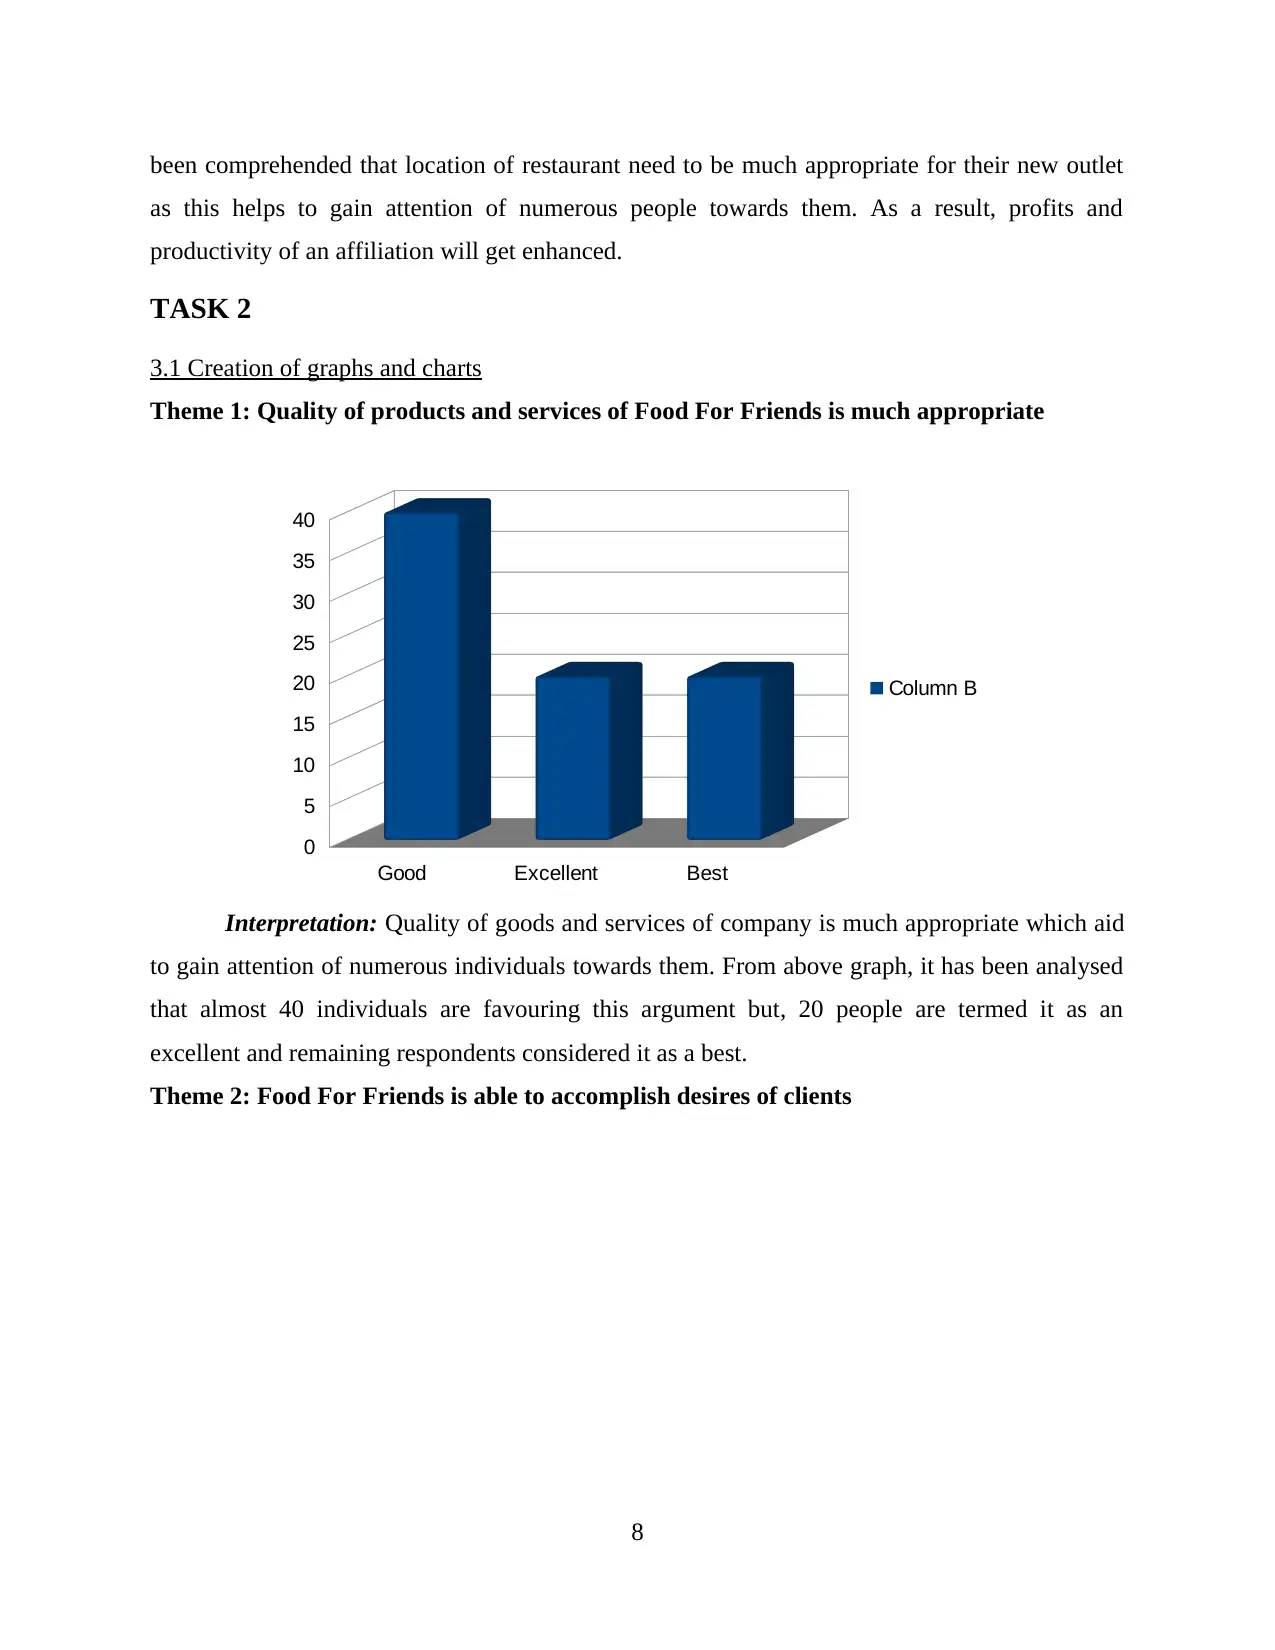
Theme 2: Food For Friends is able to accomplish desires of clients
8
as this helps to gain attention of numerous people towards them. As a result, profits and
productivity of an affiliation will get enhanced.
TASK 2
3.1 Creation of graphs and charts
Theme 1: Quality of products and services of Food For Friends is much appropriate
Good Excellent Best
0
5
10
15
20
25
30
35
40
Column B
Interpretation: Quality of goods and services of company is much appropriate which aid
to gain attention of numerous individuals towards them. From above graph, it has been analysed
that almost 40 individuals are favouring this argument but, 20 people are termed it as an
excellent and remaining respondents considered it as a best.
Theme 2: Food For Friends is able to accomplish desires of clients
8
Paraphrase This Document
Need a fresh take? Get an instant paraphrase of this document with our AI Paraphraser
Yes No
0
5
10
15
20
25
30
35
40
45
50
50
30
Column B
Interpretation: Organisation conduct research on regular basis so that they will be able to
know about needs and wants of clients. Thus, they will accomplish it within limited period of
time. From above graphical representation, it has been examined that almost 50 respondents are
favouring this argument but remaining people are entirely against of this,
Theme 3: Many people visited this place one time only
Once Exceptionally twice
0
10
20
30
40
50
60
59
21 Column B
Interpretation: There are many people who visited Food For Friends repetitively. This
will aid them to enhance their profits and sales effectively. From above graph, it has been
presented that almost 59 individuals visited this place only one time, but 21 respondents visited
here more than 2 times.
3.2 Formulation of trend lines
Theme 4: There is no complaints of clients regarding prices of items
9
0
5
10
15
20
25
30
35
40
45
50
50
30
Column B
Interpretation: Organisation conduct research on regular basis so that they will be able to
know about needs and wants of clients. Thus, they will accomplish it within limited period of
time. From above graphical representation, it has been examined that almost 50 respondents are
favouring this argument but remaining people are entirely against of this,
Theme 3: Many people visited this place one time only
Once Exceptionally twice
0
10
20
30
40
50
60
59
21 Column B
Interpretation: There are many people who visited Food For Friends repetitively. This
will aid them to enhance their profits and sales effectively. From above graph, it has been
presented that almost 59 individuals visited this place only one time, but 21 respondents visited
here more than 2 times.
3.2 Formulation of trend lines
Theme 4: There is no complaints of clients regarding prices of items
9
Agree Disagree
36
37
38
39
40
41
42
43
42
38
Column B
Linear (Column B)
Interpretation: Quality of products and services of organisation is much effective which
help to capture attention of numerous people towards them. Along with, they are fulfilling
requirements of clients as per their desires. It has been evaluated that almost 42 individuals are
favouring this statement, but remaining are entirely against of this.
Theme 5: Quality of food and beverages is much effective
Agree Disagree
0
10
20
30
40
50
60 56
24 Column B
Linear (Column B)
Interpretation: Quality of food and beverages of company is much appropriate which aid
to acquire attention of numerous people towards them. From above graph it has been examined
that almost 56 respondents are favouring this argument but 24 answerers are totally disagree with
this.
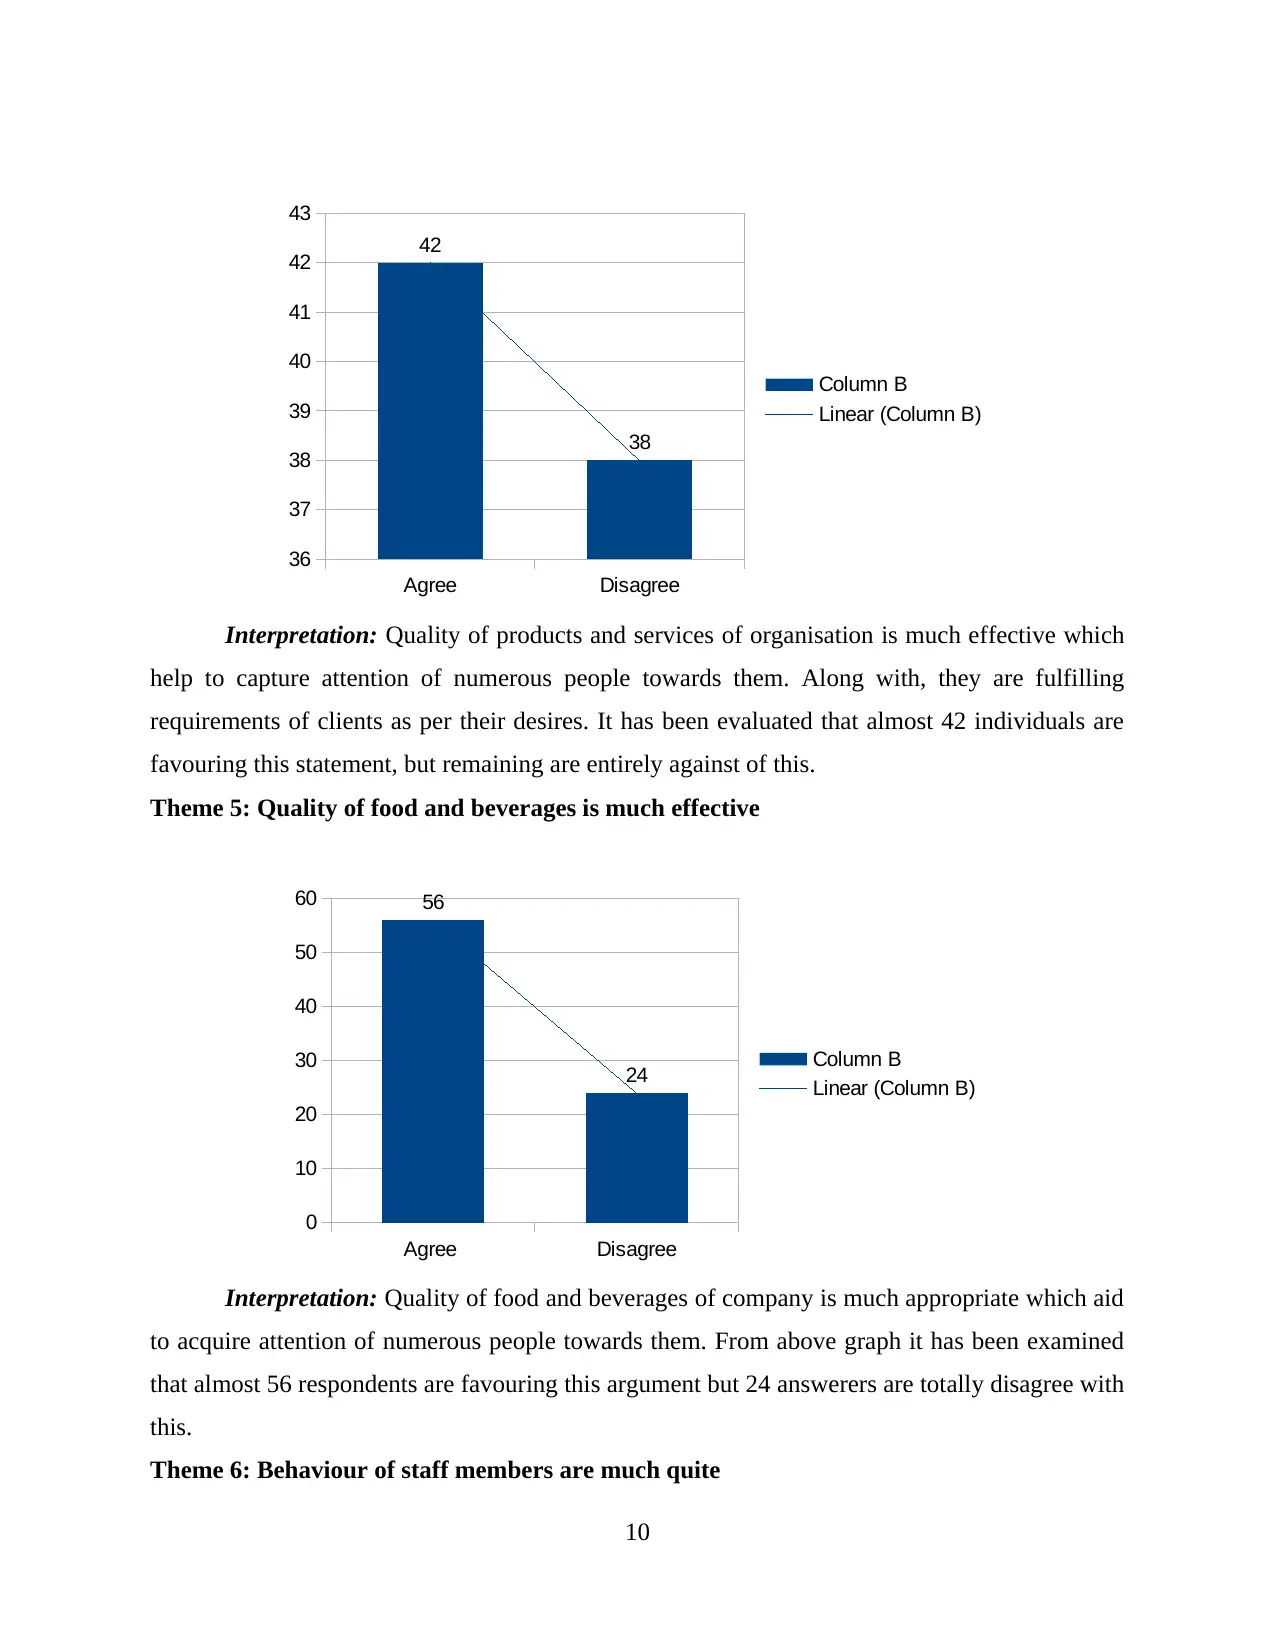
Theme 6: Behaviour of staff members are much quite
10
36
37
38
39
40
41
42
43
42
38
Column B
Linear (Column B)
Interpretation: Quality of products and services of organisation is much effective which
help to capture attention of numerous people towards them. Along with, they are fulfilling
requirements of clients as per their desires. It has been evaluated that almost 42 individuals are
favouring this statement, but remaining are entirely against of this.
Theme 5: Quality of food and beverages is much effective
Agree Disagree
0
10
20
30
40
50
60 56
24 Column B
Linear (Column B)
Interpretation: Quality of food and beverages of company is much appropriate which aid
to acquire attention of numerous people towards them. From above graph it has been examined
that almost 56 respondents are favouring this argument but 24 answerers are totally disagree with
this.
Theme 6: Behaviour of staff members are much quite
10
⊘ This is a preview!⊘
Do you want full access?
Subscribe today to unlock all pages.
Trusted by 1+ million students worldwide
1 out of 18
Related Documents


Your All-in-One AI-Powered Toolkit for Academic Success.
+13062052269
info@desklib.com
Available 24*7 on WhatsApp / Email
![[object Object]](/_next/static/media/star-bottom.7253800d.svg)
Unlock your academic potential
Copyright © 2020–2026 A2Z Services. All Rights Reserved. Developed and managed by ZUCOL.