Business Management Dissertation: Indian Food Industry in Scotland
VerifiedAdded on 2022/10/04
|57
|12673
|35
Dissertation
AI Summary
This dissertation investigates the critical success factors for Indian restaurants in Scotland, focusing on the challenges and opportunities within the industry. The research, using Mother India as a case study, aims to identify essential elements for sustainability and competitive advantage in the face of changing consumer demands and economic pressures. The study employs a quantitative survey to gather data from consumers, exploring factors such as the adoption of digital technologies, flexible staffing models, and the importance of adapting to consumer preferences. The dissertation includes a comprehensive literature review, detailed methodology, and data analysis, culminating in conclusions and recommendations for enhancing the success of Indian restaurants in the region. The findings highlight the need for businesses to adapt to modern marketing opportunities and technological advancements while maintaining the authenticity of their offerings. The research concludes with recommendations for managing sustainable competitive advantage, addressing limitations, and suggesting avenues for future research.
Running head: BUSINESS MANAGEMENT DISSERTATION
Business Management Dissertation
Name of the student
Name of the university
Author note
Business Management Dissertation
Name of the student
Name of the university
Author note
Paraphrase This Document
Need a fresh take? Get an instant paraphrase of this document with our AI Paraphraser
1BUSINESS MANAGEMENT DISSERTATION
Abstract
This study had examined the critical success factor for Indian food restaurants in
Scotland. Current predictions had shown that one in every two curry houses in
Britain have been expected to close within the next 10 years. It showed that almost
17,000 restaurants serving Indian food will close down within the next decade.
Therefore, the main objective of the research was to examine the critical success
factors essential for managing sustainability and gaining competitive advantage in
Scotland and to recommend suitable strategies for managing sustainable
competitive advantage. The literature examined past literature and highlighted that
the critical success factors. A single research design was developed which used a
quantitative survey instrument to collect data from 100 consumers in Glasgow which
showed that Mother India restaurants requires implementation of digitisation into
their organisation business process. Flexible staffing opportunities and introduction
of new staffing models to accommodate online communication with consumers is
necessary.
2BUSINESS MANAGEMENT DISSERTATION
Table of Contents
Chapter 1: Introduction.................................................................................................4
1.1 Background.........................................................................................................4
1.2 Aim and Objectives.............................................................................................5
1.3 Overview of the Research methodology adopted...............................................6
1.4 Dissertation Structure.........................................................................................6
1.5 Summary.............................................................................................................8
Chapter 2: Literature review.........................................................................................9
2.1 Introduction.........................................................................................................9
2.2 Restaurant industry in United Kingdom..............................................................9
2.3 Factors affecting choice of restaurants for consumers.....................................13
2.4 Critical success factors for restaurants.............................................................16
2.5 Gap in literature................................................................................................18
2.6 Implication.........................................................................................................18
2.7 Summary...........................................................................................................18
Chapter 3: Research Methodology.............................................................................19
3.1Research philosophy and strategy....................................................................19
3.2 Data collection Techniques...............................................................................21
3.3 Analysis Framework..........................................................................................21
3.4 Limitations.........................................................................................................21
3.5 Summary...........................................................................................................22
Chapter 4: Findings....................................................................................................23
Introduction.............................................................................................................23
Reliability and Validity.............................................................................................23
Findings...................................................................................................................28
Chapter 5: Conclusion................................................................................................48
Introduction.............................................................................................................48
⊘ This is a preview!⊘
Do you want full access?
Subscribe today to unlock all pages.
Trusted by 1+ million students worldwide
3BUSINESS MANAGEMENT DISSERTATION
Conclusion..............................................................................................................48
Recommendations..................................................................................................50
Limitation and contribution......................................................................................50
Avenues of Future Research..................................................................................51
References.................................................................................................................52
Paraphrase This Document
Need a fresh take? Get an instant paraphrase of this document with our AI Paraphraser
4BUSINESS MANAGEMENT DISSERTATION
Topic: Critical success factors for Indian food industry in Scotland- “A case study of
Mother India”
Chapter 1: Introduction
1.1 Background
This study aims to examine and highlight the critical success factors for the
Indian restaurants in Scotland and United Kingdom. Mother India has been chosen
as the case study for the given research. There has been significant increase in
demand for Indian food in the global market and Britain as consists of more than 1.5
million Indian immigrants and other immigrants from Asian country. This makes
United Kingdom one of the most diverse ethnic food culture in the global market.
Scotland has also adopted or developed the cultural affinity for Indian food where
many considered that the famous chicken tikka butter masala was invented in
Glasgow.
However, current predictions show that one in every two curry houses in
Britain are expected to close within the next 10 years. It shows that almost 17,000
restaurants serving Indian food will close down within the next decade
(www.telegraph.co.uk 2017). As per the chairman of the Asian catering foundation in
United Kingdom claimed that Indian restaurants have been facing problems
regarding rising costs, shortage of chefs and other staffs (www.telegraph.co.uk
2017). Moreover, the major concern for the organisations is inability to address the
change in demand of the consumers in the market. Moreover, these restaurants
have also failed to incorporate modern technology into the organisational processes
which has also a reason for diminishing business. These restaurants are very insular
and have failed to consider the restaurants from different cuisines as competitors
(www.telegraph.co.uk 2017). Thus, they have capitalise on the modern marketing
opportunities such as use of social media platforms and effective consumer
engagement. It clearly highlighted that these are rigid in nature and are not willing to
take heed into these signs of bankruptcy. These restaurants are losing their
originality and regional touch and majority of the dishes offered are having a British
touch to it which is diminishing the authenticity of the food served.
This shows that it is essential for the Indian restaurants in Scotland and
United Kingdom to keep up with the changes in the consumer demand and needs for
5BUSINESS MANAGEMENT DISSERTATION
managing their competitive sustainability. This is the reason that this topic has been
chosen for the research so that the research can highlight and bring about
awareness among the managers in ethnic restaurants about the critical success
factors in the modern industry. There has been significant increase in homogeneity
among consumer behaviour as the diversity in population in countries have
increased significantly. Agarwal and Dahm, (2015) suggested that there is a need for
standardization of marketing practices along with standards of price, product,
promotion and distribution. However, some suggest customisation as per the needs
of the consumers is significantly important in the industry. The research problem
shows that there has been significant need among the organisations to make change
to their existing business and marketing strategies to improve their consumer base
and sales volume. However, it is essential to understand the background of the
restaurant that is taken as the case so that it makes easier to develop a research
design suited to needs of the given case.
Mother India restaurant was first opened in Glasgow, Scotland in the year of
1990 (Motherindia.co.uk 2019). The concept of the restaurant was to provide
authentic home cooked Indian food to their consumers. The food chain expects to
provide food of highest quality to their consumers at reasonable and affordable
prices. The company has always been specially focused on maintaining their
standards of quality and is one of the top Indian authentic restaurants in Scotland
(Motherindia.co.uk 2019). The company always has been diligent and have trying to
refresh the menu from time to time depending on seasonal produce to provide new
dishes by keeping the authentic famous dishes intact (Motherindia.co.uk 2019). The
restaurant tries to provide a very friendly environment and attracts crowd from
different ethnic background. Mother India café has been quite popular for their dining
services but also for their takeaways and people are regular in queues waiting to
taste exotic delicacies from the subcontinent.
1.2 Aim and Objectives
The purpose of the study is to critically evaluate the different elements that
are necessary for success for modern Indian restaurants in Scotland. This study
aims to address the research problem where majority of the Indian restaurants have
failed to keep up with the change in consumer needs. Therefore, it is key to identify
⊘ This is a preview!⊘
Do you want full access?
Subscribe today to unlock all pages.
Trusted by 1+ million students worldwide
6BUSINESS MANAGEMENT DISSERTATION
the factors necessary for sustainability and developing competitive advantage. The
objectives of the study are defined below:
To examine the critical success factors essential for managing sustainability
and gaining competitive advantage in Scotland
To recommend suitable strategies for managing sustainable competitive
advantage
Research question
What are the critical success factors essential for managing sustainability and
gaining competitive advantage in Scotland?
1.3 Overview of the Research methodology adopted
This study has developed a single research design to highlight the key
success factors for Indian restaurants in the Scotland food industry. Research
methodology has followed the research onion developed by Saunders to highlight
the method, instruments and frameworks necessary for data collection. The study
has chosen a positivist philosophy of research and deductive approach has been to
chosen to perform quantitative analysis of data. The research has used survey
questionnaire as the research instrument where the survey has identified critical
factors of success from the literature review and tested them. The survey
questionnaire used demographic questions to identify the background of the
respondents and questions on five point Likert scale to identify the factors significant
to the research problem. The survey has used stratified random sampling technique
to choose 100 consumers for understanding the change in consumer needs and
wants. The analysis of the data collected has been performed using statistical
techniques and the research has been successful in developing a descriptive
research design. The reliability and validity of the collected data has also been
evaluated using statistical technique. Moreover, the study has complied with all the
ethical guidelines and made sure that no harm has come to any of the respondents.
1.4 Dissertation Structure
This research paper has been divided into chapters and each chapter has
significant role in providing the overall portrait of the research problem and the
findings of the study. The initial chapter of the dissertation is the Introduction chapter
which provides detailed information on the outline of the project, research problem,
Paraphrase This Document
Need a fresh take? Get an instant paraphrase of this document with our AI Paraphraser
7BUSINESS MANAGEMENT DISSERTATION
research rationale, the objectives of the research and the methodology formulated to
generate findings. The introduction chapter an overview of the purpose of performing
this study and its relevance to the modern business environment. The second
section of the research is the literature review which critically evaluates past
literature on critical success factors in the food industry to highlight the key success
factors and the gap in existing literature. The conceptual framework is developed
based on the factors evaluated and helped in developing the research design based
on the theoretical framework.
Research methodology is the third chapter in the research and creates a
research design necessary to address data collection and analysis. This chapter
highlights the assumptions made in the research and the overall limitation of the
developed research methodology. The fourth chapter is the data description and
discussion that provides a detailed description of the data collected and results
developed based on the analysis conducted. This section of the chapter links the
results with the review of literature in chapter two to provide discussion. The final
chapter is the conclusion which provides a detailed summary of the overall research.
The conclusion provides the understanding of the purpose of conducting the
research and purpose of the study. On the other hand, it also provides a description
of the arguments made in the past research and the methodology developed. It also
highlights the key findings and links with the objectives. The study also provides
recommendations based on the results for practical implication. On the contrary, the
report ends with the limitation of the study and the avenues of further research.
Chapter 5: Conclusion and
Recommendation
Chapter 4: Data Analysis
Chapter 1: Introduction
Chapter 2: Literature Review
Chapter 3: Research Methodology
8BUSINESS MANAGEMENT DISSERTATION
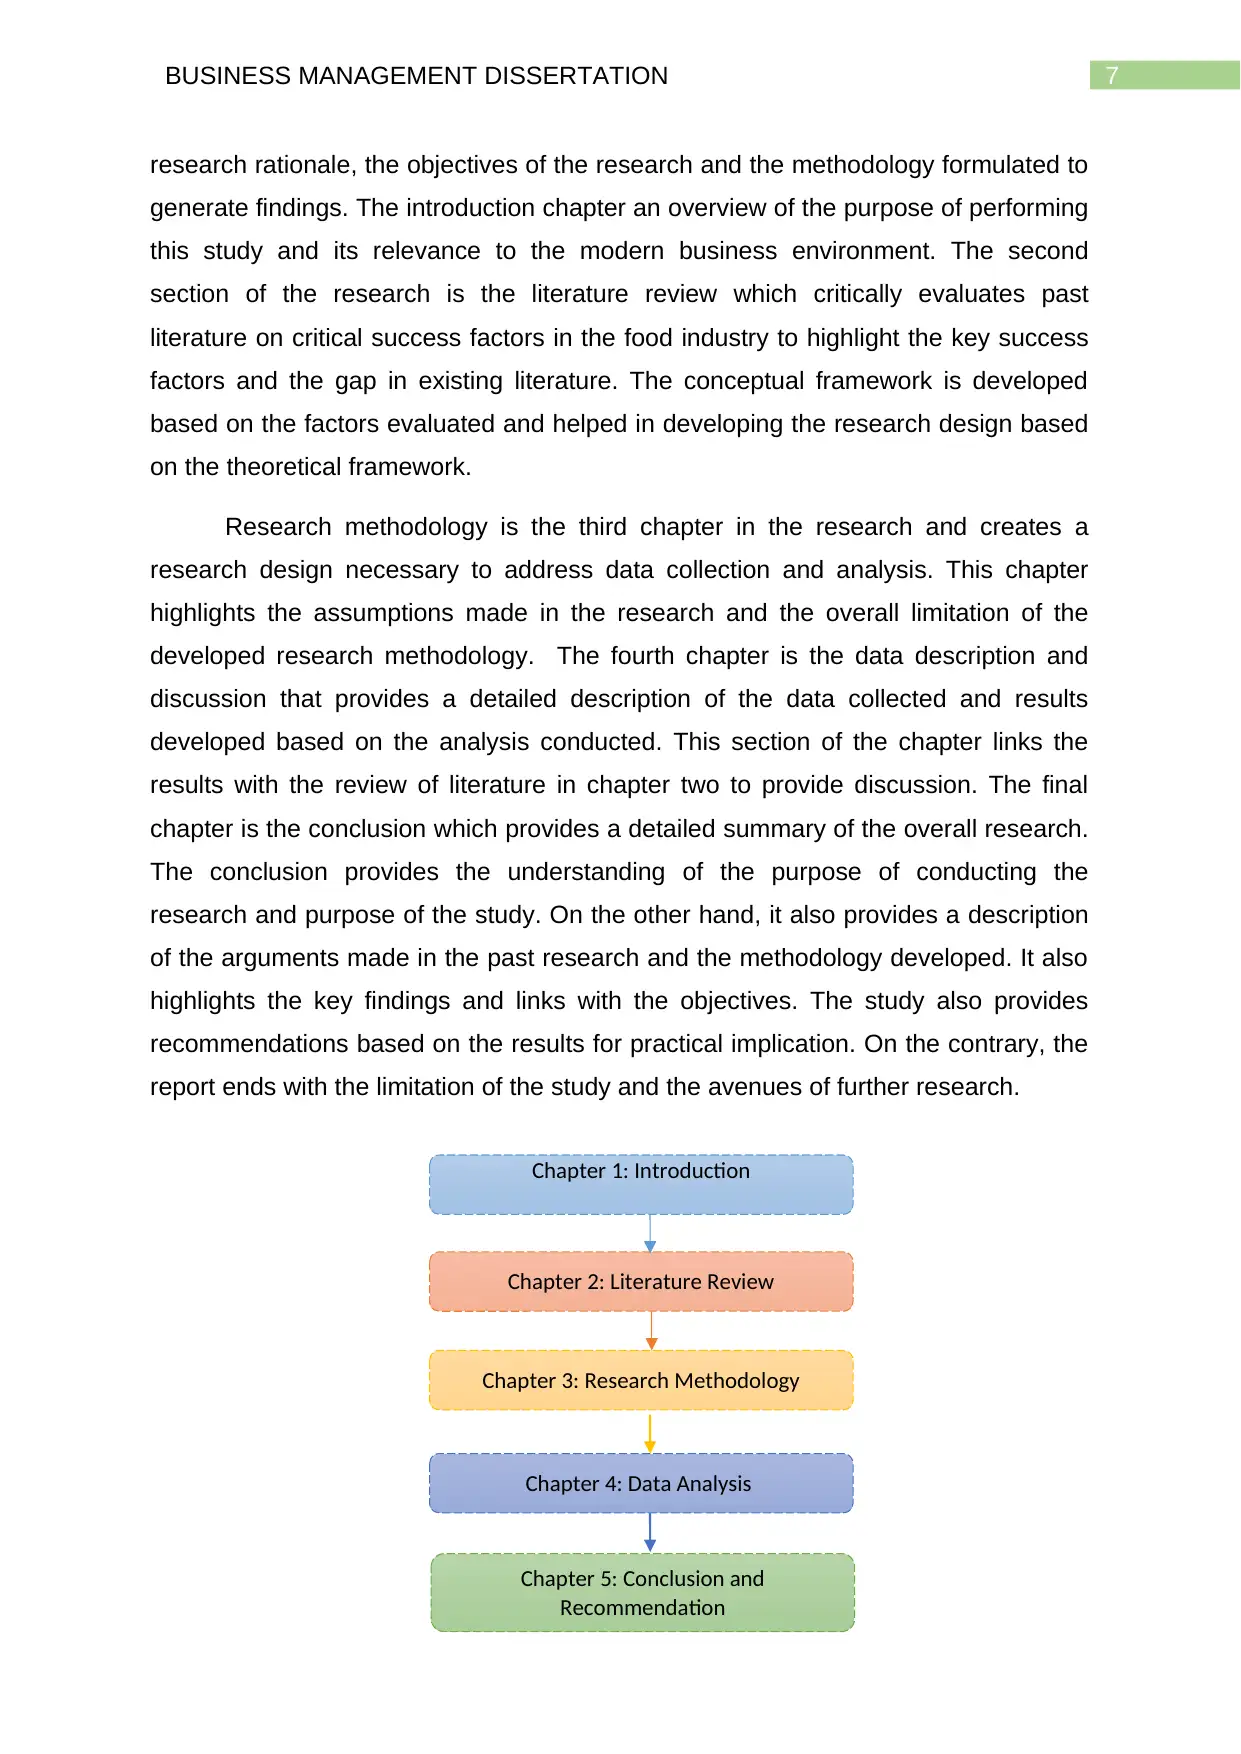
Figure 1: Structure of the research paper
Source: (As created by author)
1.5 Summary
Introduction chapter has shown that currently the Indian restaurants are facing
threat of close down even though the majority of the restaurants are popular and
have high demand in the market. These restaurants have not been able to keep with
up with the change in the market trends. Moreover, these restaurants have also
failed to incorporate modern technology into the organisational processes which has
also a reason for diminishing business. This the reason that it is essential to highlight
the key success factors for the Indian restaurants in the industry and aims to provide
recommendations based on the findings. The next chapter is the continuation of the
report and develops a synthesis on past literature to highlight the key success
factors. The chapter has presented arguments and opinions of past authors on the
given research topic and has affectively described the gap in literature.
⊘ This is a preview!⊘
Do you want full access?
Subscribe today to unlock all pages.
Trusted by 1+ million students worldwide
9BUSINESS MANAGEMENT DISSERTATION
Chapter 2: Literature review
2.1 Introduction
This chapter critically examines the past literature on critical success factors
in the restaurant industry to highlight the opinion and arguments of different authors.
There has been global expansion of the food service industry and the business of
different restaurants seemed uncertain due to the increase in competition in the
market. Therefore, it is essential for organisations to understanding the factors that
impact the buying behaviour of the consumers and the elements necessary for
success and sustainability in the industry. This is the reason that the literature
expects to critically evaluate the factors affecting purchase decision of the
consumers in the food service industry.
2.2 Restaurant industry in United Kingdom
The restaurant industry in the United Kingdom has gone through significant
growth and there has been increase in expenditure from consumers on restaurants
and cafes which has reached to 88 billion GBP in the year of 2017
(www.statista.com 2017). Moreover, there has been steady increase in the number
of restaurants and cafes operating in their region contributing up to 18 billion GBP to
the economy in the year of 2016 (www.statista.com 2017). The statistics shows that
the number of restaurants in the United Kingdom have reached to almost 87,000 in
the year of 2017 with revenue generation of 37.7 billion GBP. Moreover, the
consumer spending on food services have risen to 92 billion GBP (www.statista.com
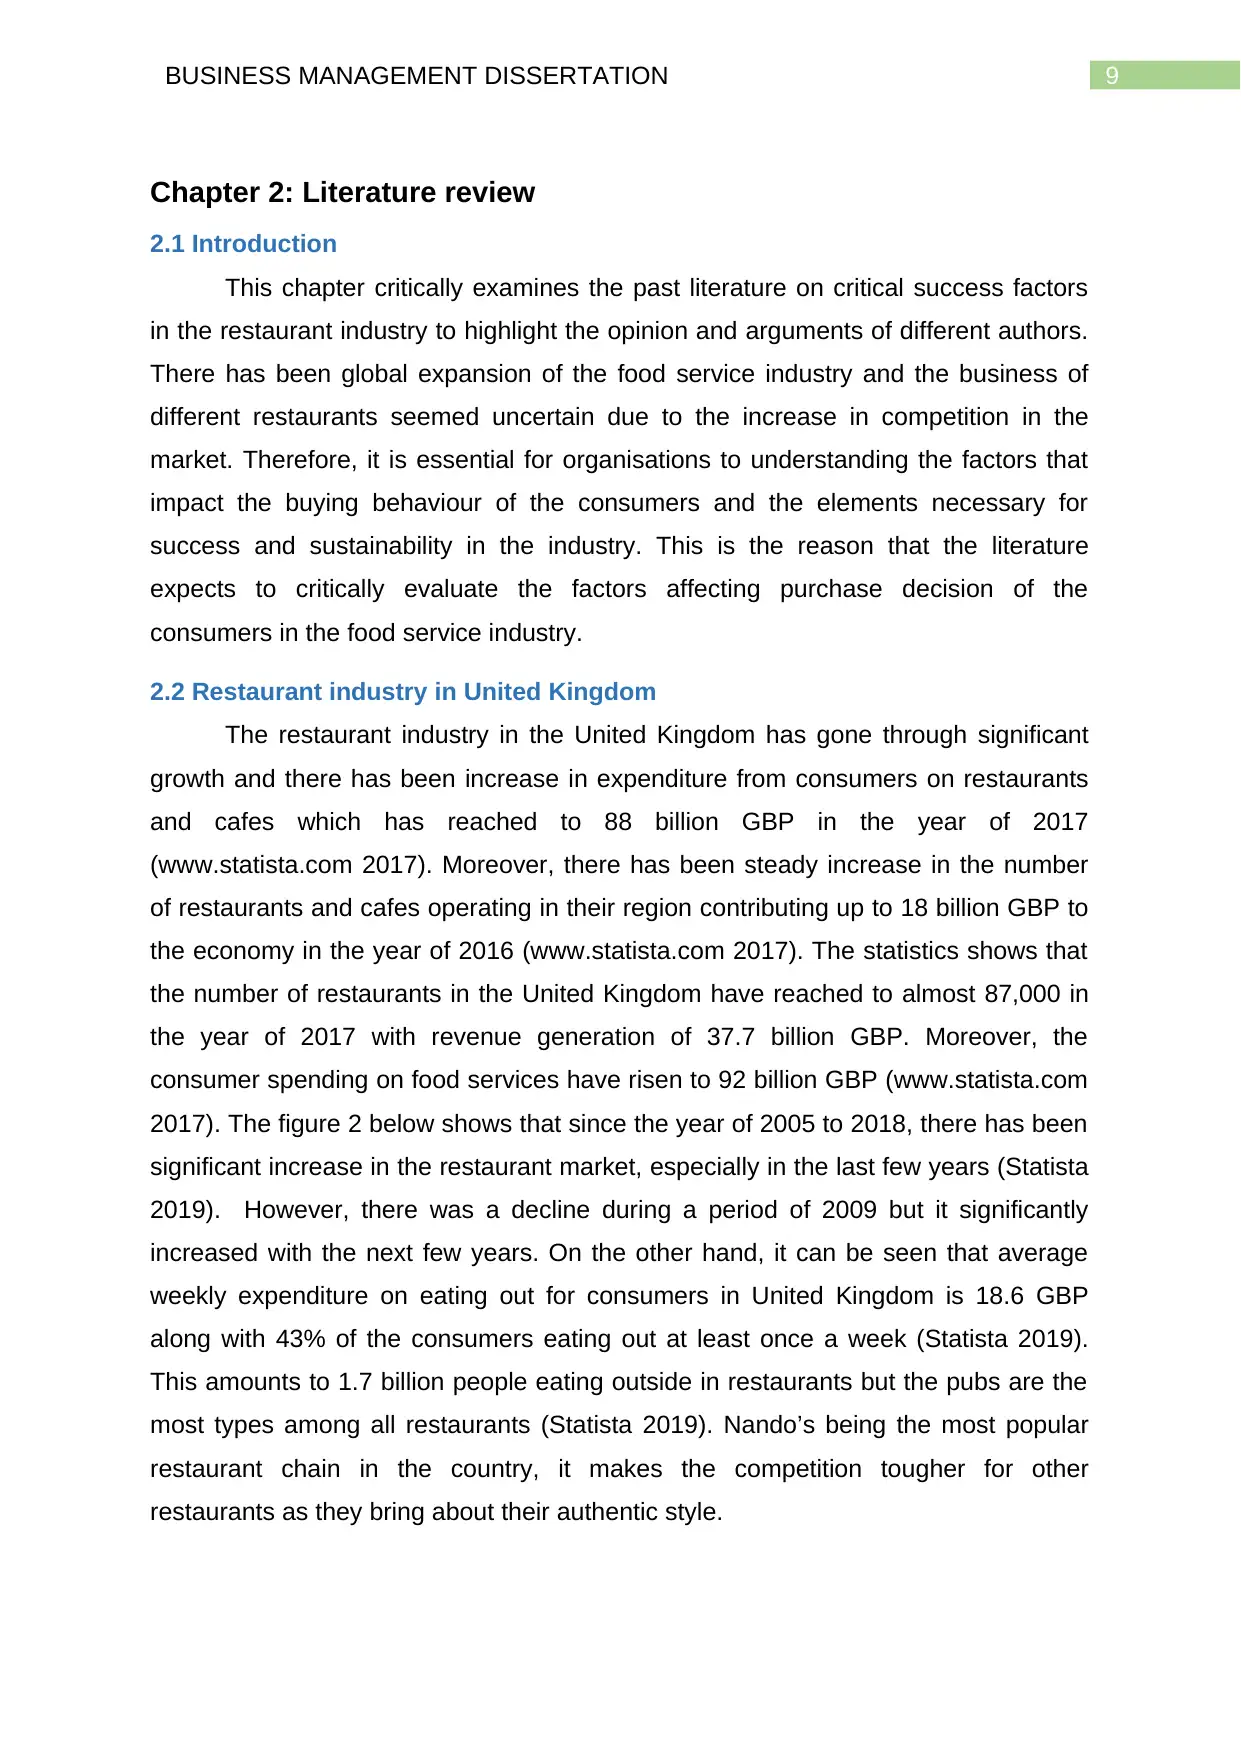
2017). The figure 2 below shows that since the year of 2005 to 2018, there has been
significant increase in the restaurant market, especially in the last few years (Statista
2019). However, there was a decline during a period of 2009 but it significantly
increased with the next few years. On the other hand, it can be seen that average
weekly expenditure on eating out for consumers in United Kingdom is 18.6 GBP
along with 43% of the consumers eating out at least once a week (Statista 2019).
This amounts to 1.7 billion people eating outside in restaurants but the pubs are the
most types among all restaurants (Statista 2019). Nando’s being the most popular
restaurant chain in the country, it makes the competition tougher for other
restaurants as they bring about their authentic style.
Chapter 2: Literature review
2.1 Introduction
This chapter critically examines the past literature on critical success factors
in the restaurant industry to highlight the opinion and arguments of different authors.
There has been global expansion of the food service industry and the business of
different restaurants seemed uncertain due to the increase in competition in the
market. Therefore, it is essential for organisations to understanding the factors that
impact the buying behaviour of the consumers and the elements necessary for
success and sustainability in the industry. This is the reason that the literature
expects to critically evaluate the factors affecting purchase decision of the
consumers in the food service industry.
2.2 Restaurant industry in United Kingdom
The restaurant industry in the United Kingdom has gone through significant
growth and there has been increase in expenditure from consumers on restaurants
and cafes which has reached to 88 billion GBP in the year of 2017
(www.statista.com 2017). Moreover, there has been steady increase in the number
of restaurants and cafes operating in their region contributing up to 18 billion GBP to
the economy in the year of 2016 (www.statista.com 2017). The statistics shows that
the number of restaurants in the United Kingdom have reached to almost 87,000 in
the year of 2017 with revenue generation of 37.7 billion GBP. Moreover, the
consumer spending on food services have risen to 92 billion GBP (www.statista.com
2017). The figure 2 below shows that since the year of 2005 to 2018, there has been
significant increase in the restaurant market, especially in the last few years (Statista
2019). However, there was a decline during a period of 2009 but it significantly
increased with the next few years. On the other hand, it can be seen that average
weekly expenditure on eating out for consumers in United Kingdom is 18.6 GBP
along with 43% of the consumers eating out at least once a week (Statista 2019).
This amounts to 1.7 billion people eating outside in restaurants but the pubs are the
most types among all restaurants (Statista 2019). Nando’s being the most popular
restaurant chain in the country, it makes the competition tougher for other
restaurants as they bring about their authentic style.
Paraphrase This Document
Need a fresh take? Get an instant paraphrase of this document with our AI Paraphraser
10BUSINESS MANAGEMENT DISSERTATION
The current market has seen that change in consumer behaviour where the
consumers are willing to dine and eat out on their own terms. The casual dining
sector has been facing immense pressure due to this factor and this makes it
essential for the organisation to optimise channels, locations and occasion in an
authentic way. However, with changing scenario such as Britain’s exit from the EU
and increase in inflation is expected to have negative impact on the disposable
income of the consumers (Statista 2019). The consumers are losing their confidence
which has been shown through the rising cost pressure. This is the reason that there
is fall in the sales growth of the casual dining sector.
Figure 2: Annual expenditure on restaurants and cafés
Source: (Statista 2019)
11BUSINESS MANAGEMENT DISSERTATION
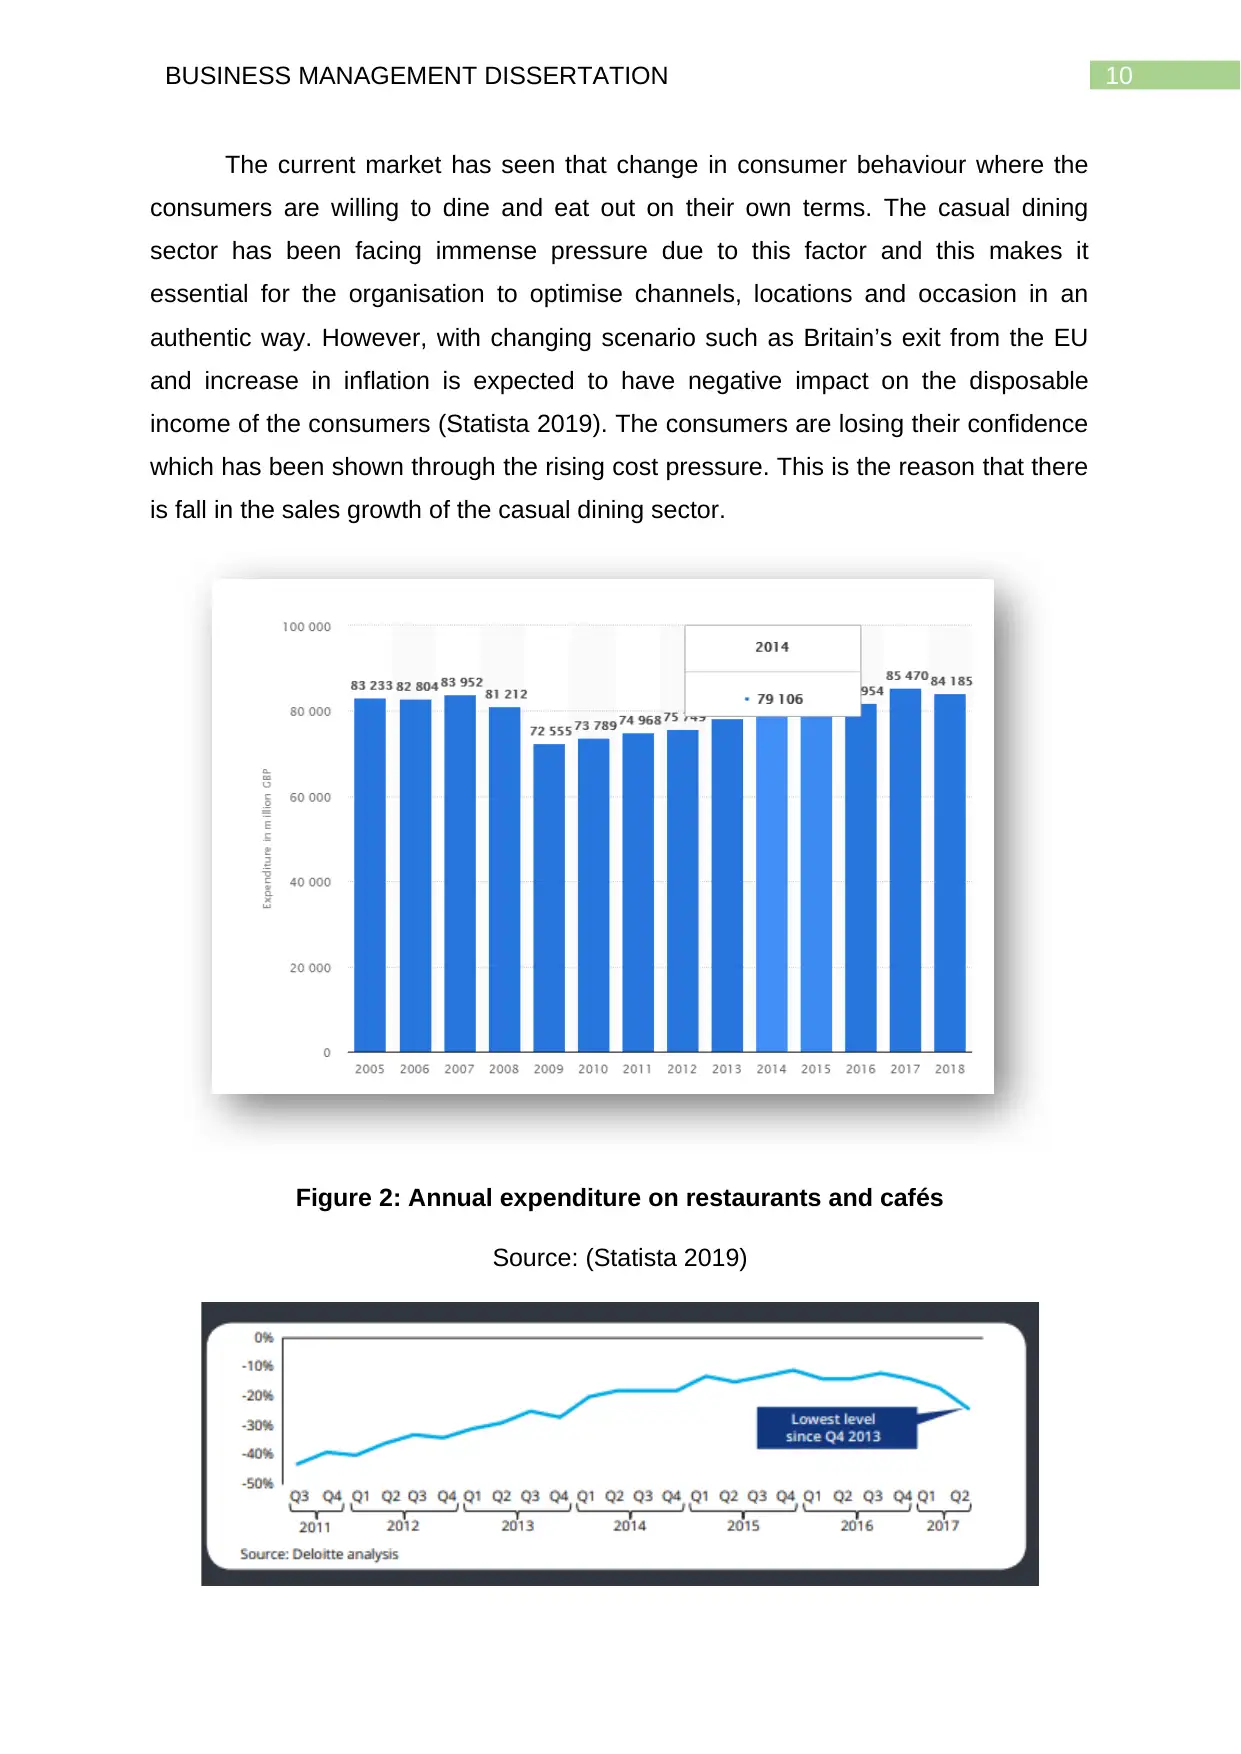
Figure 3: Consumers confidence above the disposable income level
Source: (Www2.deloitte.com 2019)
This shows that the industry performances are largely dependent on the
preferences of the consumers and it has become crucial for the companies to adopt
to the changing preference for gaining competitive advantage. Consumer confidence
and the disposable income has been recovering the year of 2019 with majority of the
consumers returning to full-service dining (Www2.deloitte.com 2019). This has
presented the companies in the industry to be innovative and skilful in providing the
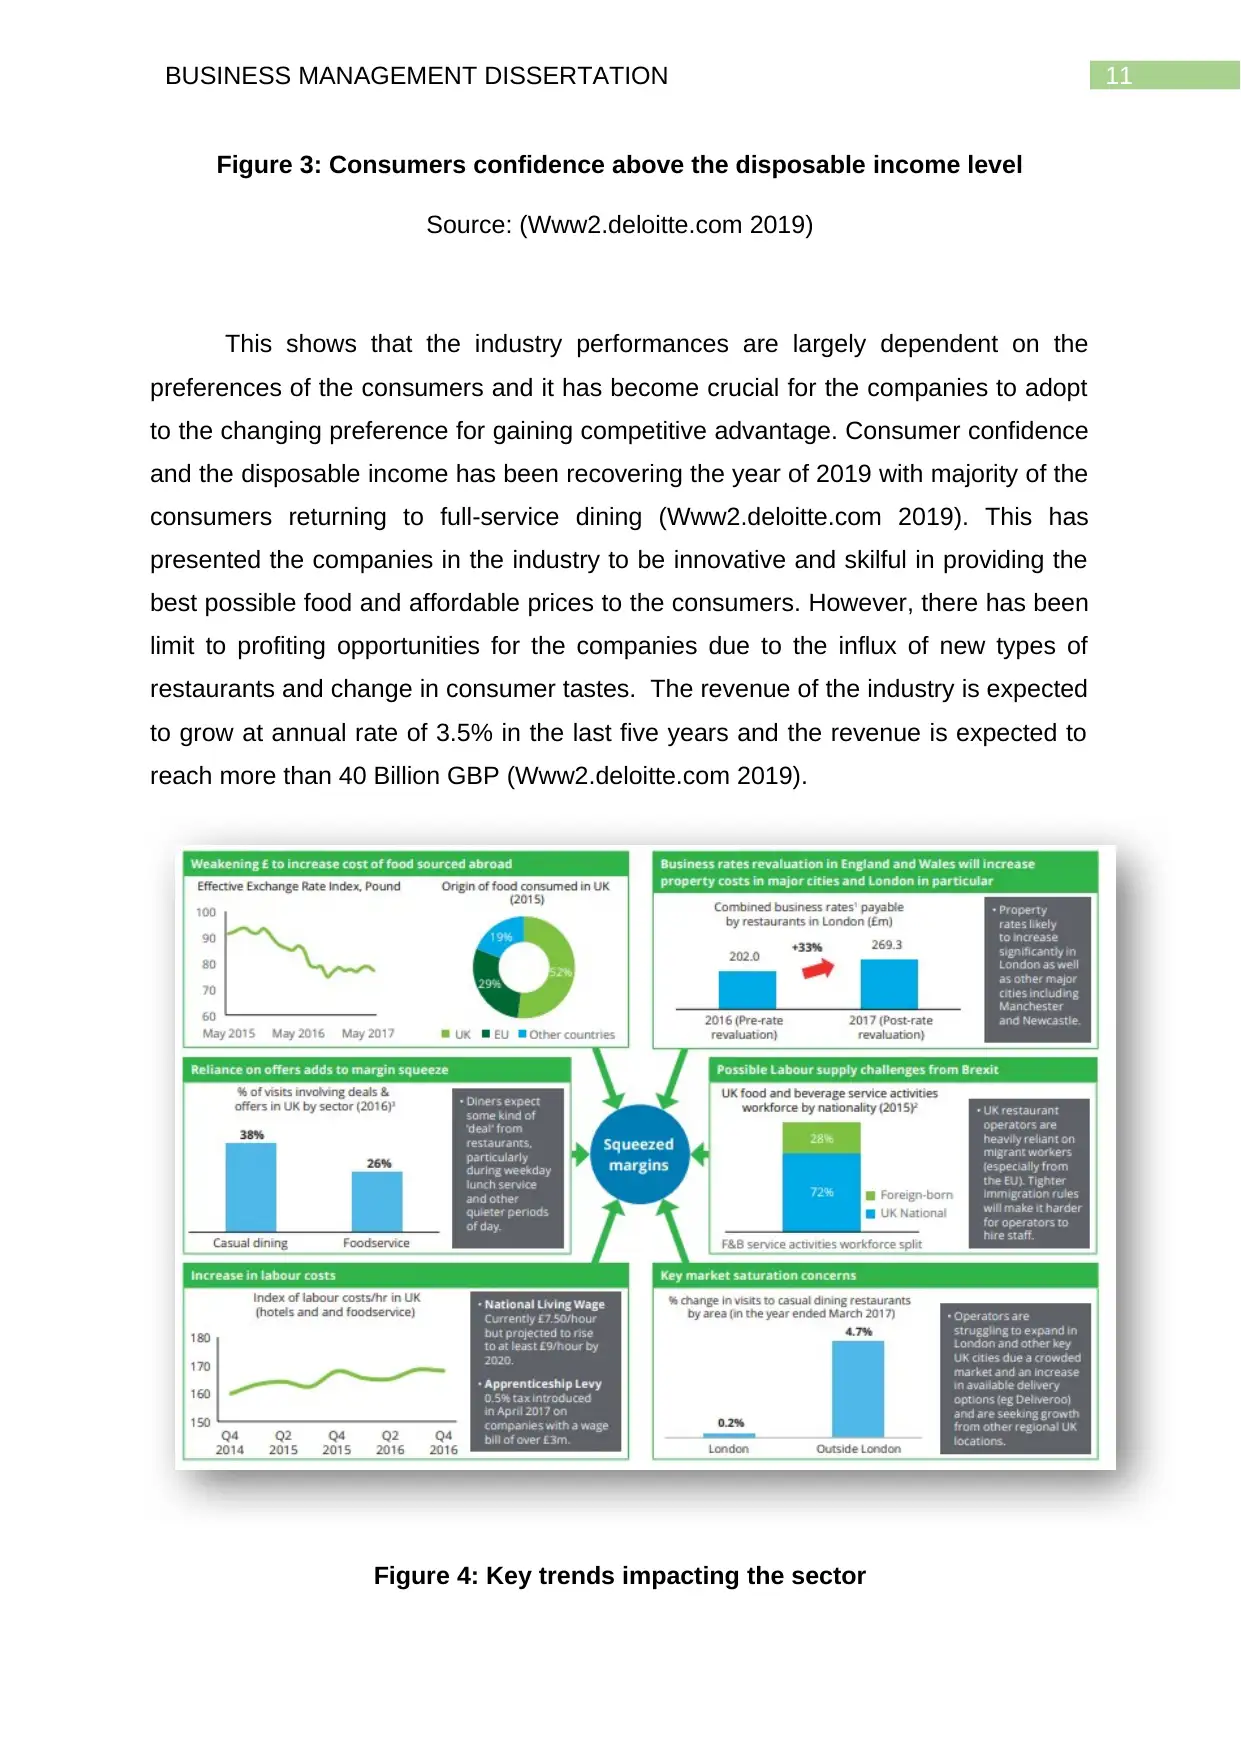
best possible food and affordable prices to the consumers. However, there has been
limit to profiting opportunities for the companies due to the influx of new types of
restaurants and change in consumer tastes. The revenue of the industry is expected
to grow at annual rate of 3.5% in the last five years and the revenue is expected to
reach more than 40 Billion GBP (Www2.deloitte.com 2019).
Figure 4: Key trends impacting the sector
Figure 3: Consumers confidence above the disposable income level
Source: (Www2.deloitte.com 2019)
This shows that the industry performances are largely dependent on the
preferences of the consumers and it has become crucial for the companies to adopt
to the changing preference for gaining competitive advantage. Consumer confidence
and the disposable income has been recovering the year of 2019 with majority of the
consumers returning to full-service dining (Www2.deloitte.com 2019). This has
presented the companies in the industry to be innovative and skilful in providing the
best possible food and affordable prices to the consumers. However, there has been
limit to profiting opportunities for the companies due to the influx of new types of
restaurants and change in consumer tastes. The revenue of the industry is expected
to grow at annual rate of 3.5% in the last five years and the revenue is expected to
reach more than 40 Billion GBP (Www2.deloitte.com 2019).
Figure 4: Key trends impacting the sector
⊘ This is a preview!⊘
Do you want full access?
Subscribe today to unlock all pages.
Trusted by 1+ million students worldwide
1 out of 57
Your All-in-One AI-Powered Toolkit for Academic Success.
+13062052269
info@desklib.com
Available 24*7 on WhatsApp / Email
![[object Object]](/_next/static/media/star-bottom.7253800d.svg)
Unlock your academic potential
Copyright © 2020–2026 A2Z Services. All Rights Reserved. Developed and managed by ZUCOL.