Project Planning Report: BBS013-1, Foundations of Business Management
VerifiedAdded on 2023/01/12
|13
|3315
|60
Report
AI Summary
This report analyzes a project plan focused on a trade show organized by Jones Lang LaSalle (JLL). The report delves into the project's scope, mission, objectives, and deliverables, including Gantt charts, work breakdown structures, and budget considerations. It examines JLL's rationale for the trade show, outlining project milestones, challenges, and potential return on investment. The report also explores project budget components, cost analysis, and various methods for estimating work progress, such as units of work completed and incremental milestones. The report concludes by emphasizing the importance of milestones and the careful use of cost ratio methods for project evaluation. Additionally, the report reflects on the application of scientific evidence and social influences within a business context.
PROJECT PLANNING
REPORT
REPORT
Paraphrase This Document
Need a fresh take? Get an instant paraphrase of this document with our AI Paraphraser

Table of Contents
SUMMARY.....................................................................................................................................3
PART 1............................................................................................................................................4
PART 2..........................................................................................................................................11
REFERENCES..............................................................................................................................13
SUMMARY
Jones Lang LaSalle Incorporated (“Jones Lang LaSalle”, which we may refer to as “we”,
“us”, “our”, “the Company” or “the Firm”) was incorporated in 1997. Jones Lang LaSalle
is a financial and professional services firm specializing in real estate. We offer integrated
services delivered by expert teams worldwide to clients seeking increased value by
owning, occupying or investing in real estate. We have over 200 corporate offices
worldwide and operations in more than 1,000 locations in 70 countries. We have
approximately 48,000 employees, including 28,300 employees whose costs our clients
reimburse. We offer comprehensive integrated real estate and investment management
services on a local, regional and global basis to owner, occupier, investor and developer
clients. We are an industry leader in property and corporate facilities management services,
with a portfolio of approximately 2.6 billion square feet worldwide. We deliver an array of
Real Estate Services (“RES”) across our three geographic business segments: (1) the
Americas, (2) Europe, Middle East and Africa (“EMEA”), and (3) Asia Pacific. LaSalle
Investment Management, a wholly owned member of the Jones Lang LaSalle group that
comprises our fourth business segment, is one of the world’s largest and most diversified
real estate investment management firms with $47 billion of assets under management.
⊘ This is a preview!⊘
Do you want full access?
Subscribe today to unlock all pages.
Trusted by 1+ million students worldwide
PART 1
Project Management Focus – JLL
JLL is headquartered in Chicago, Illinois, and it is the second-biggest open business firm
on the planet. The organization has roughly 91,000 workers in 80 nations, starting at 2019.
Administrations incorporate deals and renting, property the board, venture the executives,
and advancement. In 2014, the association abbreviated its name to JLL for showcasing
purposes, while the lawful name remained Jones Lang LaSalle Incorporated. Previous
organization president Christian Ulbrich succeeded Colin Dyer as CEO in October 2016.
Stephanie Plaines was the CFO, as of March 2019. Sheila Penrose has filled in as the seat
of the board since 2005.
It operates in brokerage industry; having two separate branches which are CBRE
Group and LaSalle Investment Management. As company is planning to organize a trade
show in which different big construction company comes together to present the best for
customer.
Scope of the project:
The main scope behind the trade show is to make individual of UK to get the better house
at lower cost. JLL also combines with different other builder so that more option can be
available for the customer visiting the trade show.
Mission
JLL have the primary objective behind organizing real estate trade show is to rise the
standard of living of the individual those do not who are living on rent. They also think of adding
extra benefits and discounts scheme to the customer which they can enjoy at the time of make
purchase of any property.
Objectives
To make a project or show successful management team of JLL have certain objective by
dividing the work into some phases and making appropriate deadlines. Likewise the set the
objective of making more and more sales through implementation of different sales schemes.
Deliverable of project includes:
Gant Chart of Plan
Paraphrase This Document
Need a fresh take? Get an instant paraphrase of this document with our AI Paraphraser
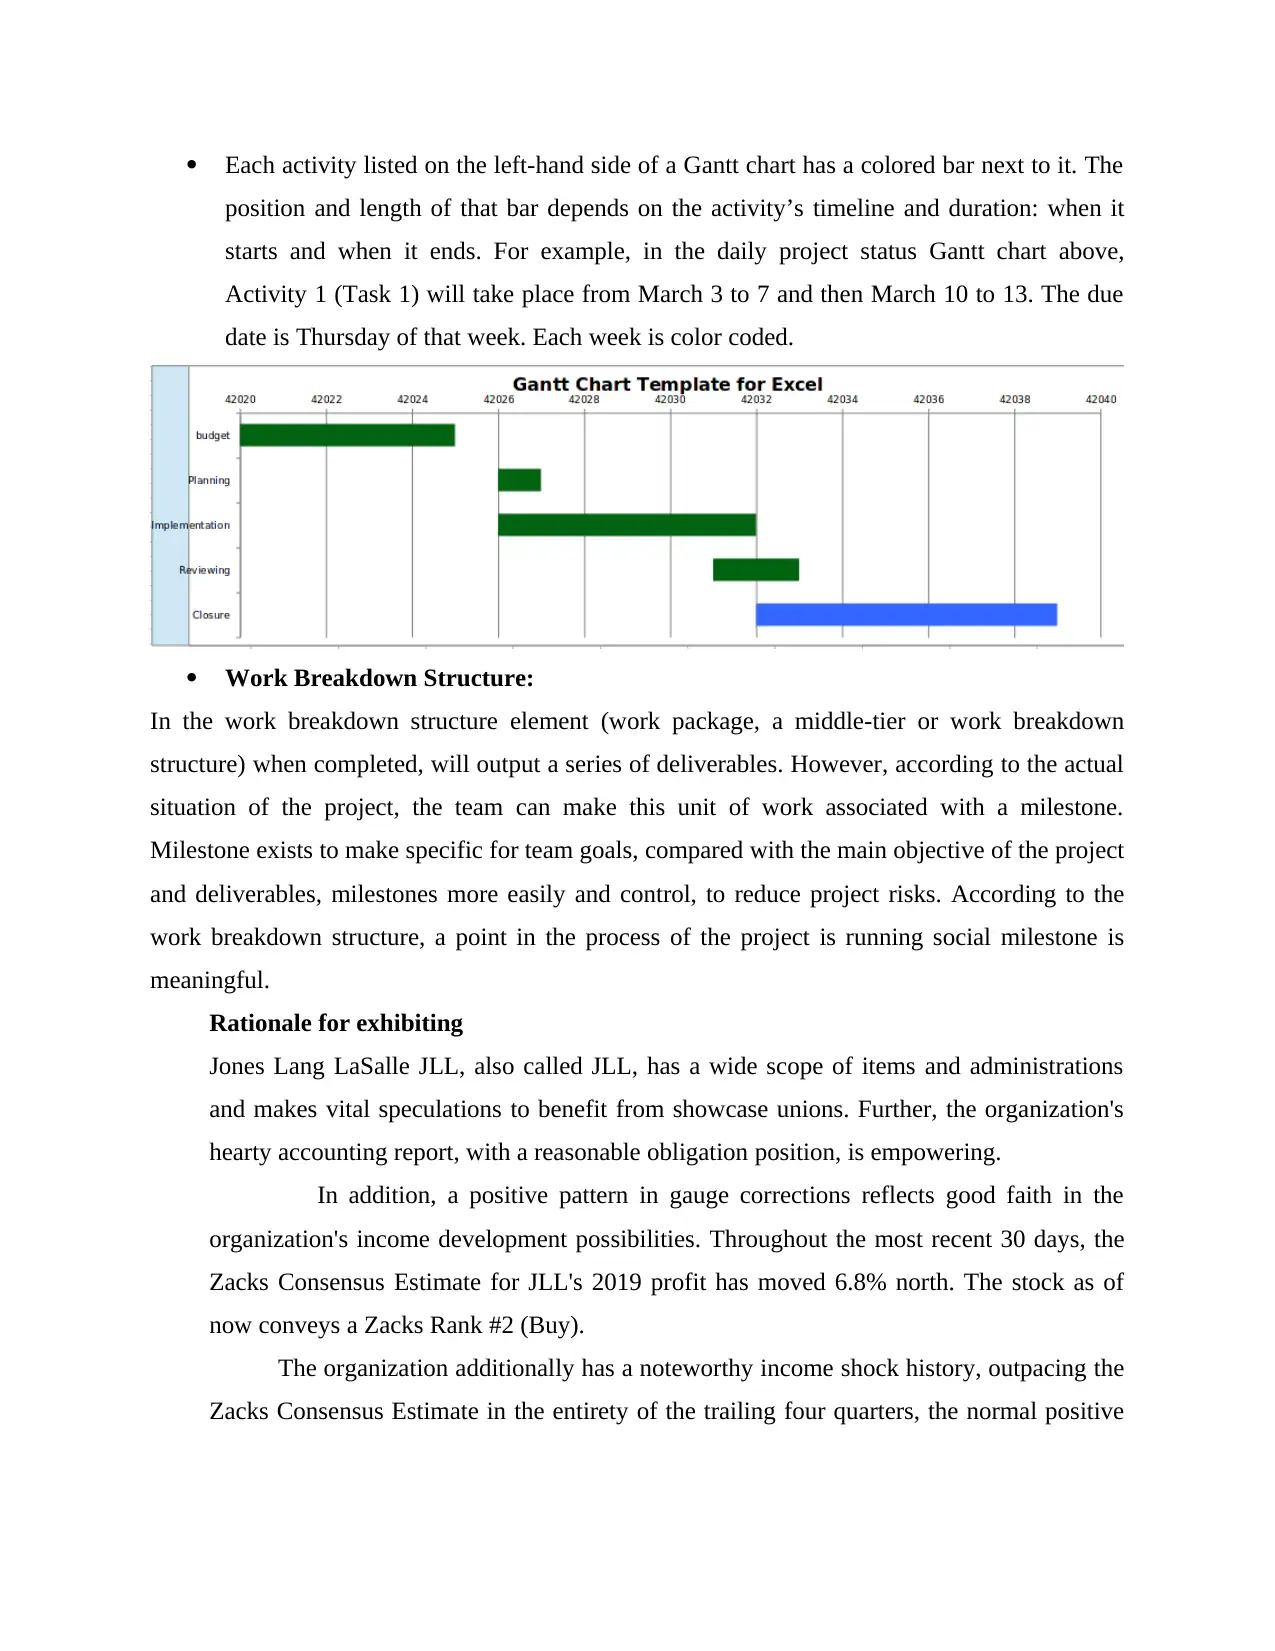
Each activity listed on the left-hand side of a Gantt chart has a colored bar next to it. The
position and length of that bar depends on the activity’s timeline and duration: when it
starts and when it ends. For example, in the daily project status Gantt chart above,
Activity 1 (Task 1) will take place from March 3 to 7 and then March 10 to 13. The due
date is Thursday of that week. Each week is color coded.
Work Breakdown Structure:
In the work breakdown structure element (work package, a middle-tier or work breakdown
structure) when completed, will output a series of deliverables. However, according to the actual
situation of the project, the team can make this unit of work associated with a milestone.
Milestone exists to make specific for team goals, compared with the main objective of the project
and deliverables, milestones more easily and control, to reduce project risks. According to the
work breakdown structure, a point in the process of the project is running social milestone is
meaningful.
Rationale for exhibiting
Jones Lang LaSalle JLL, also called JLL, has a wide scope of items and administrations
and makes vital speculations to benefit from showcase unions. Further, the organization's
hearty accounting report, with a reasonable obligation position, is empowering.
In addition, a positive pattern in gauge corrections reflects good faith in the
organization's income development possibilities. Throughout the most recent 30 days, the
Zacks Consensus Estimate for JLL's 2019 profit has moved 6.8% north. The stock as of
now conveys a Zacks Rank #2 (Buy).
The organization additionally has a noteworthy income shock history, outpacing the
Zacks Consensus Estimate in the entirety of the trailing four quarters, the normal positive
beat being 27.62%. The stock has revitalized 23.8% in the course of recent months,
outflanking the business' expansion of 12.9%.
Project plan milestones
Challenge
Webtrends' activities were spread across five noncontiguous floors. The CEO needed to
solidify their activities, increment coordinated effort and change the way of life of the
organization.
Potential return on investment:
JLL made sure about a recompense from the Landlord, which permitted Webtrends to
make the expensive move of their server farm and inhabitant upgrades with no out of
pocket reserves. Webtrends' inhabitant upgrades were overseen simultaneously with a
$10M center and shell redesign. From the whole project total potential return on
investment will be around $4.5 million.
Project plan and budget:
Budgeted Cost
The budgeted cost is derived from the detailed cost estimate prepared at the start of
the project. Examples of project budgets were presented in Section 12.2. The factors
of cost would be referenced by cost account and by a prose description.
Estimated total cost
The estimated or forecast total cost in each category is the current best estimate of
costs based on progress and any changes since the budget was formed. Estimated
total costs are the sum of cost to date, commitments and exposure. Methods for
estimating total costs are described below.
Cost Committed and Cost Exposure!! Estimated cost to completion in each
category in divided into firm commitments and estimated additional cost
or exposure. Commitments may represent material orders or subcontracts for which
firm dollar amounts have been committed.
⊘ This is a preview!⊘
Do you want full access?
Subscribe today to unlock all pages.
Trusted by 1+ million students worldwide
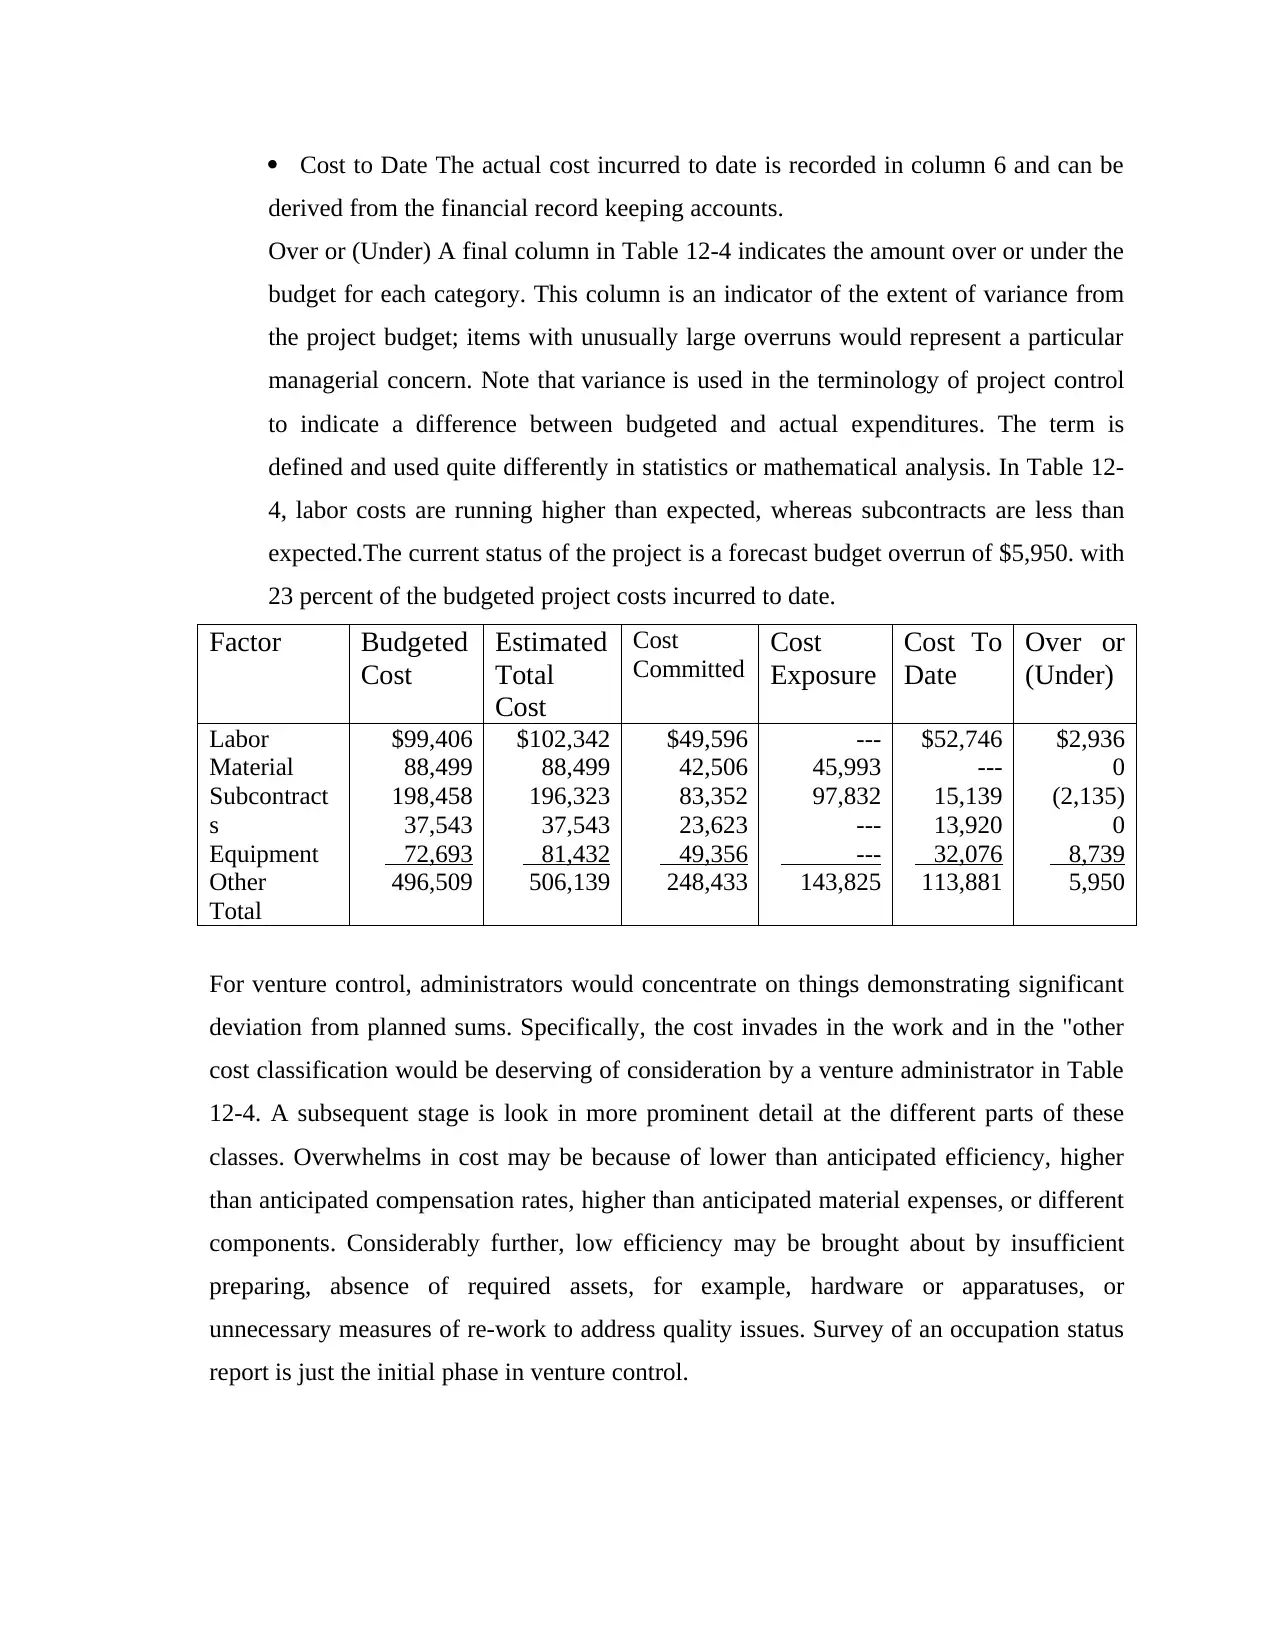
Cost to Date The actual cost incurred to date is recorded in column 6 and can be
derived from the financial record keeping accounts.
Over or (Under) A final column in Table 12-4 indicates the amount over or under the
budget for each category. This column is an indicator of the extent of variance from
the project budget; items with unusually large overruns would represent a particular
managerial concern. Note that variance is used in the terminology of project control
to indicate a difference between budgeted and actual expenditures. The term is
defined and used quite differently in statistics or mathematical analysis. In Table 12-
4, labor costs are running higher than expected, whereas subcontracts are less than
expected.The current status of the project is a forecast budget overrun of $5,950. with
23 percent of the budgeted project costs incurred to date.
Factor Budgeted
Cost
Estimated
Total
Cost
Cost
Committed
Cost
Exposure
Cost To
Date
Over or
(Under)
Labor
Material
Subcontract
s
Equipment
Other
Total
$99,406
88,499
198,458
37,543
72,693
496,509
$102,342
88,499
196,323
37,543
81,432
506,139
$49,596
42,506
83,352
23,623
49,356
248,433
---
45,993
97,832
---
---
143,825
$52,746
---
15,139
13,920
32,076
113,881
$2,936
0
(2,135)
0
8,739
5,950
For venture control, administrators would concentrate on things demonstrating significant
deviation from planned sums. Specifically, the cost invades in the work and in the "other
cost classification would be deserving of consideration by a venture administrator in Table
12-4. A subsequent stage is look in more prominent detail at the different parts of these
classes. Overwhelms in cost may be because of lower than anticipated efficiency, higher
than anticipated compensation rates, higher than anticipated material expenses, or different
components. Considerably further, low efficiency may be brought about by insufficient
preparing, absence of required assets, for example, hardware or apparatuses, or
unnecessary measures of re-work to address quality issues. Survey of an occupation status
report is just the initial phase in venture control.
Paraphrase This Document
Need a fresh take? Get an instant paraphrase of this document with our AI Paraphraser
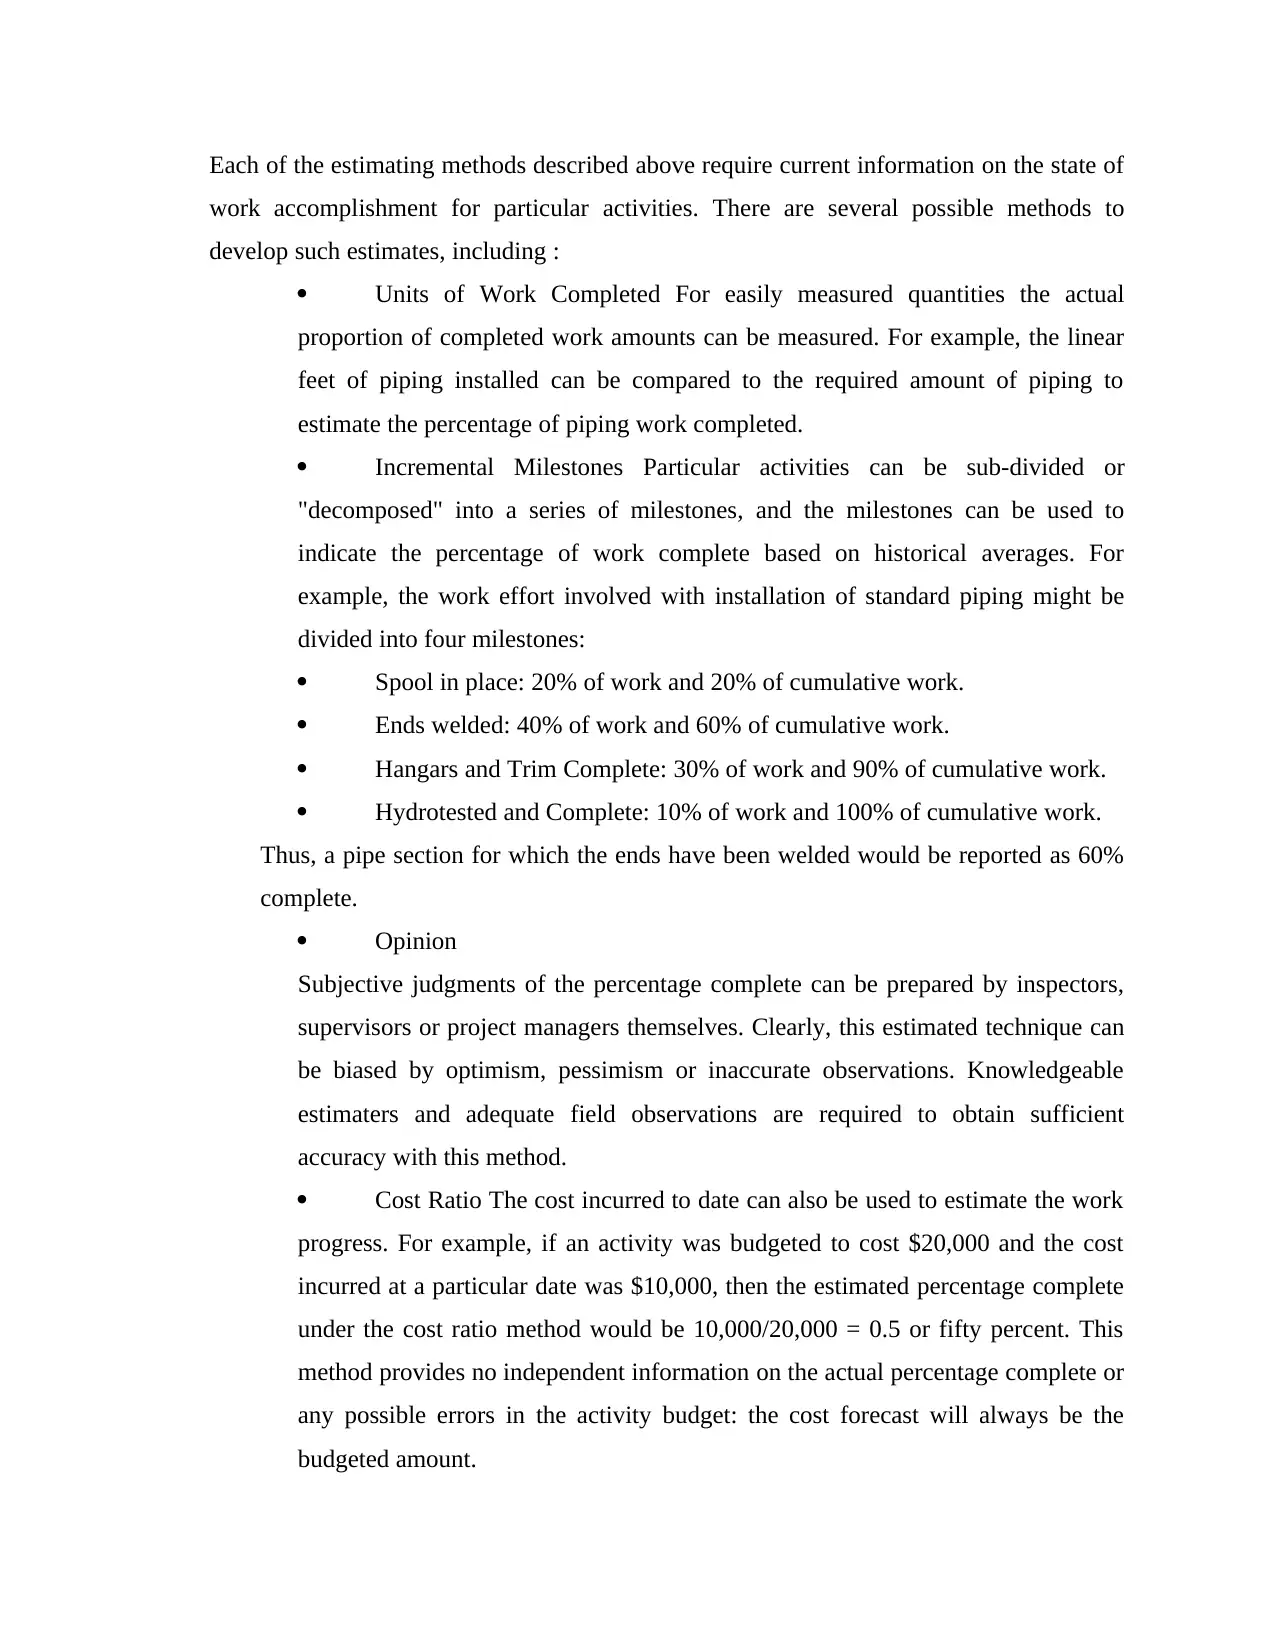
Each of the estimating methods described above require current information on the state of
work accomplishment for particular activities. There are several possible methods to
develop such estimates, including :
Units of Work Completed For easily measured quantities the actual
proportion of completed work amounts can be measured. For example, the linear
feet of piping installed can be compared to the required amount of piping to
estimate the percentage of piping work completed.
Incremental Milestones Particular activities can be sub-divided or
"decomposed" into a series of milestones, and the milestones can be used to
indicate the percentage of work complete based on historical averages. For
example, the work effort involved with installation of standard piping might be
divided into four milestones:
Spool in place: 20% of work and 20% of cumulative work.
Ends welded: 40% of work and 60% of cumulative work.
Hangars and Trim Complete: 30% of work and 90% of cumulative work.
Hydrotested and Complete: 10% of work and 100% of cumulative work.
Thus, a pipe section for which the ends have been welded would be reported as 60%
complete.
Opinion
Subjective judgments of the percentage complete can be prepared by inspectors,
supervisors or project managers themselves. Clearly, this estimated technique can
be biased by optimism, pessimism or inaccurate observations. Knowledgeable
estimaters and adequate field observations are required to obtain sufficient
accuracy with this method.
Cost Ratio The cost incurred to date can also be used to estimate the work
progress. For example, if an activity was budgeted to cost $20,000 and the cost
incurred at a particular date was $10,000, then the estimated percentage complete
under the cost ratio method would be 10,000/20,000 = 0.5 or fifty percent. This
method provides no independent information on the actual percentage complete or
any possible errors in the activity budget: the cost forecast will always be the
budgeted amount.
Conclusion
Milestone marks one of the results or stages of work completed. Specially, the milestone is
closely associated with and deliverables. When reaching milestones, project team members can
subscribe to a project summary, reflection. If obstacles are found, you can take the necessary
measures. Consequently, managers must use the estimated costs to complete an activity derived
from the cost ratio method with extreme caution.Systematic application of these different
estimating methods to the various project activities enables calculation of the percentage
complete or the productivity estimates used in preparing job status reports.
⊘ This is a preview!⊘
Do you want full access?
Subscribe today to unlock all pages.
Trusted by 1+ million students worldwide

Paraphrase This Document
Need a fresh take? Get an instant paraphrase of this document with our AI Paraphraser
PART 2
Last week's lecture presented the idea that science is the most powerful form of evidence.
My position as a student studying both physics and law makes this an important issue for
me and one I was thinking about while watching the 'The New Inventors' television
program last Tuesday, were accompanied by their marketing people. The conversations
were quite contrived, but also funny and enlightening. I realized that the marketing people
used a certain form of evidence to persuade the viewers of the value of the inventions. To
them, this value was determined solely by whether something could be bought or sold—in
other words, whether something was 'marketable'. In contrast, the inventors seemed quite
shy and reluctant to use anything more than technical language, almost as if this was the
only evidence required – as if no further explanation was needed.
Along with the chameleon effect, the conformity and normative social influence discussed
seem extremely applicable to my future teaching work. Conformity is the phenomenon that
occurs when we alter our normal personality and behavior, opting to act more like
members of a certain crowd. One cause of conformity, according to Myers, is normative
social influence, a force that motivates us to strive to escape rejection and to find social
acceptance. In my classroom, I hope to eliminate any desire to conform; This would have
been a great place to explain more about this idea. Explain this experiment and why it is of
interest/importance. Mainly by discouraging normative social influence. One way in which
I can do this is to offer differing opinions myself when most students are of one view,
consequently making my students feel like they do not need to conform to the
overwhelming majority. If I do not do this, students with minority opinions will likely
succumb to normative social influence, not offering their views in fear of rejection. As
evidenced by the experiments of Solomon Asch, even if students have the correct answer,
they will probably not offer their answer if all students are saying a different answer
Consequently, I need to ensure I never let one opinion dominate the classroom too much or
those with differing opinions will feel stifled.
This difference forced me to reflect on the aims of this course—how communication skills
are not generic but differ according to time and place. Like in the 'Research Methodology'
textbook discussed in the first lecture, these communication skills are the result of a form
of triangulation, which I have made into the following diagram
The field notes were written by hand on lined paper. They consisted of jotted notes and
mental triggers (personal notes that would remind me of specific things when it came to
writing the notes up). I took some direct observational notes recording what I saw where
this was relevant to the research questions and, as I was aiming to get a sense of the culture
and working environment, I also made researcher inference notes.
I found the note-taking process itself helpful; as it ensured that I listened carefully and
decoded information. Not all the information I recorded was relevant but noting what I
found informative contributed to my ability to form an overview on re-reading. However,
the reliability of jotted notes alone can be questionable. For example, the notes were not a
direct transcription of what the subjects said but consisted of pertinent or interesting
information.
Rarely did I have time to transcribe a direct quotation, so relied on my own fairly rapid
paraphrasing, which risks changing the meaning. Some technical information was difficult
to note down accurately. A tape recorder would have been a better, more accurate method.
However, one student brought a tape recorder and was asked to switch it off by a
participant who was uneasy about her comments being directly recorded. It seems that
subjects feel differently about being recorded or photographed (as opposed to observers
taking notes), so specific consent should be sought before using these technologies.
Firstly, the most obvious thing that I discovered was the advantage of working as part of a
group . I learned that good teamwork is the key to success in design activities when time
and resources are limited. As everyone had their own point of view, many different ideas
could be produced, and I found the energy of group participation made me feel more
energetic about contributing something.
Secondly I discovered that even the simplest things on earth could be turned into
something amazing if we put enough creativity and effort into working on them. With the
Impromptu Design activities we used some simple materials such as straws, string, and
balloons, but were still able to create some 'cool stuff'. I learned that every design has its
weaknesses and strengths and working with a group can help discover what they are. We
⊘ This is a preview!⊘
Do you want full access?
Subscribe today to unlock all pages.
Trusted by 1+ million students worldwide
1 out of 13
Related Documents


Your All-in-One AI-Powered Toolkit for Academic Success.
+13062052269
info@desklib.com
Available 24*7 on WhatsApp / Email
![[object Object]](/_next/static/media/star-bottom.7253800d.svg)
Unlock your academic potential
Copyright © 2020–2026 A2Z Services. All Rights Reserved. Developed and managed by ZUCOL.