Business Management Report: Development of a Healthy Drink Project
VerifiedAdded on 2023/01/06
|10
|1385
|69
Report
AI Summary
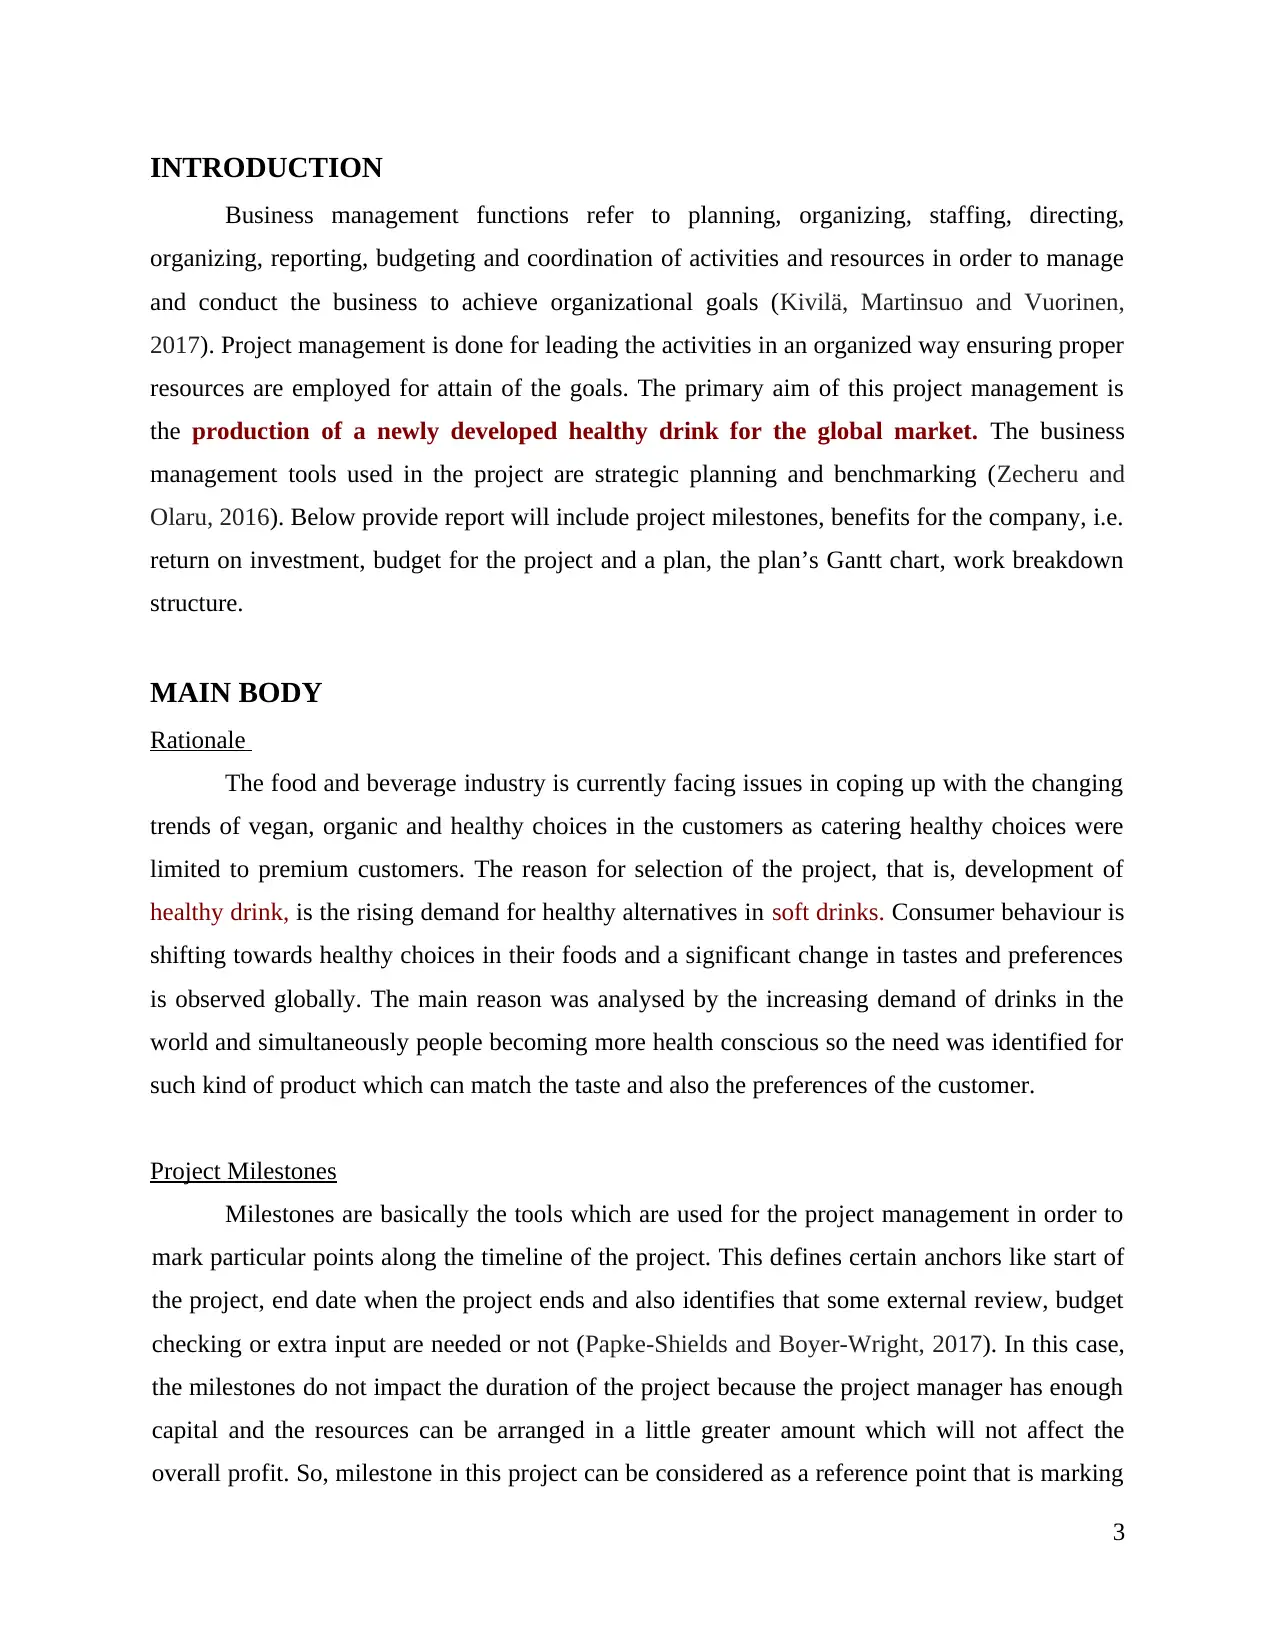
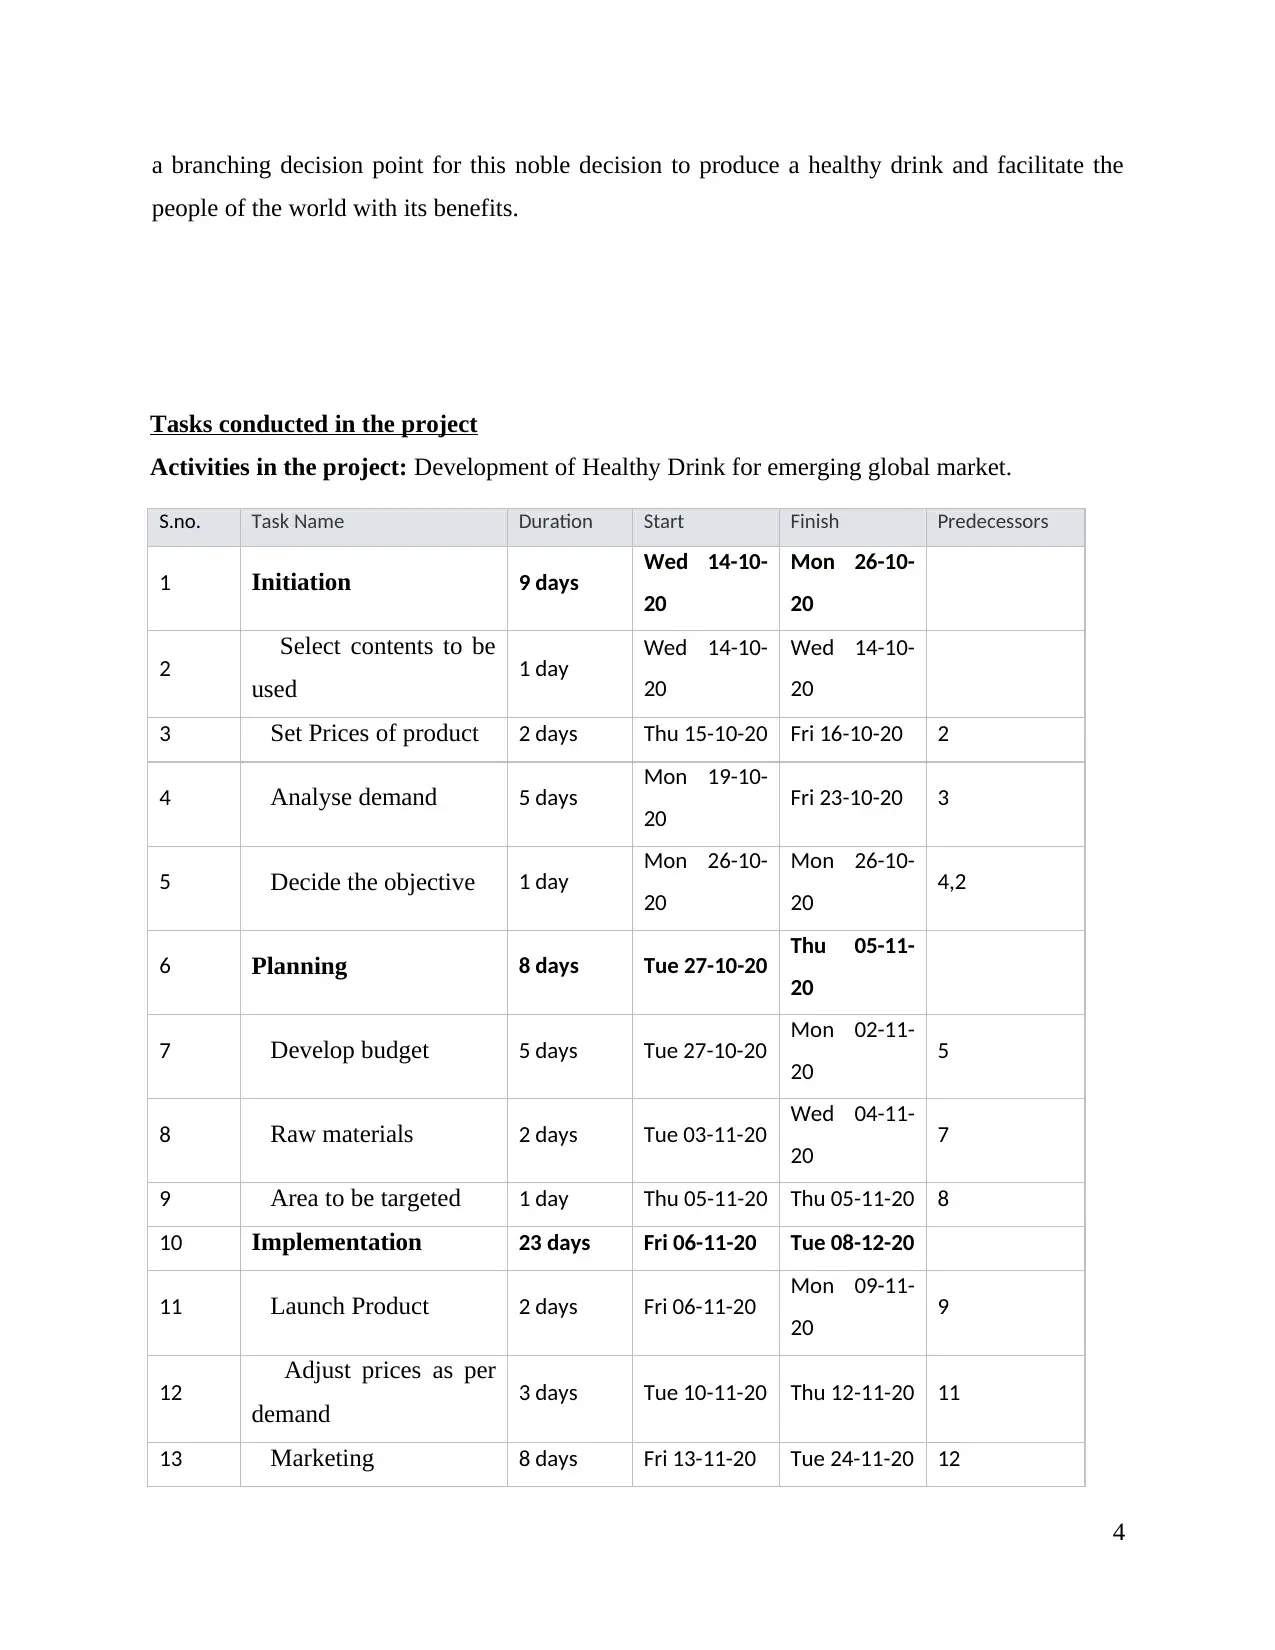
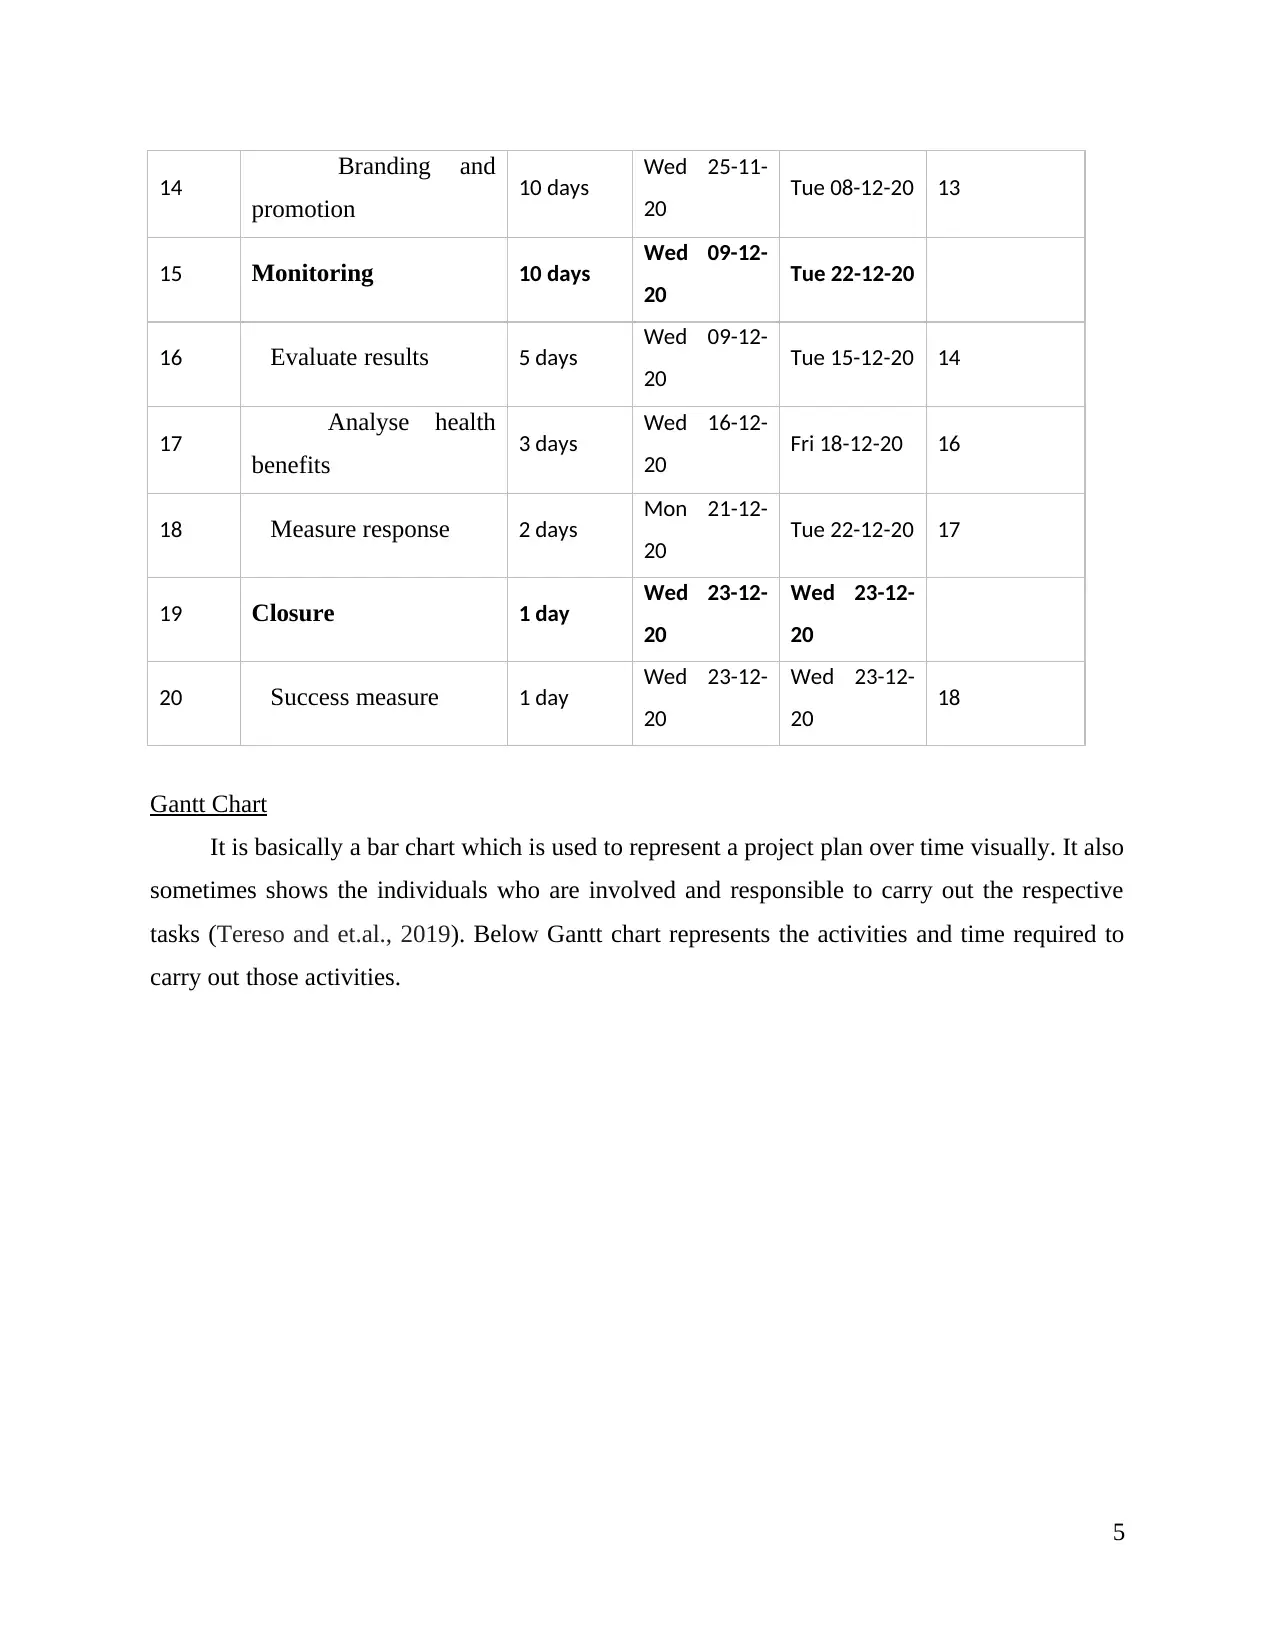
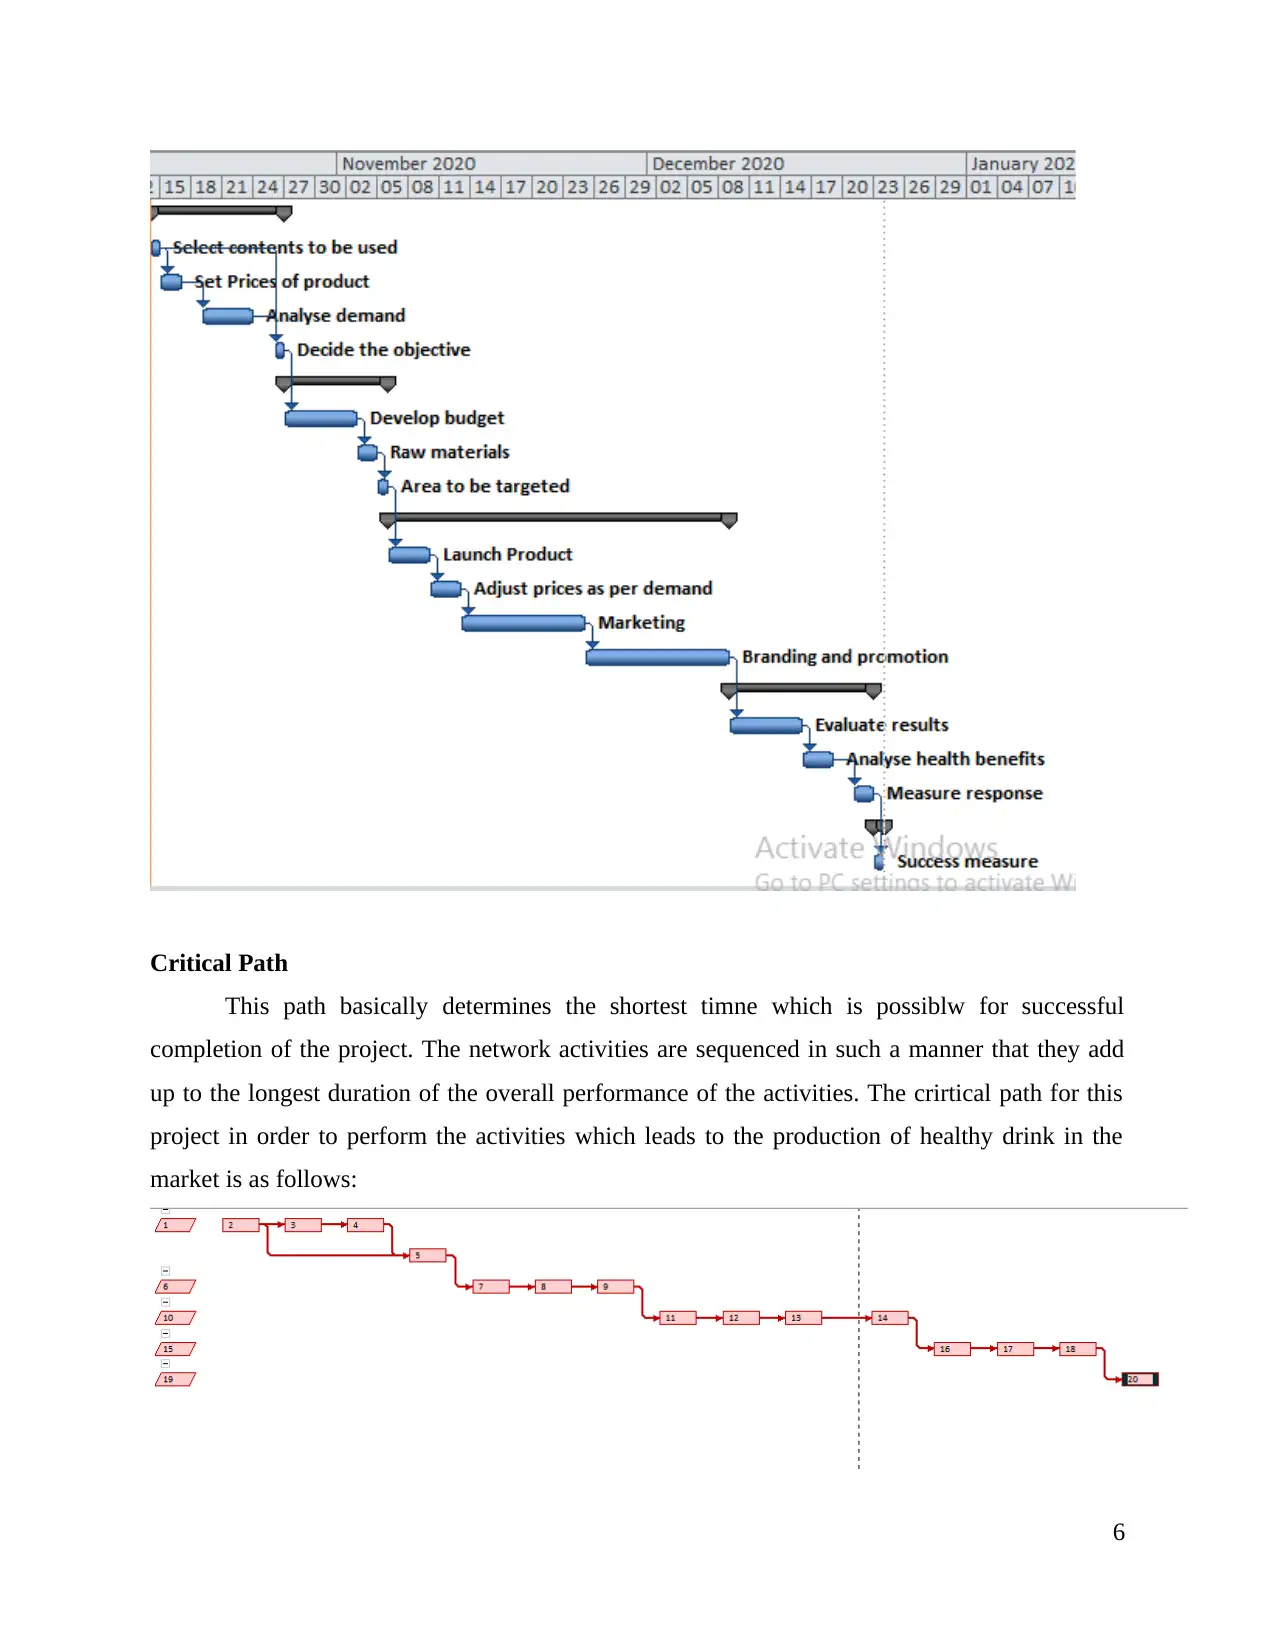
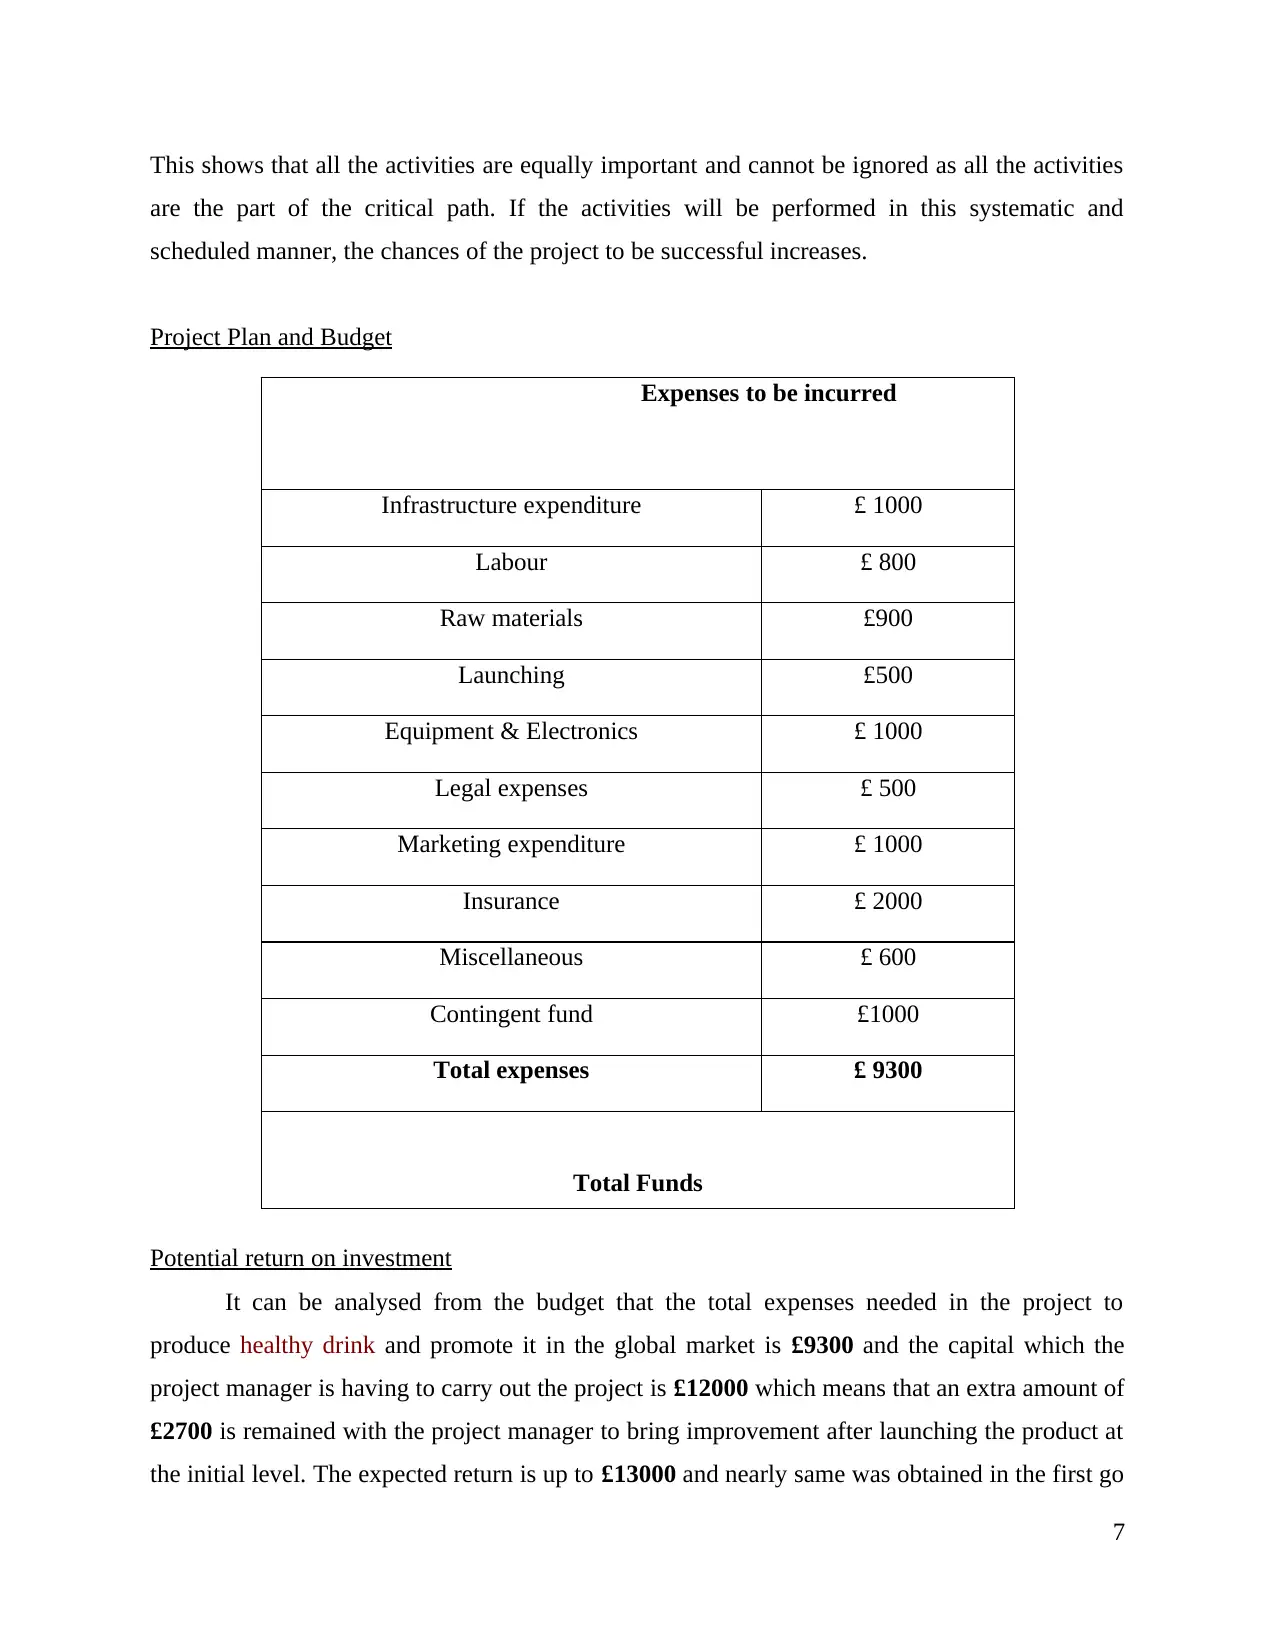
This report details a business management project focused on developing and launching a healthy drink for the global market. It encompasses the rationale behind the project, the rising demand for healthy alternatives in the food and beverage industry, and the identification of project milestones. The report includes a breakdown of tasks, a Gantt chart illustrating the project timeline, a work breakdown structure, and a comprehensive project plan with a detailed budget. Furthermore, it analyzes the potential return on investment (ROI) based on projected expenses and revenue, along with the critical path for project completion. The report highlights strategic planning and benchmarking as key business management tools and concludes by emphasizing the project's potential for both financial success and positive health impacts, supported by references to relevant academic literature.

Foundation of business
management
management
Secure Best Marks with AI Grader
Need help grading? Try our AI Grader for instant feedback on your assignments.

TABLE OF CONTENTS
INTRODUCTION...........................................................................................................................3
MAIN BODY...................................................................................................................................3
Rationale .....................................................................................................................................3
Project Milestones........................................................................................................................3
Tasks conducted in the project.....................................................................................................4
Gantt Chart...................................................................................................................................5
.....................................................................................................................................................8
Project Plan and Budget...............................................................................................................8
Potential return on investment.....................................................................................................9
CONCLUSION................................................................................................................................9
REFERENCES..............................................................................................................................10

INTRODUCTION
Business management functions refer to planning, organizing, staffing, directing,
organizing, reporting, budgeting and coordination of activities and resources in order to manage
and conduct the business to achieve organizational goals (Kivilä, Martinsuo and Vuorinen,
2017). Project management is done for leading the activities in an organized way ensuring proper
resources are employed for attain of the goals. The primary aim of this project management is
the production of a newly developed healthy drink for the global market. The business
management tools used in the project are strategic planning and benchmarking (Zecheru and
Olaru, 2016). Below provide report will include project milestones, benefits for the company, i.e.
return on investment, budget for the project and a plan, the plan’s Gantt chart, work breakdown
structure.
MAIN BODY
Rationale
The food and beverage industry is currently facing issues in coping up with the changing
trends of vegan, organic and healthy choices in the customers as catering healthy choices were
limited to premium customers. The reason for selection of the project, that is, development of
healthy drink, is the rising demand for healthy alternatives in soft drinks. Consumer behaviour is
shifting towards healthy choices in their foods and a significant change in tastes and preferences
is observed globally. The main reason was analysed by the increasing demand of drinks in the
world and simultaneously people becoming more health conscious so the need was identified for
such kind of product which can match the taste and also the preferences of the customer.
Project Milestones
Milestones are basically the tools which are used for the project management in order to
mark particular points along the timeline of the project. This defines certain anchors like start of
the project, end date when the project ends and also identifies that some external review, budget
checking or extra input are needed or not (Papke-Shields and Boyer-Wright, 2017). In this case,
the milestones do not impact the duration of the project because the project manager has enough
capital and the resources can be arranged in a little greater amount which will not affect the
overall profit. So, milestone in this project can be considered as a reference point that is marking
3

a branching decision point for this noble decision to produce a healthy drink and facilitate the
people of the world with its benefits.
Tasks conducted in the project
Activities in the project: Development of Healthy Drink for emerging global market.
S.no. Task Name Duration Start Finish Predecessors
1 Initiation 9 days Wed 14-10-
20
Mon 26-10-
20
2 Select contents to be
used 1 day Wed 14-10-
20
Wed 14-10-
20
3 Set Prices of product 2 days Thu 15-10-20 Fri 16-10-20 2
4 Analyse demand 5 days Mon 19-10-
20 Fri 23-10-20 3
5 Decide the objective 1 day Mon 26-10-
20
Mon 26-10-
20 4,2
6 Planning 8 days Tue 27-10-20 Thu 05-11-
20
7 Develop budget 5 days Tue 27-10-20 Mon 02-11-
20 5
8 Raw materials 2 days Tue 03-11-20 Wed 04-11-
20 7
9 Area to be targeted 1 day Thu 05-11-20 Thu 05-11-20 8
10 Implementation 23 days Fri 06-11-20 Tue 08-12-20
11 Launch Product 2 days Fri 06-11-20 Mon 09-11-
20 9
12 Adjust prices as per
demand 3 days Tue 10-11-20 Thu 12-11-20 11
13 Marketing 8 days Fri 13-11-20 Tue 24-11-20 12
4
Secure Best Marks with AI Grader
Need help grading? Try our AI Grader for instant feedback on your assignments.

14 Branding and
promotion 10 days Wed 25-11-
20 Tue 08-12-20 13
15 Monitoring 10 days Wed 09-12-
20 Tue 22-12-20
16 Evaluate results 5 days Wed 09-12-
20 Tue 15-12-20 14
17 Analyse health
benefits 3 days Wed 16-12-
20 Fri 18-12-20 16
18 Measure response 2 days Mon 21-12-
20 Tue 22-12-20 17
19 Closure 1 day Wed 23-12-
20
Wed 23-12-
20
20 Success measure 1 day Wed 23-12-
20
Wed 23-12-
20 18
Gantt Chart
It is basically a bar chart which is used to represent a project plan over time visually. It also
sometimes shows the individuals who are involved and responsible to carry out the respective
tasks (Tereso and et.al., 2019). Below Gantt chart represents the activities and time required to
carry out those activities.
5

Critical Path
This path basically determines the shortest timne which is possiblw for successful
completion of the project. The network activities are sequenced in such a manner that they add
up to the longest duration of the overall performance of the activities. The crirtical path for this
project in order to perform the activities which leads to the production of healthy drink in the
market is as follows:
6

This shows that all the activities are equally important and cannot be ignored as all the activities
are the part of the critical path. If the activities will be performed in this systematic and
scheduled manner, the chances of the project to be successful increases.
Project Plan and Budget
Potential return on investment
It can be analysed from the budget that the total expenses needed in the project to
produce healthy drink and promote it in the global market is £9300 and the capital which the
project manager is having to carry out the project is £12000 which means that an extra amount of
£2700 is remained with the project manager to bring improvement after launching the product at
the initial level. The expected return is up to £13000 and nearly same was obtained in the first go
7
Expenses to be incurred
Infrastructure expenditure £ 1000
Labour £ 800
Raw materials £900
Launching £500
Equipment & Electronics £ 1000
Legal expenses £ 500
Marketing expenditure £ 1000
Insurance £ 2000
Miscellaneous £ 600
Contingent fund £1000
Total expenses £ 9300
Total Funds
Paraphrase This Document
Need a fresh take? Get an instant paraphrase of this document with our AI Paraphraser

when it was promoted to only some countries. This means that the project is expanded in other
countries can give more potential return on investment.
This can also be calculated by defining the Return on Investment (ROI) ratio which is also
referred as return on assets' ratio by the following formula:
Investment gain (Net Income) / Cost of Investment (Total Assets) = X%
The more profit was expected to be gained because the aim of the project is in favour of the
demands of the customers as well as will benefit the people with good health.
CONCLUSION
The above report highlighted the project plan for producing the healthy drink for the
global market. The budget was calculated, potential return on investment was evaluated, the
activities and the time taken to perform the activities was highlighted. Gantt chart and WBS were
also made to make the project more successful. The above project helps the project manager to
implement the project and attract the large number of customers for gaining a large return on
investment. This also helps the people to improve their health as the contents decided are
completely healthy.
8

REFERENCES
Books and Journals
Kivilä, J., Martinsuo, M. and Vuorinen, L., 2017. Sustainable project management through
project control in infrastructure projects. International Journal of Project
Management. 35(6). pp.1167-1183.
Papke-Shields, K.E. and Boyer-Wright, K.M., 2017. Strategic planning characteristics applied to
project management. International Journal of Project Management, 35(2), pp.169-179.
Tereso, A. and et.al., 2019. Project management practices in private organizations. Project
Management Journal. 50(1). pp.6-22.
Zecheru, V. and Olaru, B.G., 2016. Work Breakdown Structure (WBS) in Project
Management. Review of International Comparative Management/Revista de Management
Comparat International. 17(1).
9

10
1 out of 10
Related Documents

Your All-in-One AI-Powered Toolkit for Academic Success.
+13062052269
info@desklib.com
Available 24*7 on WhatsApp / Email
Unlock your academic potential
© 2024 | Zucol Services PVT LTD | All rights reserved.