Business and Management Statistics: Data Analysis Report CW2
VerifiedAdded on 2022/10/19
|18
|2635
|351
Report
AI Summary
This report presents a comprehensive analysis of student data, focusing on accommodation choices and related variables such as domicile, age, gender, and study habits. Task 1 employs descriptive statistics, including tables and graphs, to analyze quantitative and qualitative variables, exploring relationships between accommodation type and factors like country of origin, age, gender, A-level math status, and part-time work status. Correlation coefficients are used to assess the association between variables. Task 2 involves a scatter plot and regression analysis to examine the relationship between time spent on the internet and commute time. Finally, Task 3 constructs a network diagram and precedence diagram to determine the critical path for a project, including calculations of early start, early finish, late start, late finish, and slack.
Running head: ANALYSING INFORMATION AND DATA ANALYSIS
Analysing Information and Data Analysis
Name of the Student:
Name of the University:
Author Note:
Analysing Information and Data Analysis
Name of the Student:
Name of the University:
Author Note:
Paraphrase This Document
Need a fresh take? Get an instant paraphrase of this document with our AI Paraphraser
1ANALYSING INFORMATION AND DATA ANALYSIS
Table of Contents
Task 1.........................................................................................................................................2
Introduction................................................................................................................................2
Description of data:....................................................................................................................2
Factors affecting type of accommodation:.................................................................................8
Conclusion................................................................................................................................10
Task 2.......................................................................................................................................11
Task 3.......................................................................................................................................13
Reference..................................................................................................................................16
2ANALYSING INFORMATION AND DATA ANALYSIS
Task 1
Table of Content
Introduction................................................................................................................................2
Description of data:....................................................................................................................2
Factors affecting type of accommodation:.................................................................................8
Conclusion................................................................................................................................10
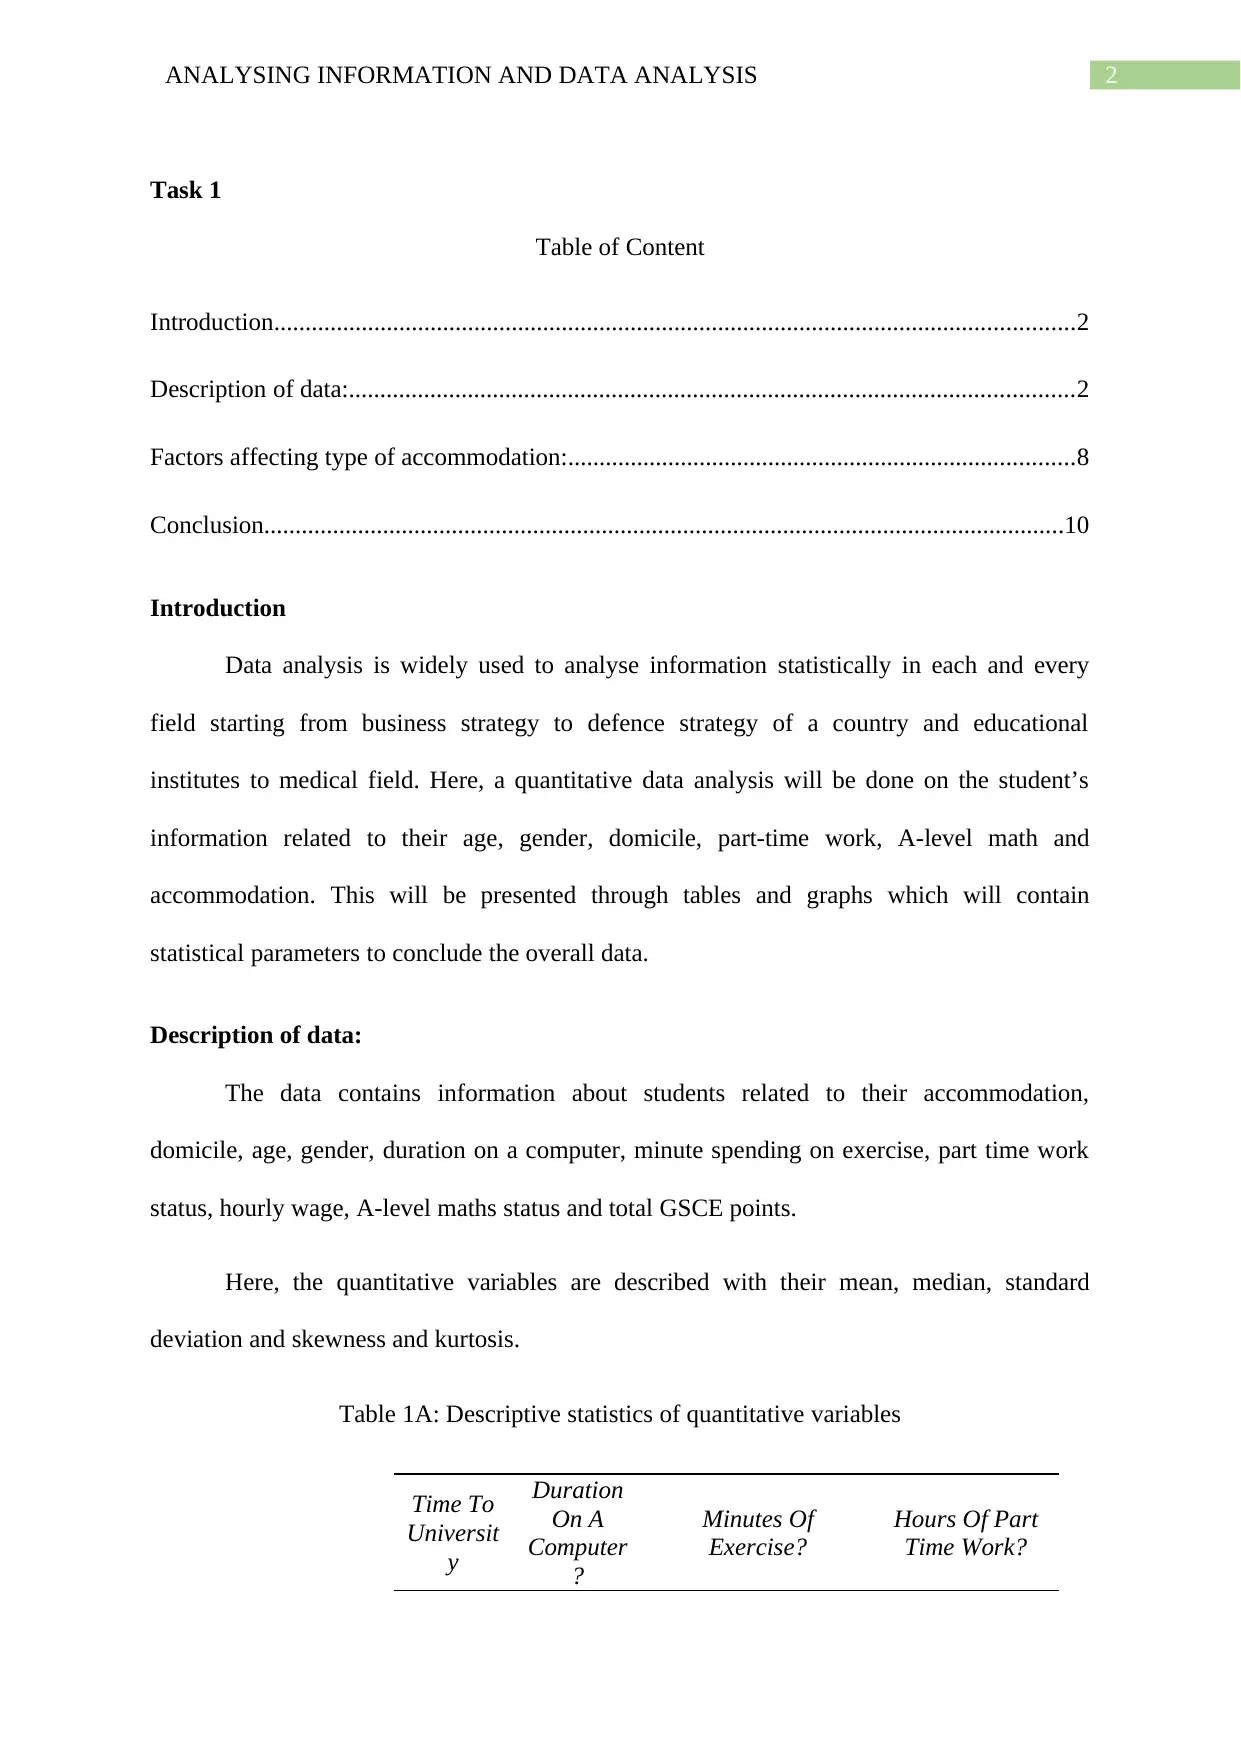
Introduction
Data analysis is widely used to analyse information statistically in each and every
field starting from business strategy to defence strategy of a country and educational
institutes to medical field. Here, a quantitative data analysis will be done on the student’s
information related to their age, gender, domicile, part-time work, A-level math and
accommodation. This will be presented through tables and graphs which will contain
statistical parameters to conclude the overall data.
Description of data:
The data contains information about students related to their accommodation,
domicile, age, gender, duration on a computer, minute spending on exercise, part time work
status, hourly wage, A-level maths status and total GSCE points.
Here, the quantitative variables are described with their mean, median, standard
deviation and skewness and kurtosis.
Table 1A: Descriptive statistics of quantitative variables
Time To
Universit
y
Duration
On A
Computer
?
Minutes Of
Exercise?
Hours Of Part
Time Work?
Task 1
Table of Content
Introduction................................................................................................................................2
Description of data:....................................................................................................................2
Factors affecting type of accommodation:.................................................................................8
Conclusion................................................................................................................................10
Introduction
Data analysis is widely used to analyse information statistically in each and every
field starting from business strategy to defence strategy of a country and educational
institutes to medical field. Here, a quantitative data analysis will be done on the student’s
information related to their age, gender, domicile, part-time work, A-level math and
accommodation. This will be presented through tables and graphs which will contain
statistical parameters to conclude the overall data.
Description of data:
The data contains information about students related to their accommodation,
domicile, age, gender, duration on a computer, minute spending on exercise, part time work
status, hourly wage, A-level maths status and total GSCE points.
Here, the quantitative variables are described with their mean, median, standard
deviation and skewness and kurtosis.
Table 1A: Descriptive statistics of quantitative variables
Time To
Universit
y
Duration
On A
Computer
?
Minutes Of
Exercise?
Hours Of Part
Time Work?
⊘ This is a preview!⊘
Do you want full access?
Subscribe today to unlock all pages.
Trusted by 1+ million students worldwide
3ANALYSING INFORMATION AND DATA ANALYSIS
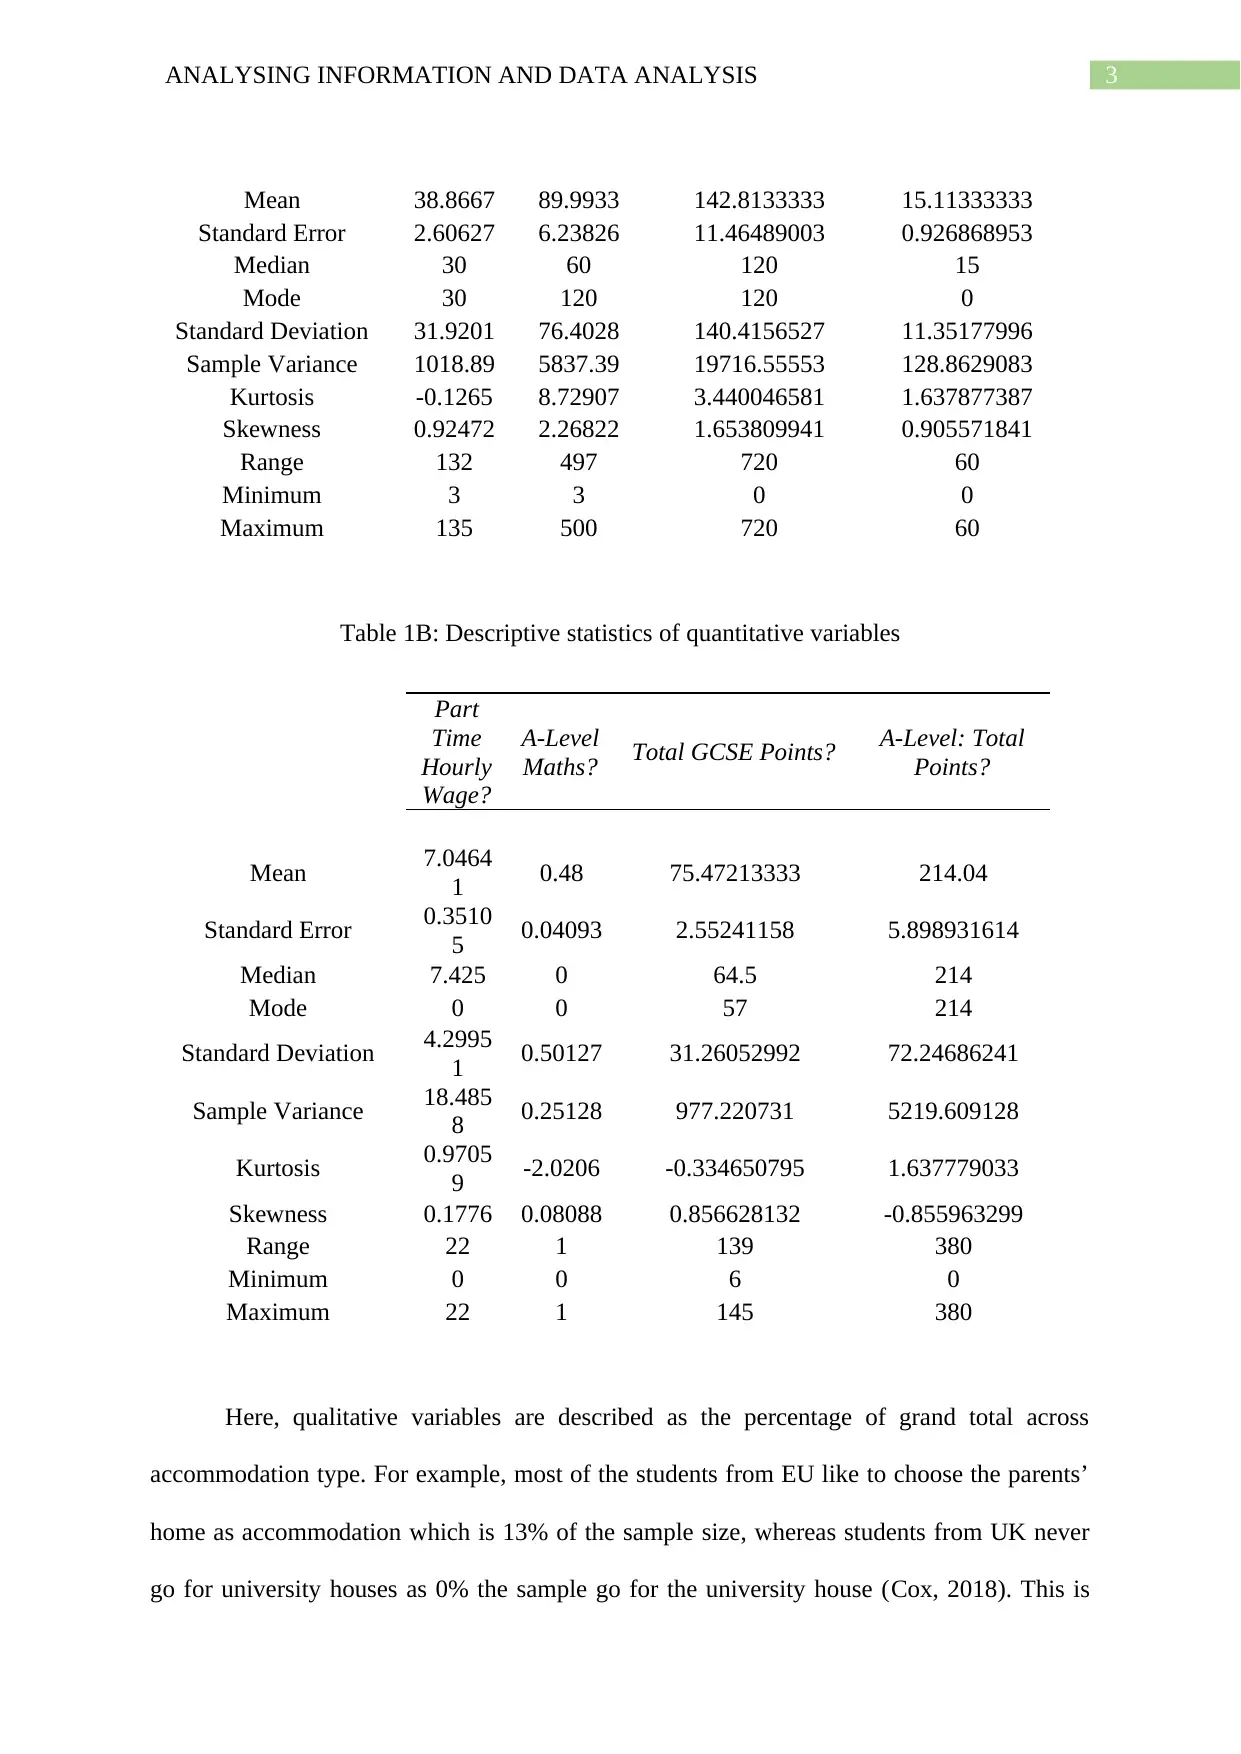
Mean 38.8667 89.9933 142.8133333 15.11333333
Standard Error 2.60627 6.23826 11.46489003 0.926868953
Median 30 60 120 15
Mode 30 120 120 0
Standard Deviation 31.9201 76.4028 140.4156527 11.35177996
Sample Variance 1018.89 5837.39 19716.55553 128.8629083
Kurtosis -0.1265 8.72907 3.440046581 1.637877387
Skewness 0.92472 2.26822 1.653809941 0.905571841
Range 132 497 720 60
Minimum 3 3 0 0
Maximum 135 500 720 60
Table 1B: Descriptive statistics of quantitative variables
Part
Time
Hourly
Wage?
A-Level
Maths? Total GCSE Points? A-Level: Total
Points?
Mean 7.0464
1 0.48 75.47213333 214.04
Standard Error 0.3510
5 0.04093 2.55241158 5.898931614
Median 7.425 0 64.5 214
Mode 0 0 57 214
Standard Deviation 4.2995
1 0.50127 31.26052992 72.24686241
Sample Variance 18.485
8 0.25128 977.220731 5219.609128
Kurtosis 0.9705
9 -2.0206 -0.334650795 1.637779033
Skewness 0.1776 0.08088 0.856628132 -0.855963299
Range 22 1 139 380
Minimum 0 0 6 0
Maximum 22 1 145 380
Here, qualitative variables are described as the percentage of grand total across
accommodation type. For example, most of the students from EU like to choose the parents’
home as accommodation which is 13% of the sample size, whereas students from UK never
go for university houses as 0% the sample go for the university house (Cox, 2018). This is
Paraphrase This Document
Need a fresh take? Get an instant paraphrase of this document with our AI Paraphraser
4ANALYSING INFORMATION AND DATA ANALYSIS
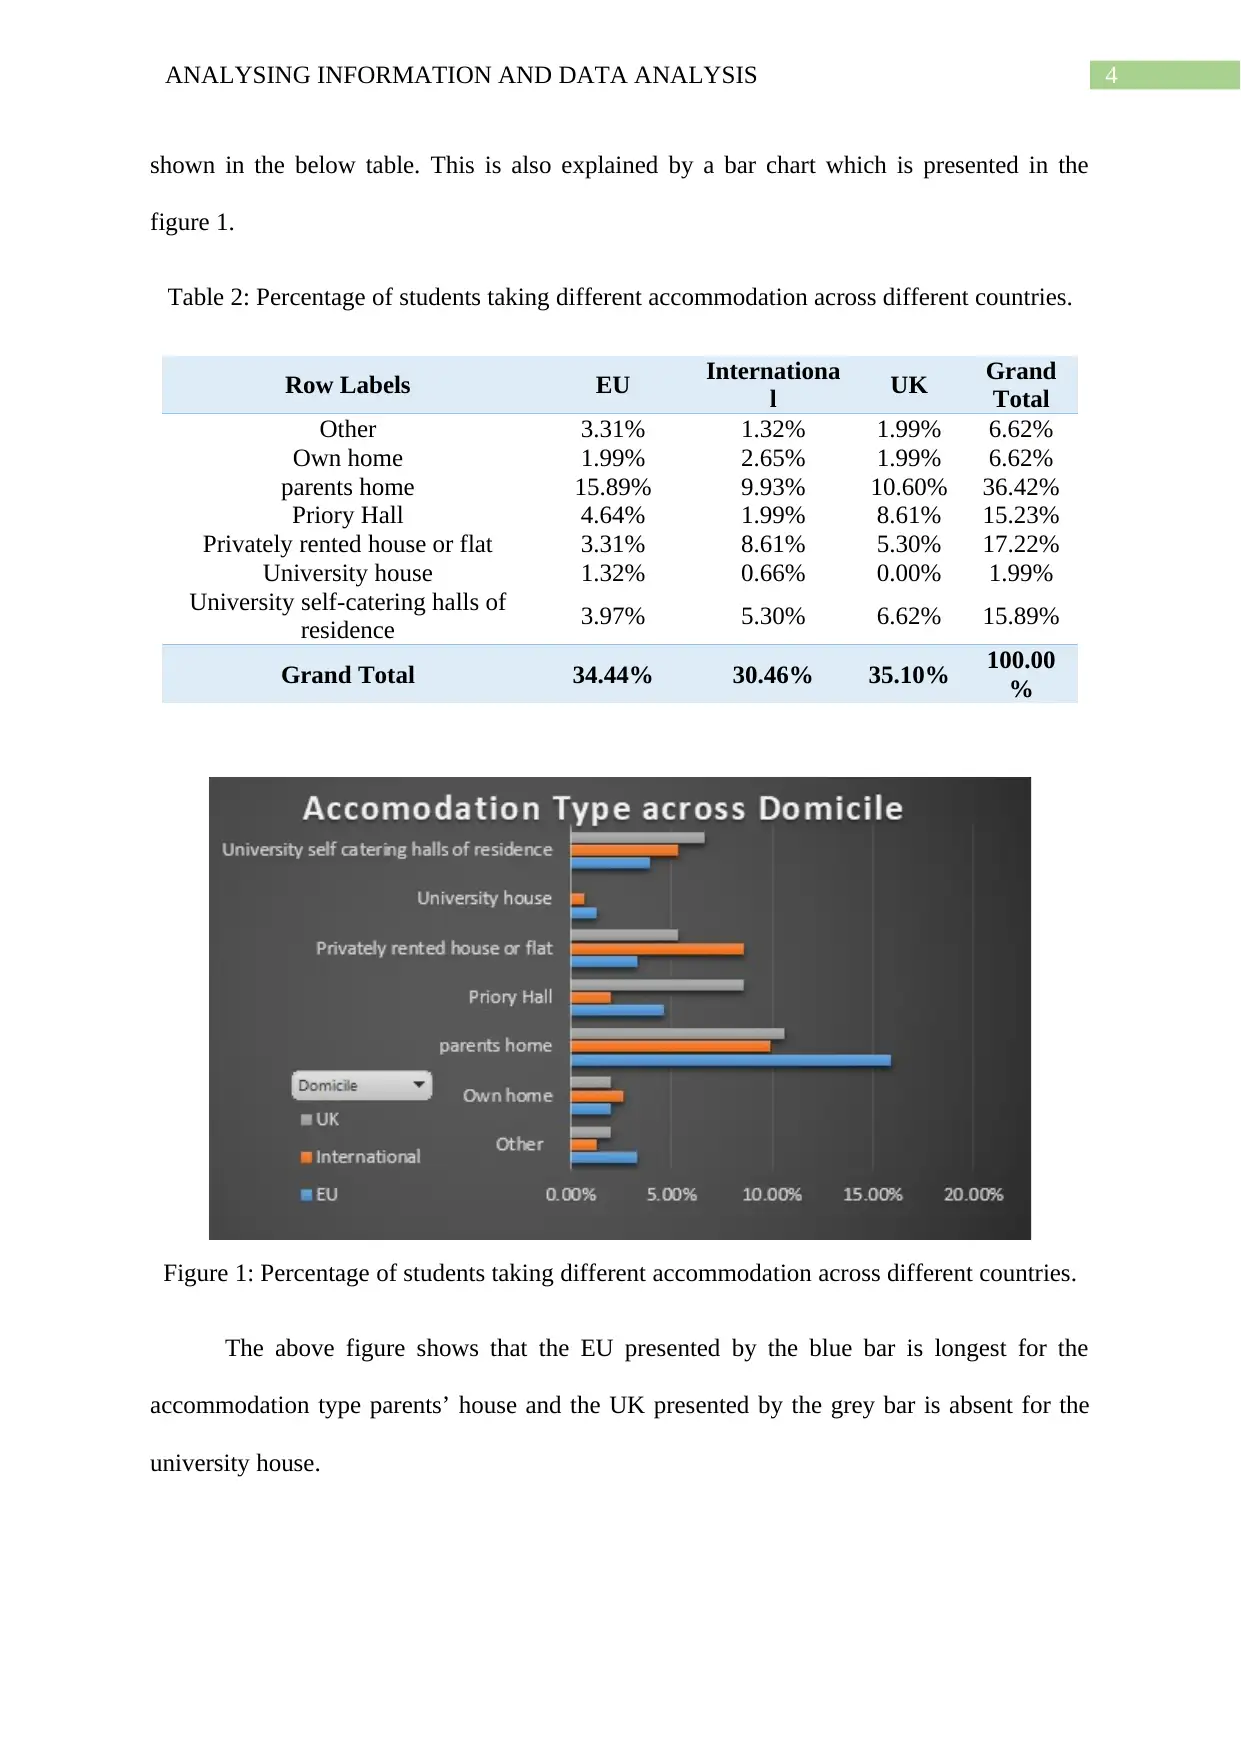
shown in the below table. This is also explained by a bar chart which is presented in the
figure 1.
Table 2: Percentage of students taking different accommodation across different countries.
Row Labels EU Internationa
l UK Grand
Total
Other 3.31% 1.32% 1.99% 6.62%
Own home 1.99% 2.65% 1.99% 6.62%
parents home 15.89% 9.93% 10.60% 36.42%
Priory Hall 4.64% 1.99% 8.61% 15.23%
Privately rented house or flat 3.31% 8.61% 5.30% 17.22%
University house 1.32% 0.66% 0.00% 1.99%
University self-catering halls of
residence 3.97% 5.30% 6.62% 15.89%
Grand Total 34.44% 30.46% 35.10% 100.00
%
Figure 1: Percentage of students taking different accommodation across different countries.
The above figure shows that the EU presented by the blue bar is longest for the
accommodation type parents’ house and the UK presented by the grey bar is absent for the
university house.
5ANALYSING INFORMATION AND DATA ANALYSIS
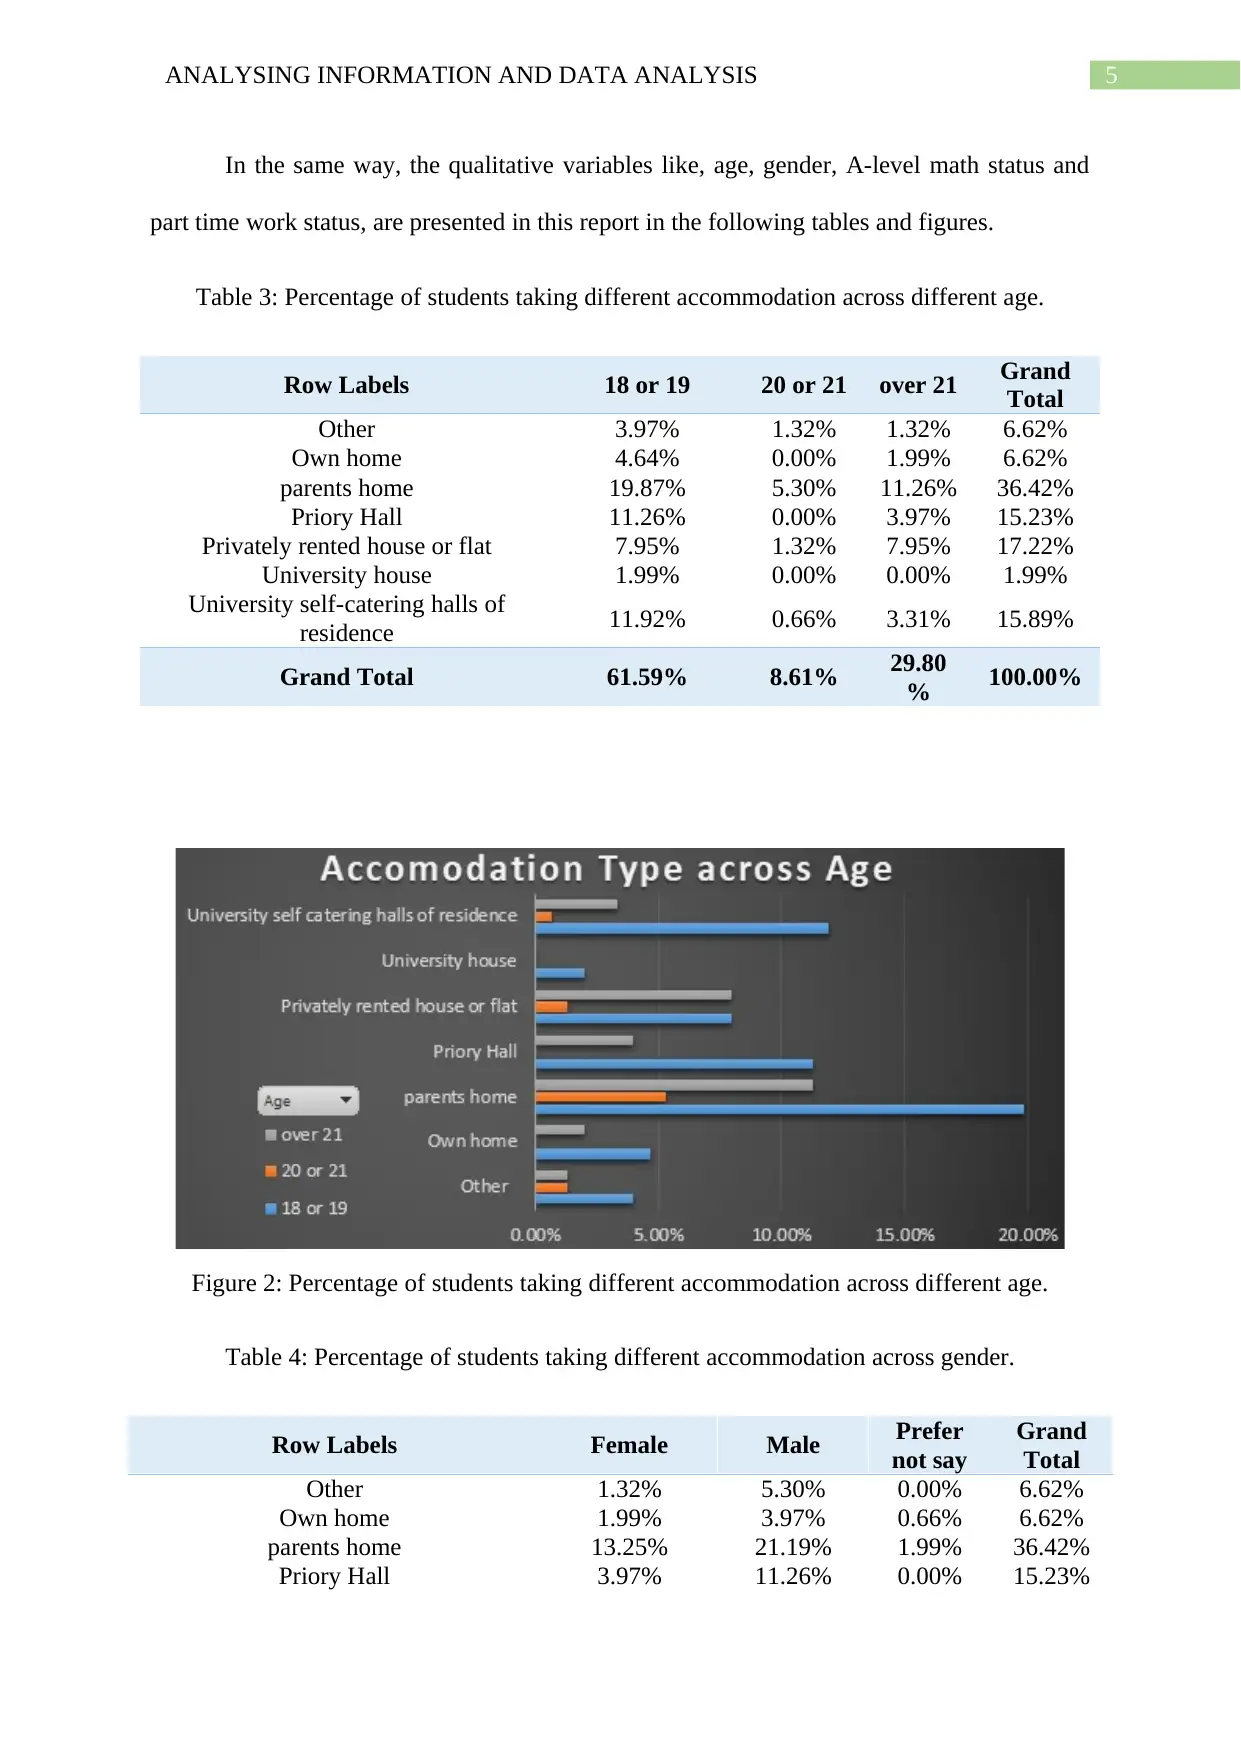
In the same way, the qualitative variables like, age, gender, A-level math status and
part time work status, are presented in this report in the following tables and figures.
Table 3: Percentage of students taking different accommodation across different age.
Row Labels 18 or 19 20 or 21 over 21 Grand
Total
Other 3.97% 1.32% 1.32% 6.62%
Own home 4.64% 0.00% 1.99% 6.62%
parents home 19.87% 5.30% 11.26% 36.42%
Priory Hall 11.26% 0.00% 3.97% 15.23%
Privately rented house or flat 7.95% 1.32% 7.95% 17.22%
University house 1.99% 0.00% 0.00% 1.99%
University self-catering halls of
residence 11.92% 0.66% 3.31% 15.89%
Grand Total 61.59% 8.61% 29.80
% 100.00%
Figure 2: Percentage of students taking different accommodation across different age.
Table 4: Percentage of students taking different accommodation across gender.
Row Labels Female Male Prefer
not say
Grand
Total
Other 1.32% 5.30% 0.00% 6.62%
Own home 1.99% 3.97% 0.66% 6.62%
parents home 13.25% 21.19% 1.99% 36.42%
Priory Hall 3.97% 11.26% 0.00% 15.23%
⊘ This is a preview!⊘
Do you want full access?
Subscribe today to unlock all pages.
Trusted by 1+ million students worldwide
6ANALYSING INFORMATION AND DATA ANALYSIS
Privately rented house or flat 5.30% 10.60% 1.32% 17.22%
University house 1.32% 0.66% 0.00% 1.99%
University self-catering halls of
residence 2.65% 13.25% 0.00% 15.89%
Grand Total 29.80% 66.23% 3.97% 100.00%
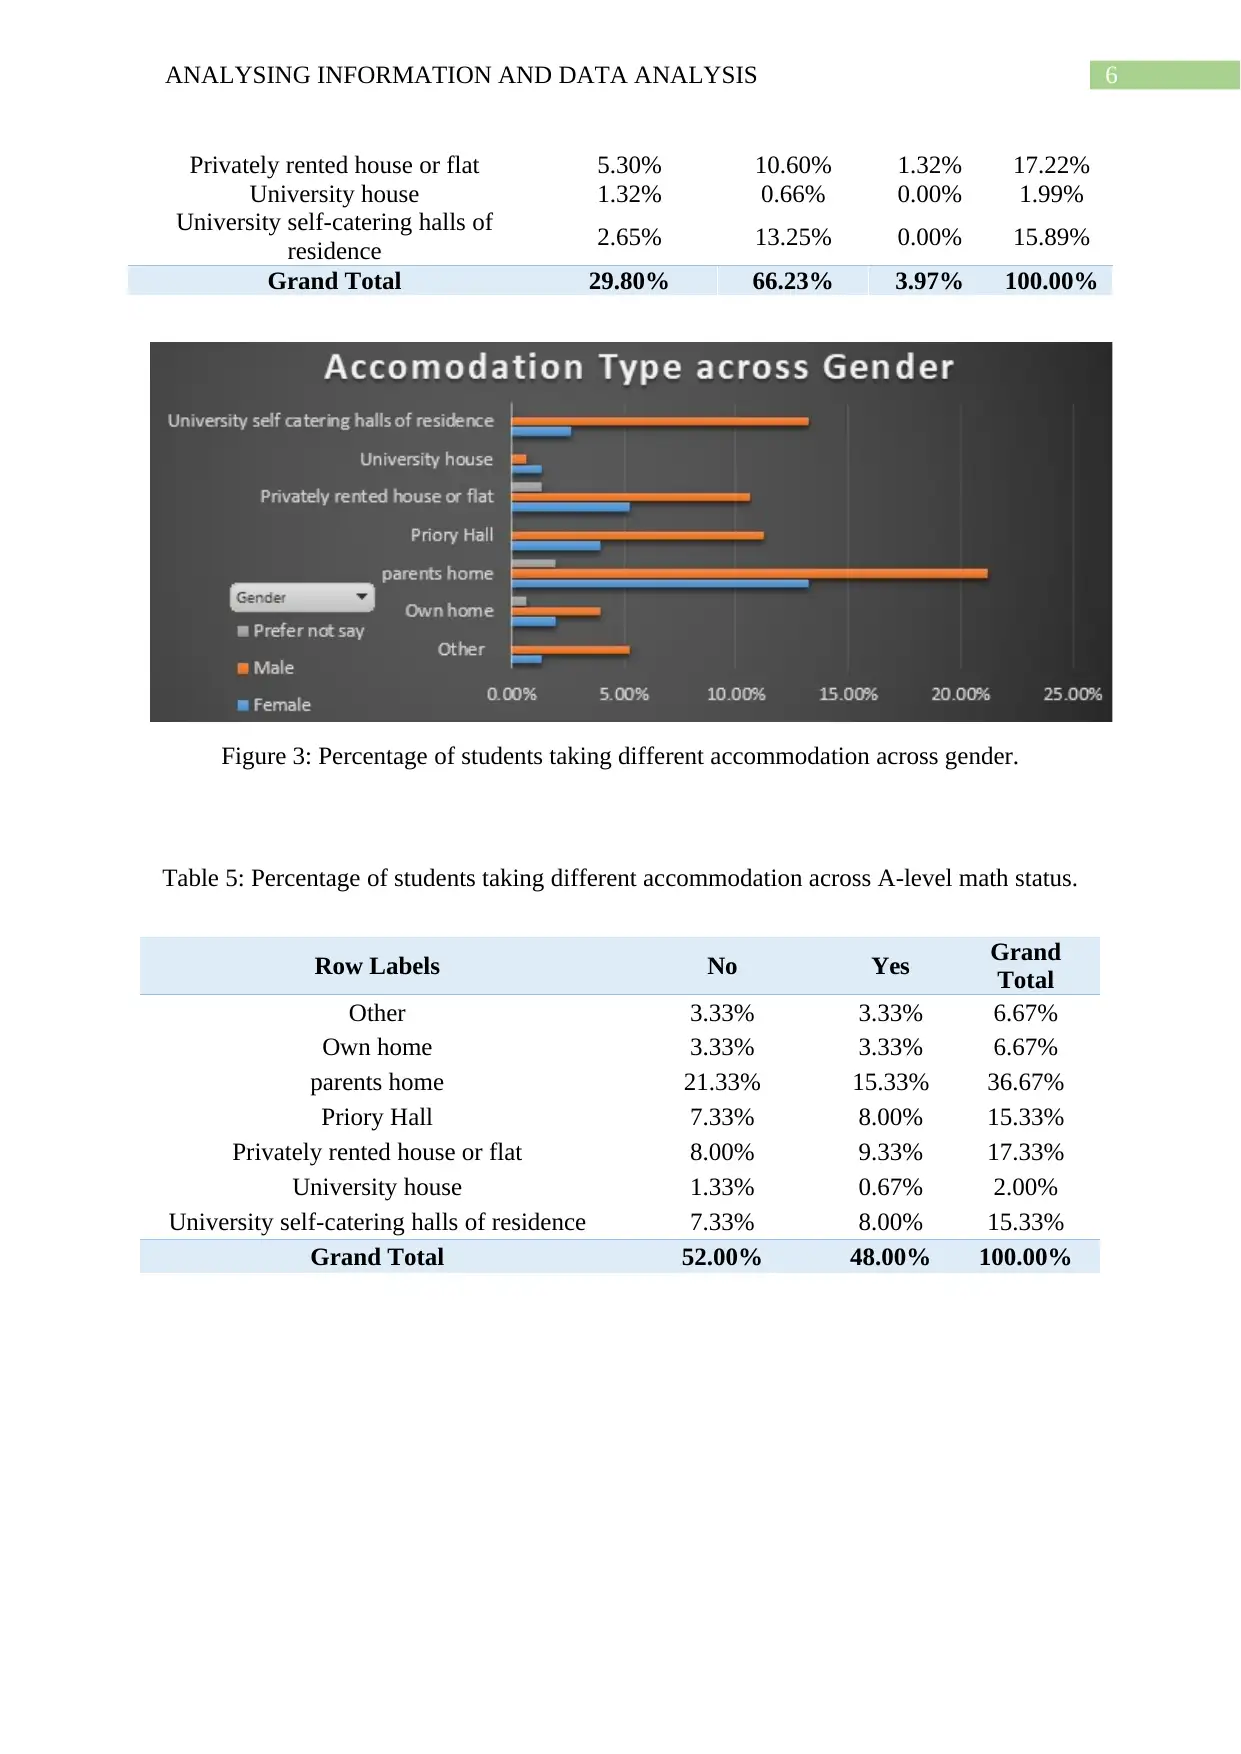
Figure 3: Percentage of students taking different accommodation across gender.
Table 5: Percentage of students taking different accommodation across A-level math status.
Row Labels No Yes Grand
Total
Other 3.33% 3.33% 6.67%
Own home 3.33% 3.33% 6.67%
parents home 21.33% 15.33% 36.67%
Priory Hall 7.33% 8.00% 15.33%
Privately rented house or flat 8.00% 9.33% 17.33%
University house 1.33% 0.67% 2.00%
University self-catering halls of residence 7.33% 8.00% 15.33%
Grand Total 52.00% 48.00% 100.00%
Privately rented house or flat 5.30% 10.60% 1.32% 17.22%
University house 1.32% 0.66% 0.00% 1.99%
University self-catering halls of
residence 2.65% 13.25% 0.00% 15.89%
Grand Total 29.80% 66.23% 3.97% 100.00%
Figure 3: Percentage of students taking different accommodation across gender.
Table 5: Percentage of students taking different accommodation across A-level math status.
Row Labels No Yes Grand
Total
Other 3.33% 3.33% 6.67%
Own home 3.33% 3.33% 6.67%
parents home 21.33% 15.33% 36.67%
Priory Hall 7.33% 8.00% 15.33%
Privately rented house or flat 8.00% 9.33% 17.33%
University house 1.33% 0.67% 2.00%
University self-catering halls of residence 7.33% 8.00% 15.33%
Grand Total 52.00% 48.00% 100.00%
Paraphrase This Document
Need a fresh take? Get an instant paraphrase of this document with our AI Paraphraser
7ANALYSING INFORMATION AND DATA ANALYSIS
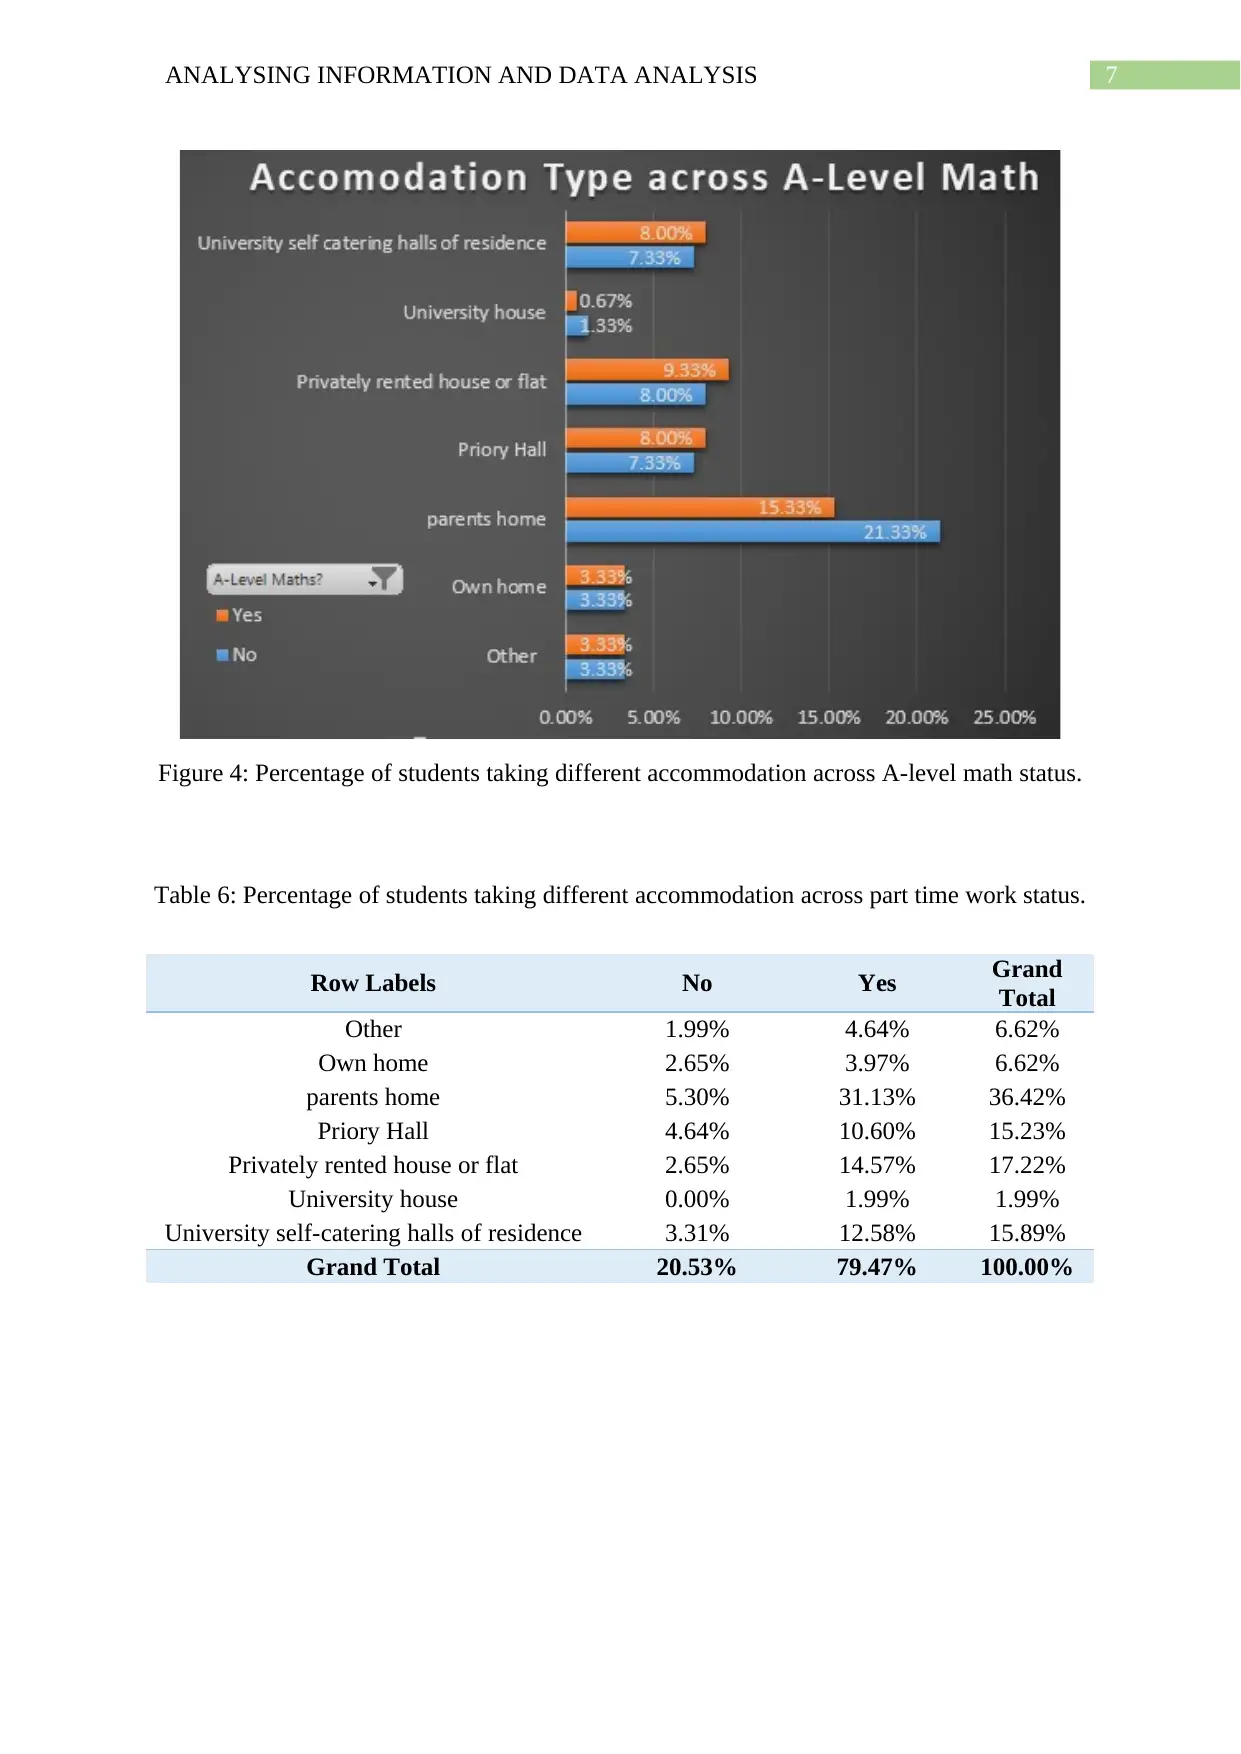
Figure 4: Percentage of students taking different accommodation across A-level math status.
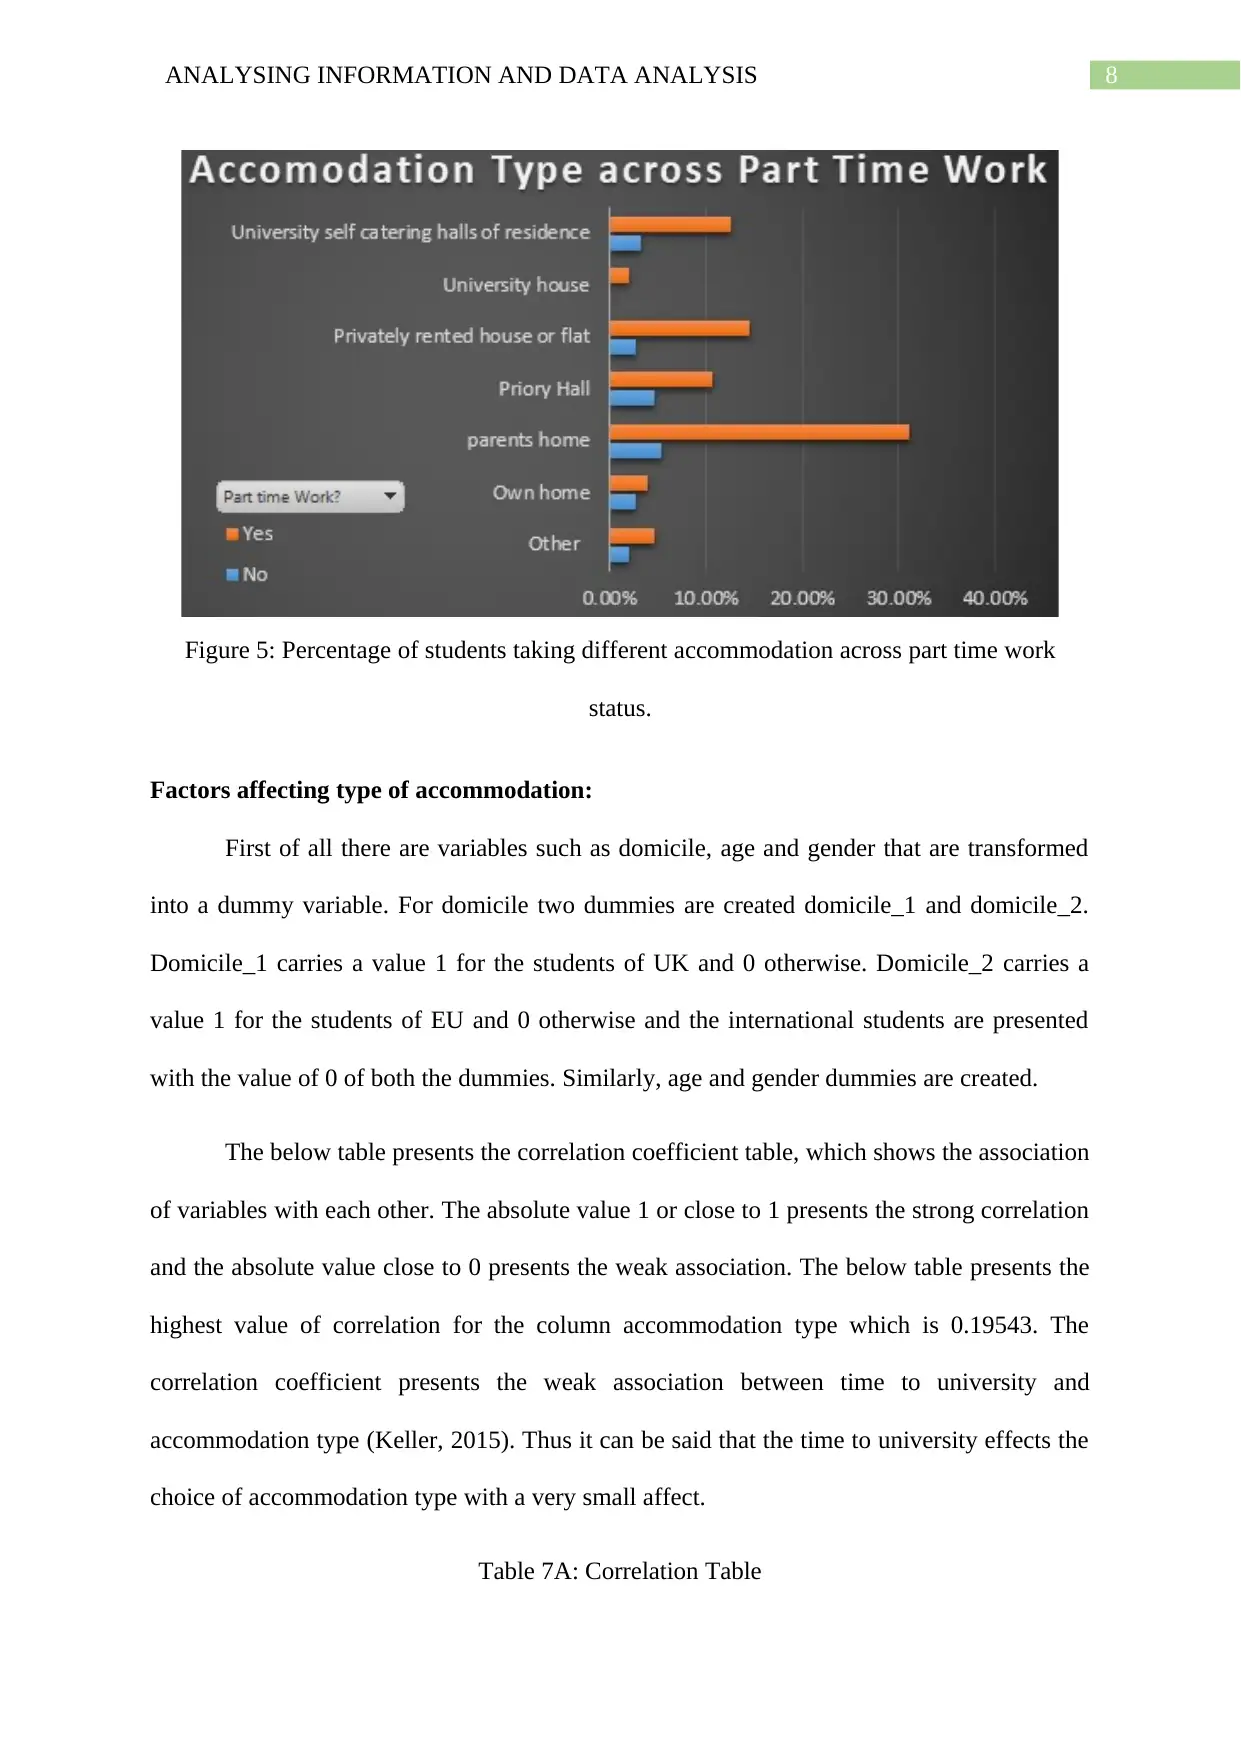
Table 6: Percentage of students taking different accommodation across part time work status.
Row Labels No Yes Grand
Total
Other 1.99% 4.64% 6.62%
Own home 2.65% 3.97% 6.62%
parents home 5.30% 31.13% 36.42%
Priory Hall 4.64% 10.60% 15.23%
Privately rented house or flat 2.65% 14.57% 17.22%
University house 0.00% 1.99% 1.99%
University self-catering halls of residence 3.31% 12.58% 15.89%
Grand Total 20.53% 79.47% 100.00%
Figure 4: Percentage of students taking different accommodation across A-level math status.
Table 6: Percentage of students taking different accommodation across part time work status.
Row Labels No Yes Grand
Total
Other 1.99% 4.64% 6.62%
Own home 2.65% 3.97% 6.62%
parents home 5.30% 31.13% 36.42%
Priory Hall 4.64% 10.60% 15.23%
Privately rented house or flat 2.65% 14.57% 17.22%
University house 0.00% 1.99% 1.99%
University self-catering halls of residence 3.31% 12.58% 15.89%
Grand Total 20.53% 79.47% 100.00%
8ANALYSING INFORMATION AND DATA ANALYSIS
Figure 5: Percentage of students taking different accommodation across part time work
status.
Factors affecting type of accommodation:
First of all there are variables such as domicile, age and gender that are transformed
into a dummy variable. For domicile two dummies are created domicile_1 and domicile_2.
Domicile_1 carries a value 1 for the students of UK and 0 otherwise. Domicile_2 carries a
value 1 for the students of EU and 0 otherwise and the international students are presented
with the value of 0 of both the dummies. Similarly, age and gender dummies are created.
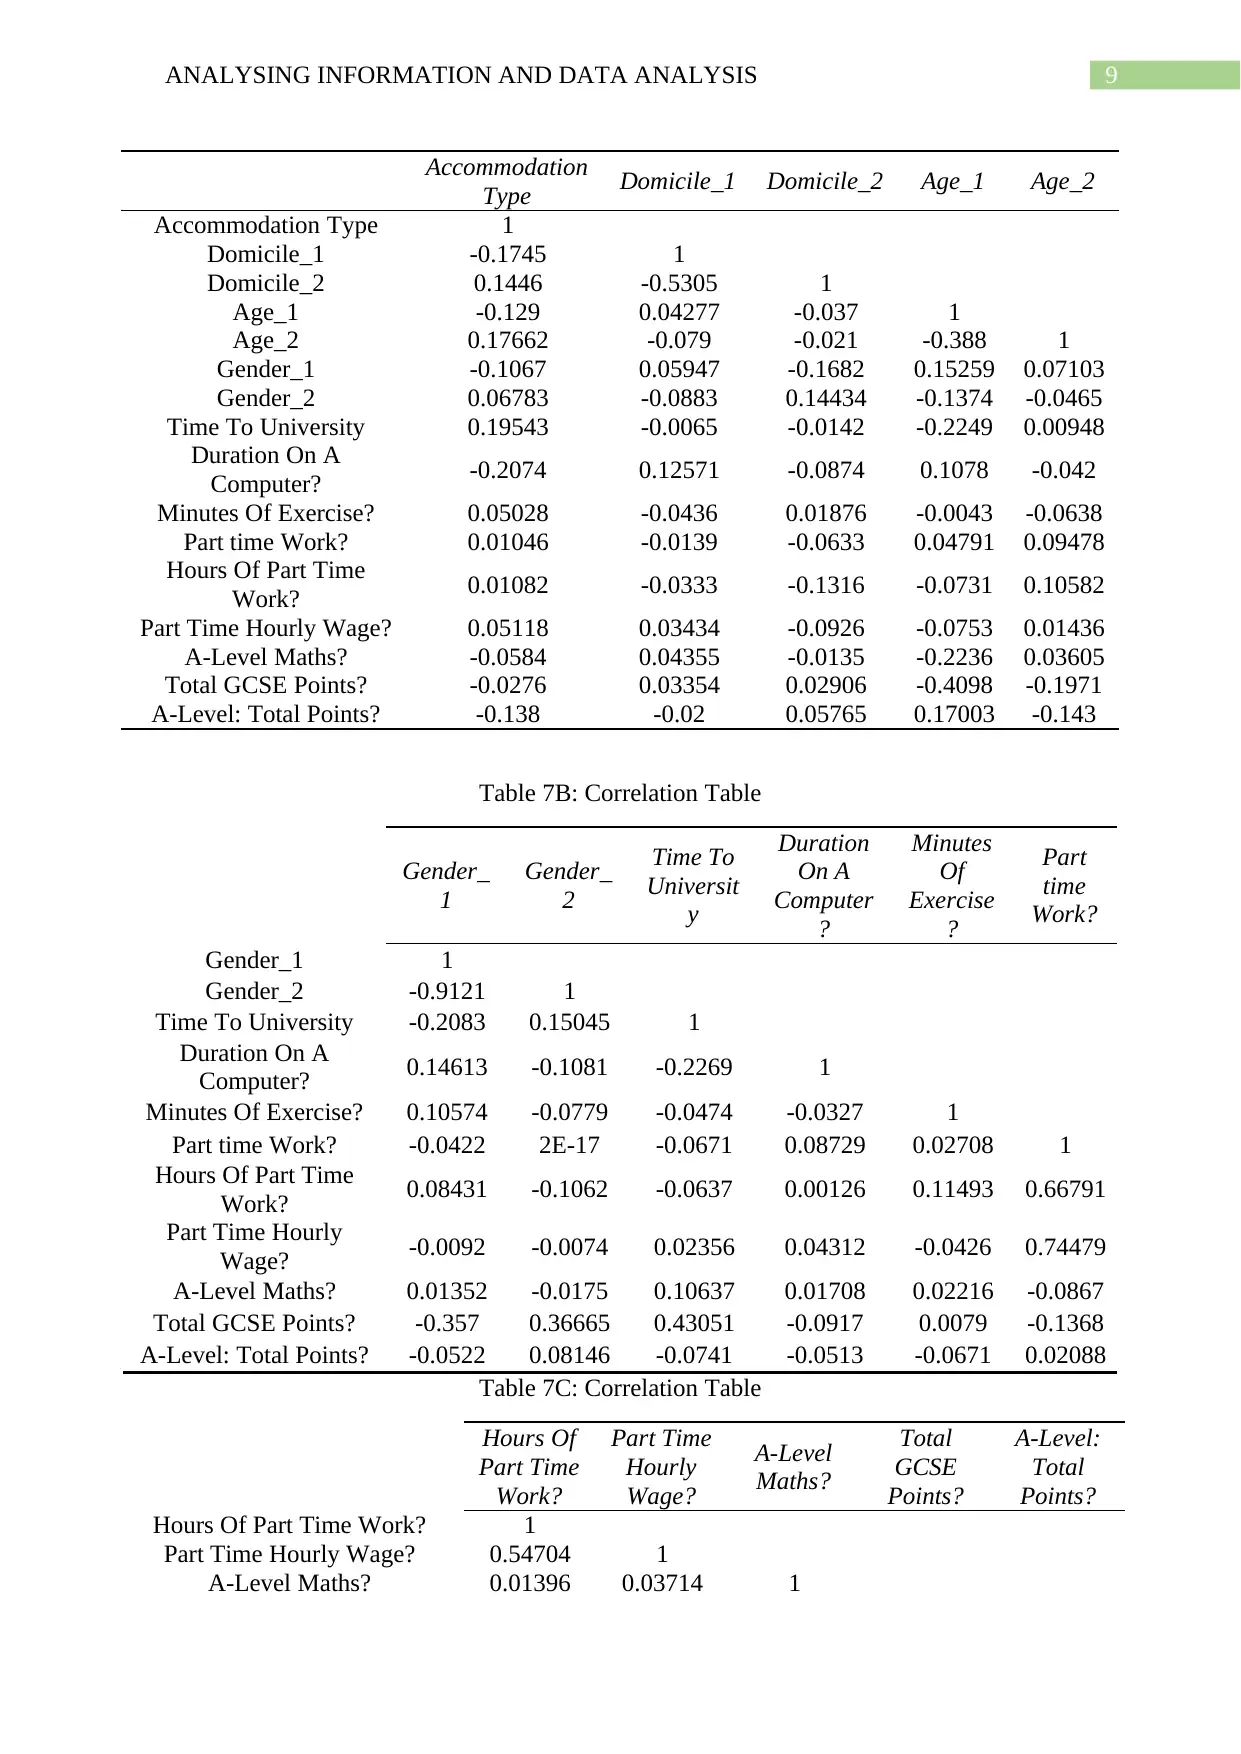
The below table presents the correlation coefficient table, which shows the association
of variables with each other. The absolute value 1 or close to 1 presents the strong correlation
and the absolute value close to 0 presents the weak association. The below table presents the
highest value of correlation for the column accommodation type which is 0.19543. The
correlation coefficient presents the weak association between time to university and
accommodation type (Keller, 2015). Thus it can be said that the time to university effects the
choice of accommodation type with a very small affect.
Table 7A: Correlation Table
Figure 5: Percentage of students taking different accommodation across part time work
status.
Factors affecting type of accommodation:
First of all there are variables such as domicile, age and gender that are transformed
into a dummy variable. For domicile two dummies are created domicile_1 and domicile_2.
Domicile_1 carries a value 1 for the students of UK and 0 otherwise. Domicile_2 carries a
value 1 for the students of EU and 0 otherwise and the international students are presented
with the value of 0 of both the dummies. Similarly, age and gender dummies are created.
The below table presents the correlation coefficient table, which shows the association
of variables with each other. The absolute value 1 or close to 1 presents the strong correlation
and the absolute value close to 0 presents the weak association. The below table presents the
highest value of correlation for the column accommodation type which is 0.19543. The
correlation coefficient presents the weak association between time to university and
accommodation type (Keller, 2015). Thus it can be said that the time to university effects the
choice of accommodation type with a very small affect.
Table 7A: Correlation Table
⊘ This is a preview!⊘
Do you want full access?
Subscribe today to unlock all pages.
Trusted by 1+ million students worldwide
9ANALYSING INFORMATION AND DATA ANALYSIS
Accommodation
Type Domicile_1 Domicile_2 Age_1 Age_2
Accommodation Type 1
Domicile_1 -0.1745 1
Domicile_2 0.1446 -0.5305 1
Age_1 -0.129 0.04277 -0.037 1
Age_2 0.17662 -0.079 -0.021 -0.388 1
Gender_1 -0.1067 0.05947 -0.1682 0.15259 0.07103
Gender_2 0.06783 -0.0883 0.14434 -0.1374 -0.0465
Time To University 0.19543 -0.0065 -0.0142 -0.2249 0.00948
Duration On A
Computer? -0.2074 0.12571 -0.0874 0.1078 -0.042
Minutes Of Exercise? 0.05028 -0.0436 0.01876 -0.0043 -0.0638
Part time Work? 0.01046 -0.0139 -0.0633 0.04791 0.09478
Hours Of Part Time
Work? 0.01082 -0.0333 -0.1316 -0.0731 0.10582
Part Time Hourly Wage? 0.05118 0.03434 -0.0926 -0.0753 0.01436
A-Level Maths? -0.0584 0.04355 -0.0135 -0.2236 0.03605
Total GCSE Points? -0.0276 0.03354 0.02906 -0.4098 -0.1971
A-Level: Total Points? -0.138 -0.02 0.05765 0.17003 -0.143
Table 7B: Correlation Table
Gender_
1
Gender_
2
Time To
Universit
y
Duration
On A
Computer
?
Minutes
Of
Exercise
?
Part
time
Work?
Gender_1 1
Gender_2 -0.9121 1
Time To University -0.2083 0.15045 1
Duration On A
Computer? 0.14613 -0.1081 -0.2269 1
Minutes Of Exercise? 0.10574 -0.0779 -0.0474 -0.0327 1
Part time Work? -0.0422 2E-17 -0.0671 0.08729 0.02708 1
Hours Of Part Time
Work? 0.08431 -0.1062 -0.0637 0.00126 0.11493 0.66791
Part Time Hourly
Wage? -0.0092 -0.0074 0.02356 0.04312 -0.0426 0.74479
A-Level Maths? 0.01352 -0.0175 0.10637 0.01708 0.02216 -0.0867
Total GCSE Points? -0.357 0.36665 0.43051 -0.0917 0.0079 -0.1368
A-Level: Total Points? -0.0522 0.08146 -0.0741 -0.0513 -0.0671 0.02088
Table 7C: Correlation Table
Hours Of
Part Time
Work?
Part Time
Hourly
Wage?
A-Level
Maths?
Total
GCSE
Points?
A-Level:
Total
Points?
Hours Of Part Time Work? 1
Part Time Hourly Wage? 0.54704 1
A-Level Maths? 0.01396 0.03714 1
Paraphrase This Document
Need a fresh take? Get an instant paraphrase of this document with our AI Paraphraser
10ANALYSING INFORMATION AND DATA ANALYSIS
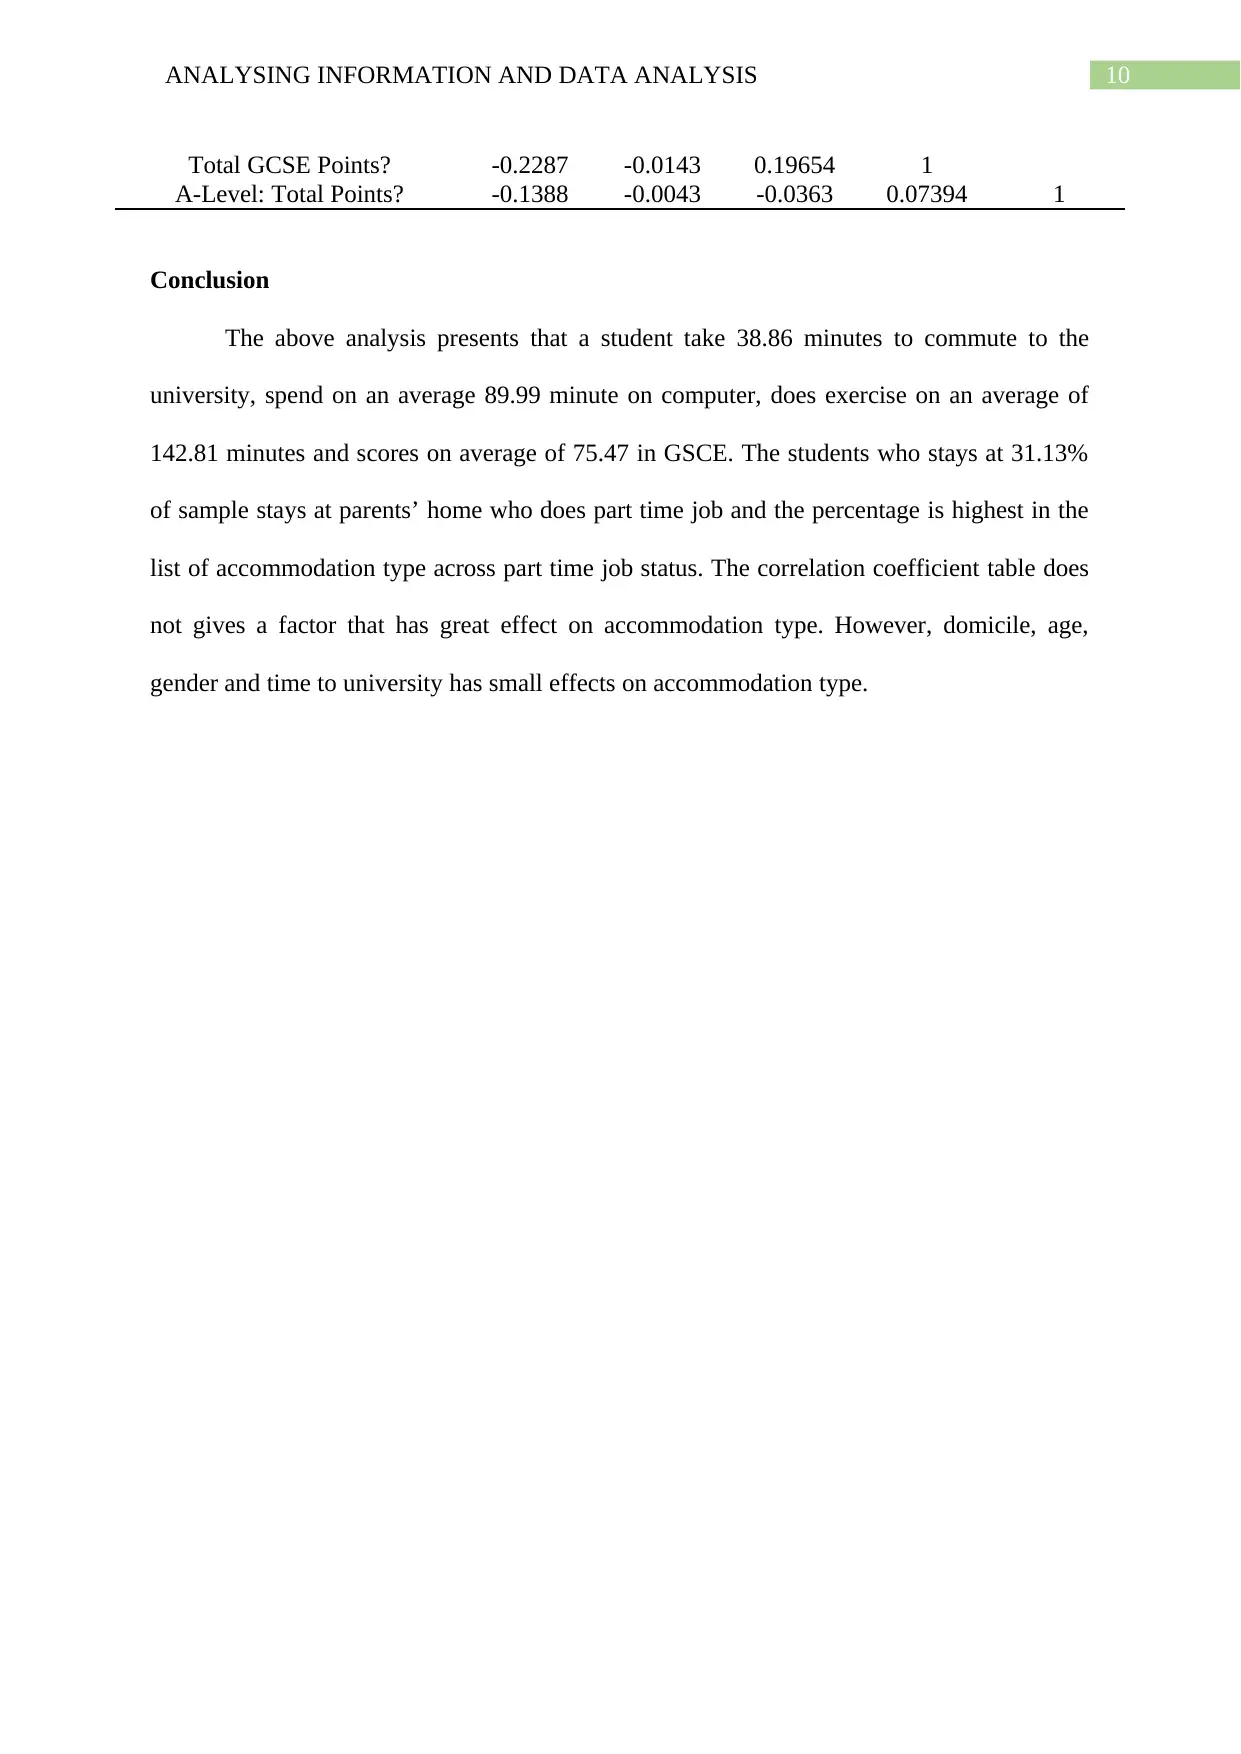
Total GCSE Points? -0.2287 -0.0143 0.19654 1
A-Level: Total Points? -0.1388 -0.0043 -0.0363 0.07394 1
Conclusion
The above analysis presents that a student take 38.86 minutes to commute to the
university, spend on an average 89.99 minute on computer, does exercise on an average of
142.81 minutes and scores on average of 75.47 in GSCE. The students who stays at 31.13%
of sample stays at parents’ home who does part time job and the percentage is highest in the
list of accommodation type across part time job status. The correlation coefficient table does
not gives a factor that has great effect on accommodation type. However, domicile, age,
gender and time to university has small effects on accommodation type.
11ANALYSING INFORMATION AND DATA ANALYSIS
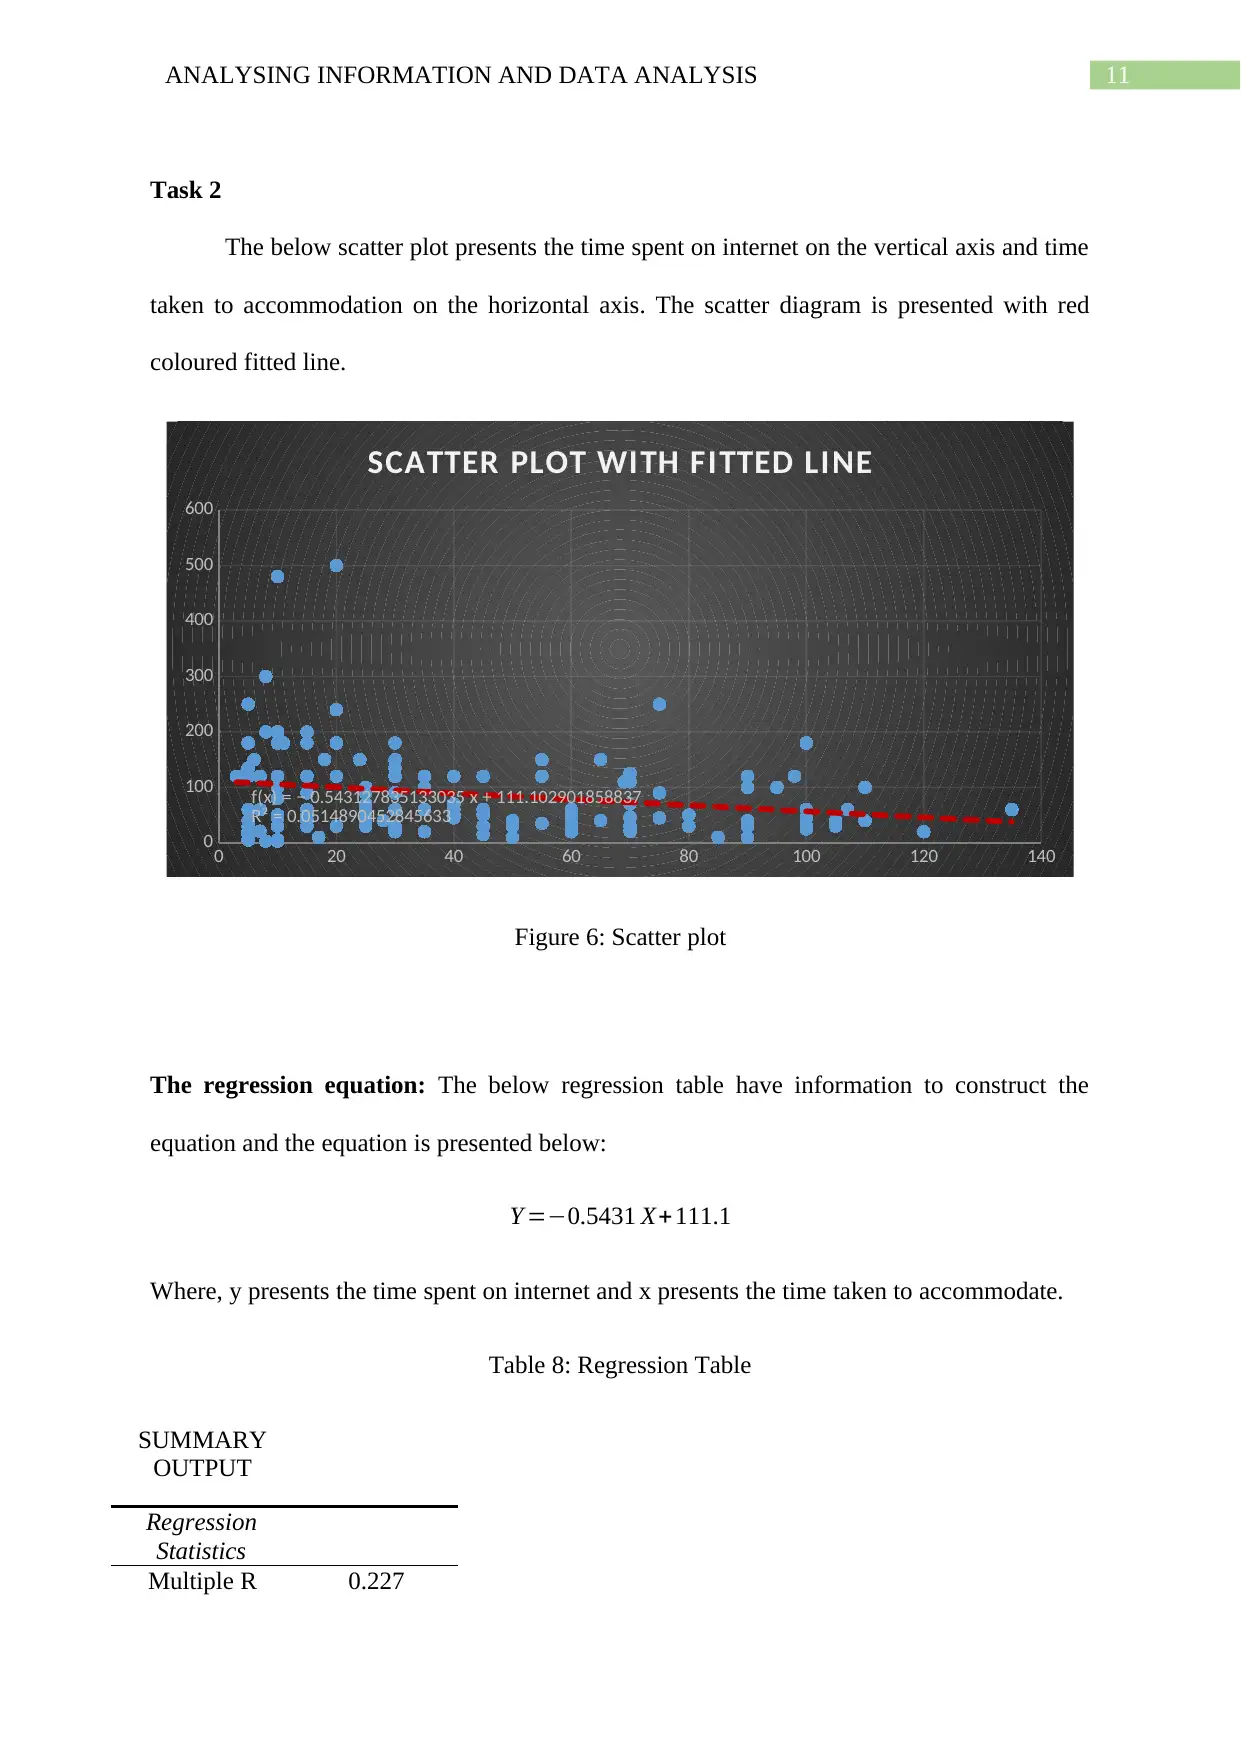
Task 2
The below scatter plot presents the time spent on internet on the vertical axis and time
taken to accommodation on the horizontal axis. The scatter diagram is presented with red
coloured fitted line.
0 20 40 60 80 100 120 140
0
100
200
300
400
500
600
f(x) = − 0.543127835133035 x + 111.102901858837
R² = 0.0514890452845633
SCATTER PLOT WITH FITTED LINE
Figure 6: Scatter plot
The regression equation: The below regression table have information to construct the
equation and the equation is presented below:
Y =−0.5431 X+ 111.1
Where, y presents the time spent on internet and x presents the time taken to accommodate.
Table 8: Regression Table
SUMMARY
OUTPUT
Regression
Statistics
Multiple R 0.227
⊘ This is a preview!⊘
Do you want full access?
Subscribe today to unlock all pages.
Trusted by 1+ million students worldwide
1 out of 18
Related Documents


Your All-in-One AI-Powered Toolkit for Academic Success.
+13062052269
info@desklib.com
Available 24*7 on WhatsApp / Email
![[object Object]](/_next/static/media/star-bottom.7253800d.svg)
Unlock your academic potential
Copyright © 2020–2026 A2Z Services. All Rights Reserved. Developed and managed by ZUCOL.