Business Modelling Report: Inventory, Non-Linear, Decision Tree
VerifiedAdded on 2022/12/30
|12
|2368
|58
Report
AI Summary
This report delves into various aspects of business modeling for decision-making. It begins with an analysis of inventory management, including the Economic Order Quantity (EOQ) model for a plasma TV, calculation of delivery frequency, and total annual variable costs. The report then explores non-linear/extremum models, focusing on profit maximization for a furniture maker, including demand, cost, and profit analysis. A comparative analysis of London and Liverpool models is also included. Finally, the report examines decision tree analysis, with two sections demonstrating expected returns under different scenarios, and provides a conclusion summarizing the key findings and the importance of business modeling in strategic planning.
Business Modelling for
Decision Making
Decision Making
Paraphrase This Document
Need a fresh take? Get an instant paraphrase of this document with our AI Paraphraser
Contents
INTRODUCTION...........................................................................................................................3
Part A – INVENTORY....................................................................................................................3
(a). Finding EOQ for the A545 Plasma TV, using formula ¿ 2 dsh...............................................3
(b). Based on assessed EOQ above, how much deliveries are required of the plasma TVs every
year:..............................................................................................................................................3
(c). Find the total annual variable cost for TV King Ltd. TVC ¿ Q 2× h+dQ × s.......................4
(d).................................................................................................................................................4
(e).................................................................................................................................................4
Part B – NON-LINEAR/EXTREMUM...........................................................................................6
a) Finding the equation for London furniture makers’ profit.......................................................6
b) Setting up demand, costs and profit table................................................................................6
c) Using values from above stated table and drawing a demand, costs and profitability graph. .7
d) Finding value of the ‘q’ that maximizes the profit..................................................................7
e) Finding value for the ‘X’ coefficients based on q (Liverpool):...............................................7
f. Strong and weak points in the London and Liverpool models:................................................8
Part C – DECISION TREE..............................................................................................................8
SECTION 1..................................................................................................................................8
i.....................................................................................................................................................8
ii. Decision Tree:........................................................................................................................10
SECTION 2................................................................................................................................10
CONCLUSION..............................................................................................................................11
REFERENCES..............................................................................................................................12
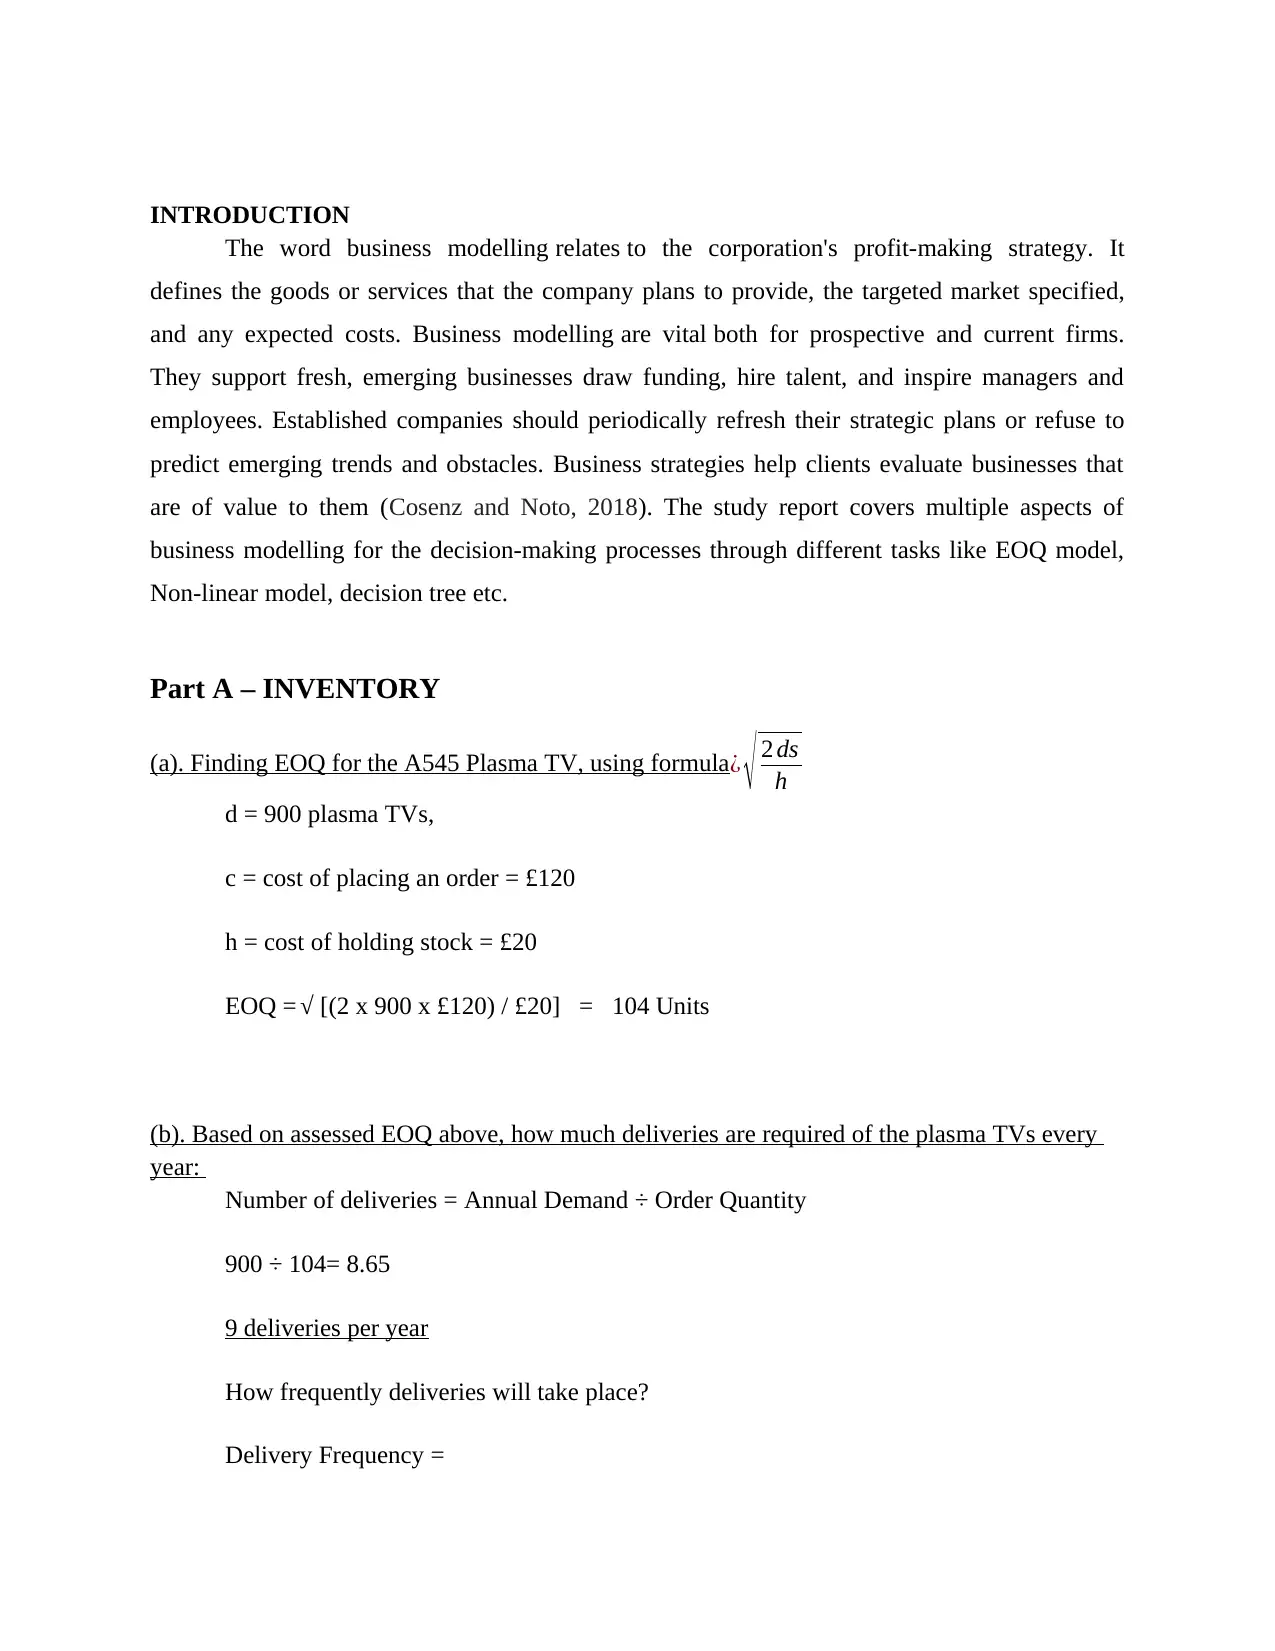
INTRODUCTION
The word business modelling relates to the corporation's profit-making strategy. It
defines the goods or services that the company plans to provide, the targeted market specified,
and any expected costs. Business modelling are vital both for prospective and current firms.
They support fresh, emerging businesses draw funding, hire talent, and inspire managers and
employees. Established companies should periodically refresh their strategic plans or refuse to
predict emerging trends and obstacles. Business strategies help clients evaluate businesses that
are of value to them (Cosenz and Noto, 2018). The study report covers multiple aspects of
business modelling for the decision-making processes through different tasks like EOQ model,
Non-linear model, decision tree etc.
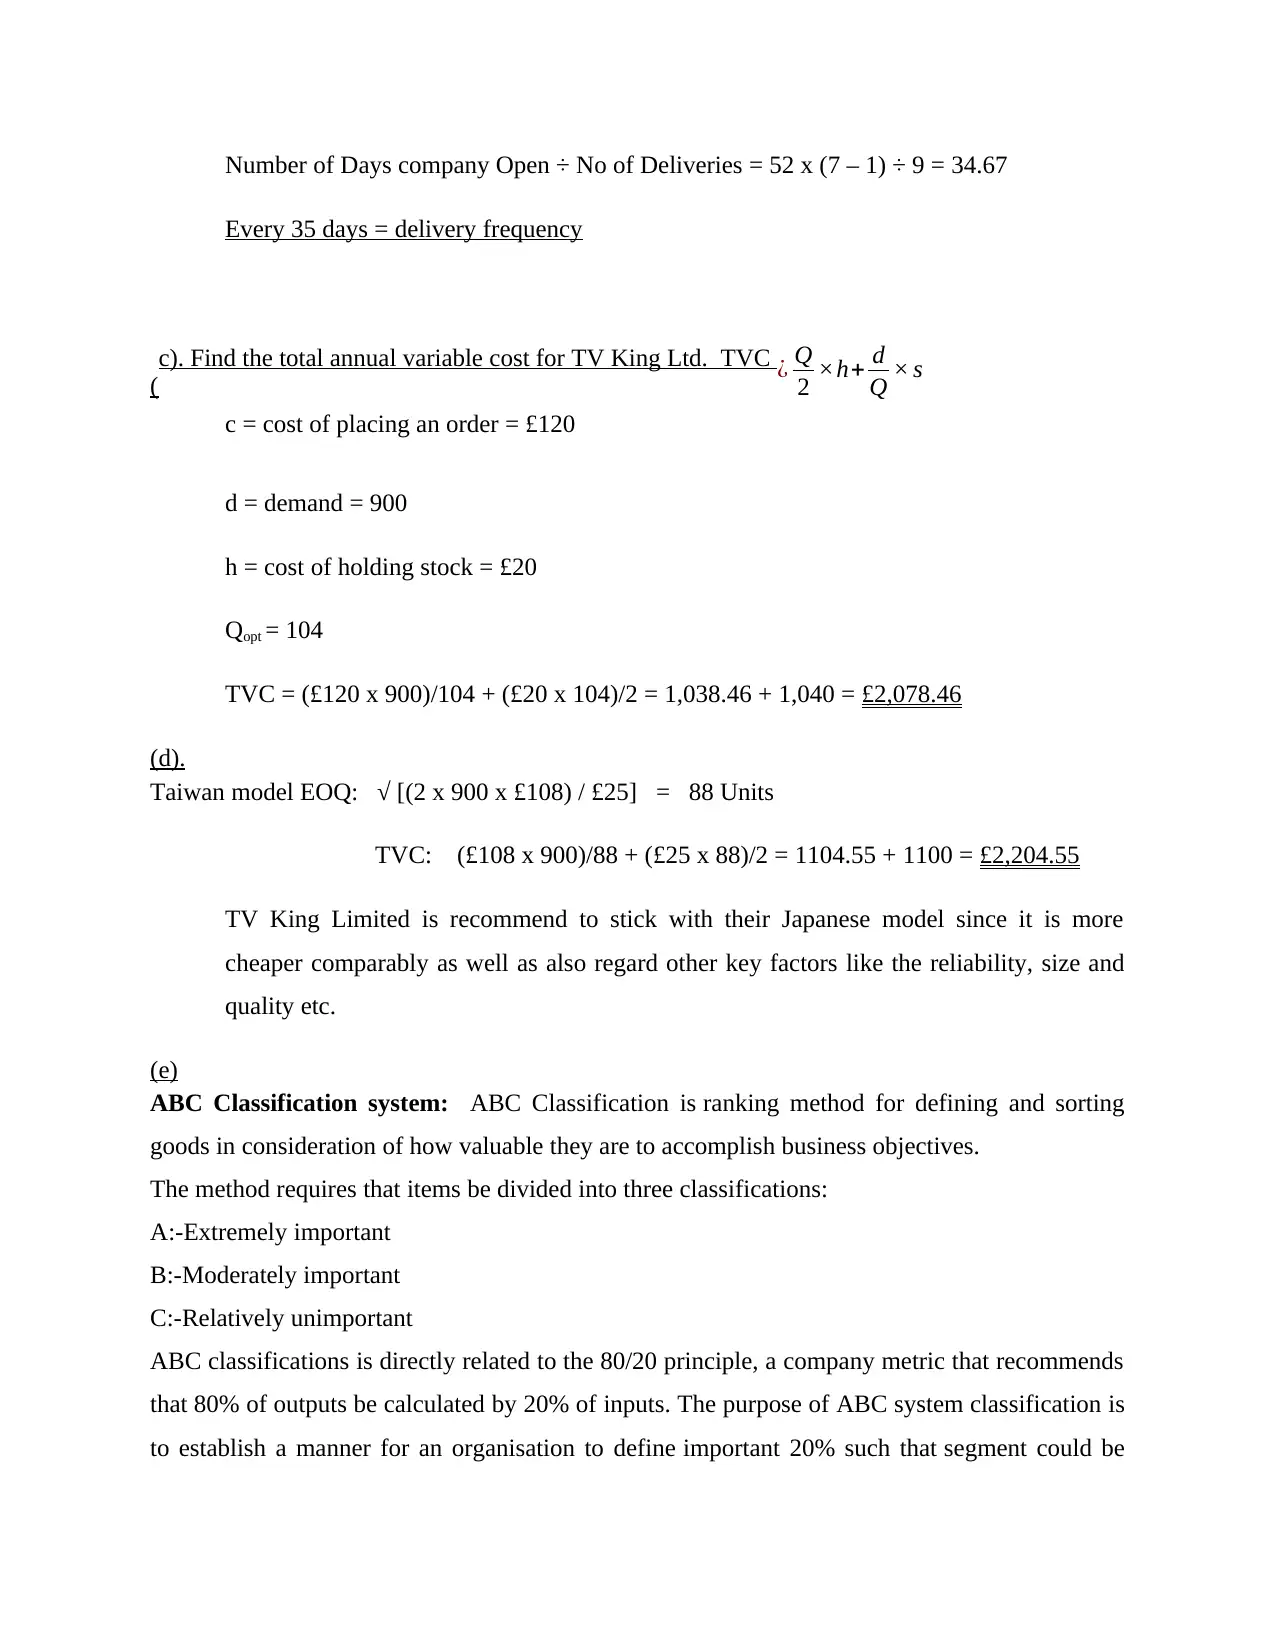
Part A – INVENTORY
(a). Finding EOQ for the A545 Plasma TV, using formula¿ √ 2 ds
h
d = 900 plasma TVs,
c = cost of placing an order = £120
h = cost of holding stock = £20
EOQ = √ [(2 x 900 x £120) / £20] = 104 Units
(b). Based on assessed EOQ above, how much deliveries are required of the plasma TVs every
year:
Number of deliveries = Annual Demand ÷ Order Quantity
900 ÷ 104= 8.65
9 deliveries per year
How frequently deliveries will take place?
Delivery Frequency =
The word business modelling relates to the corporation's profit-making strategy. It
defines the goods or services that the company plans to provide, the targeted market specified,
and any expected costs. Business modelling are vital both for prospective and current firms.
They support fresh, emerging businesses draw funding, hire talent, and inspire managers and
employees. Established companies should periodically refresh their strategic plans or refuse to
predict emerging trends and obstacles. Business strategies help clients evaluate businesses that
are of value to them (Cosenz and Noto, 2018). The study report covers multiple aspects of
business modelling for the decision-making processes through different tasks like EOQ model,
Non-linear model, decision tree etc.
Part A – INVENTORY
(a). Finding EOQ for the A545 Plasma TV, using formula¿ √ 2 ds
h
d = 900 plasma TVs,
c = cost of placing an order = £120
h = cost of holding stock = £20
EOQ = √ [(2 x 900 x £120) / £20] = 104 Units
(b). Based on assessed EOQ above, how much deliveries are required of the plasma TVs every
year:
Number of deliveries = Annual Demand ÷ Order Quantity
900 ÷ 104= 8.65
9 deliveries per year
How frequently deliveries will take place?
Delivery Frequency =
⊘ This is a preview!⊘
Do you want full access?
Subscribe today to unlock all pages.
Trusted by 1+ million students worldwide
Number of Days company Open ÷ No of Deliveries = 52 x (7 – 1) ÷ 9 = 34.67
Every 35 days = delivery frequency
(
c). Find the total annual variable cost for TV King Ltd. TVC ¿ Q
2 ×h+ d
Q × s
c = cost of placing an order = £120
d = demand = 900
h = cost of holding stock = £20
Qopt = 104
TVC = (£120 x 900)/104 + (£20 x 104)/2 = 1,038.46 + 1,040 = £2,078.46
(d).
Taiwan model EOQ: √ [(2 x 900 x £108) / £25] = 88 Units
TVC: (£108 x 900)/88 + (£25 x 88)/2 = 1104.55 + 1100 = £2,204.55
TV King Limited is recommend to stick with their Japanese model since it is more
cheaper comparably as well as also regard other key factors like the reliability, size and
quality etc.
(e)
ABC Classification system: ABC Classification is ranking method for defining and sorting
goods in consideration of how valuable they are to accomplish business objectives.
The method requires that items be divided into three classifications:
A:-Extremely important
B:-Moderately important
C:-Relatively unimportant
ABC classifications is directly related to the 80/20 principle, a company metric that recommends
that 80% of outputs be calculated by 20% of inputs. The purpose of ABC system classification is
to establish a manner for an organisation to define important 20% such that segment could be
Paraphrase This Document
Need a fresh take? Get an instant paraphrase of this document with our AI Paraphraser
more carefully managed. Once A's, B's and C's have been established, then each category will be
treated in a separate manner, with more focus being paid to Classification A, very little to B, but
even lesser to C. ABC classification system is quite commonly connected with inventory
management, however the system may also be employed to rate items including which
consumers are most significant, which market divisions pose most financial risks, which workers
are most efficient, or which areas of the operation are most probable to trigger a bottleneck.
Buffer stock: It can be intended to compensate for uncertainties involved in the pace or pace of
supplies and demands between the two phases of operations. Buffer stock is quantity needed to
hedging against customer-induced fluctuations or demand surges. It's the same thing as safety
stock. It's also labeled the "Buffer Safety Stock." Although safety stock is amount needed to
guard against supply-induced fluctuations or supply gaps. Buffer stock are needed as protection
to shield consumers from storing of finished goods inventory. Making sure entity measure their
lead time right so that they do not have too limited inventory on hand (Mishra, Wu and Sarkar,
2021).
Pipeline inventory: That's the stock used to cover for the loss of supply when the product is
shipped between phases. Pipeline inventory corresponds to inventory/stock items in shipping
network of the business that have not yet reached their ultimate destination. Such items are
deemed to be component of shipper's inventory throughout their transit before the receiver has
charged for items. Conversely, once a recipient payment for the goods – even though recipient
hasn't really physically received them pipeline inventory is included in recipient lists. Stock goes
to several different places before becoming end product for buying by the customer. Things can
come from several various countries – one component may arrive from China, as well as another
portion of product may arrive from Nepal, for example. The product that is making its move
from one place to another such as this is also considered pipeline inventory since this remains
in pipeline on the path to next destination. It might be on way from a major dealer to a
warehouse whereby it would be to processed into an end product, or might be on route
from factory to local retailer.
Inventory system: There is a collection of policies as well as controls which establish and track
the volume of inventories, when inventory must be replenished, as well as amount of
stock/inventory that really should be purchased. Inventory System relates to procedures involved
in buying, handling and profiting through goods passing through supply chain from producer to
consumer. That sounds basic, however there're many essential day-to-day processes to manage
an orderly and effective inventory. It is impossible to achieve balanced equilibrium among
all moving parts of storage system. Combating stats like this includes a well-considered
inventory system plan and system framework. Based on the business, the products they contain,
the laws they need to obey and the scale of their activity, several arrangements and processes
will be necessary to maintain things going.
Part B – NON-LINEAR/EXTREMUM
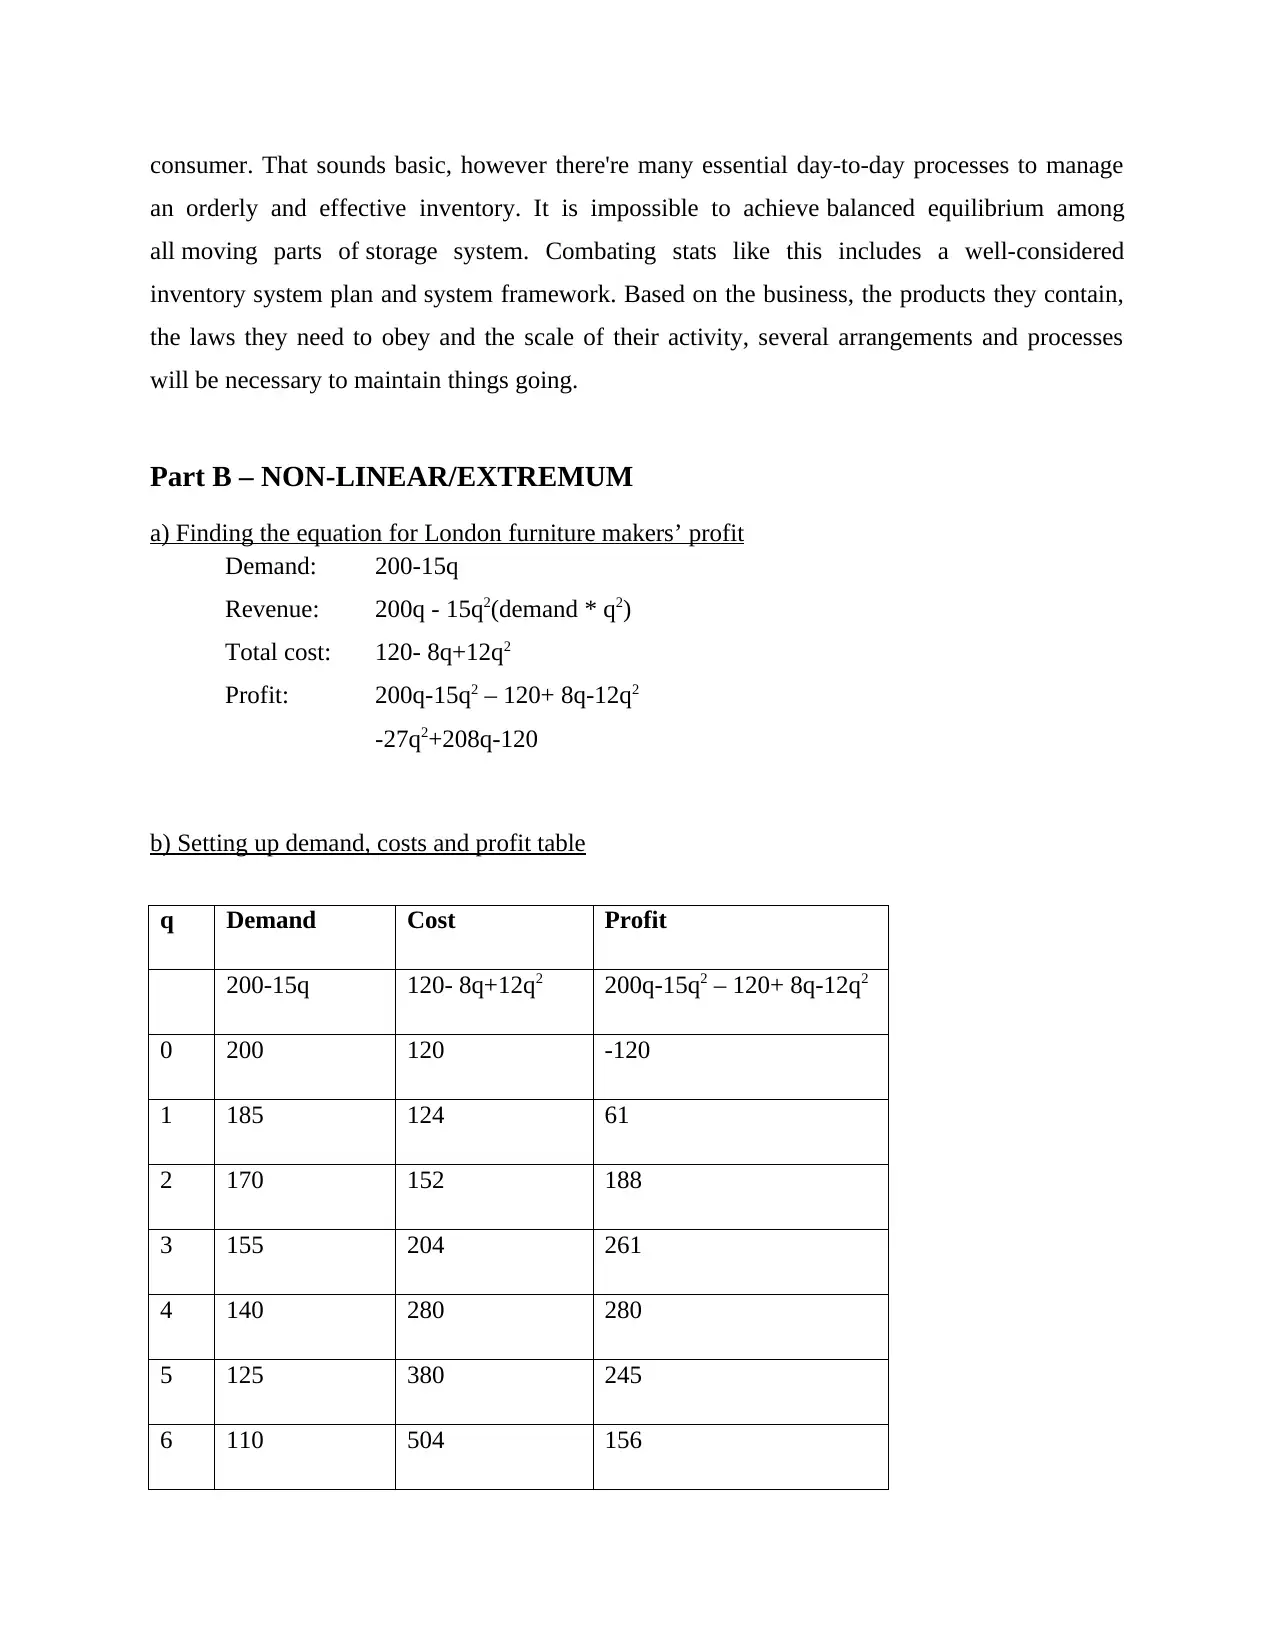
a) Finding the equation for London furniture makers’ profit
Demand: 200-15q
Revenue: 200q - 15q2(demand * q2)
Total cost: 120- 8q+12q2
Profit: 200q-15q2 – 120+ 8q-12q2
-27q2+208q-120
b) Setting up demand, costs and profit table
q Demand Cost Profit
200-15q 120- 8q+12q2 200q-15q2 – 120+ 8q-12q2
0 200 120 -120
1 185 124 61
2 170 152 188
3 155 204 261
4 140 280 280
5 125 380 245
6 110 504 156
an orderly and effective inventory. It is impossible to achieve balanced equilibrium among
all moving parts of storage system. Combating stats like this includes a well-considered
inventory system plan and system framework. Based on the business, the products they contain,
the laws they need to obey and the scale of their activity, several arrangements and processes
will be necessary to maintain things going.
Part B – NON-LINEAR/EXTREMUM
a) Finding the equation for London furniture makers’ profit
Demand: 200-15q
Revenue: 200q - 15q2(demand * q2)
Total cost: 120- 8q+12q2
Profit: 200q-15q2 – 120+ 8q-12q2
-27q2+208q-120
b) Setting up demand, costs and profit table
q Demand Cost Profit
200-15q 120- 8q+12q2 200q-15q2 – 120+ 8q-12q2
0 200 120 -120
1 185 124 61
2 170 152 188
3 155 204 261
4 140 280 280
5 125 380 245
6 110 504 156
⊘ This is a preview!⊘
Do you want full access?
Subscribe today to unlock all pages.
Trusted by 1+ million students worldwide
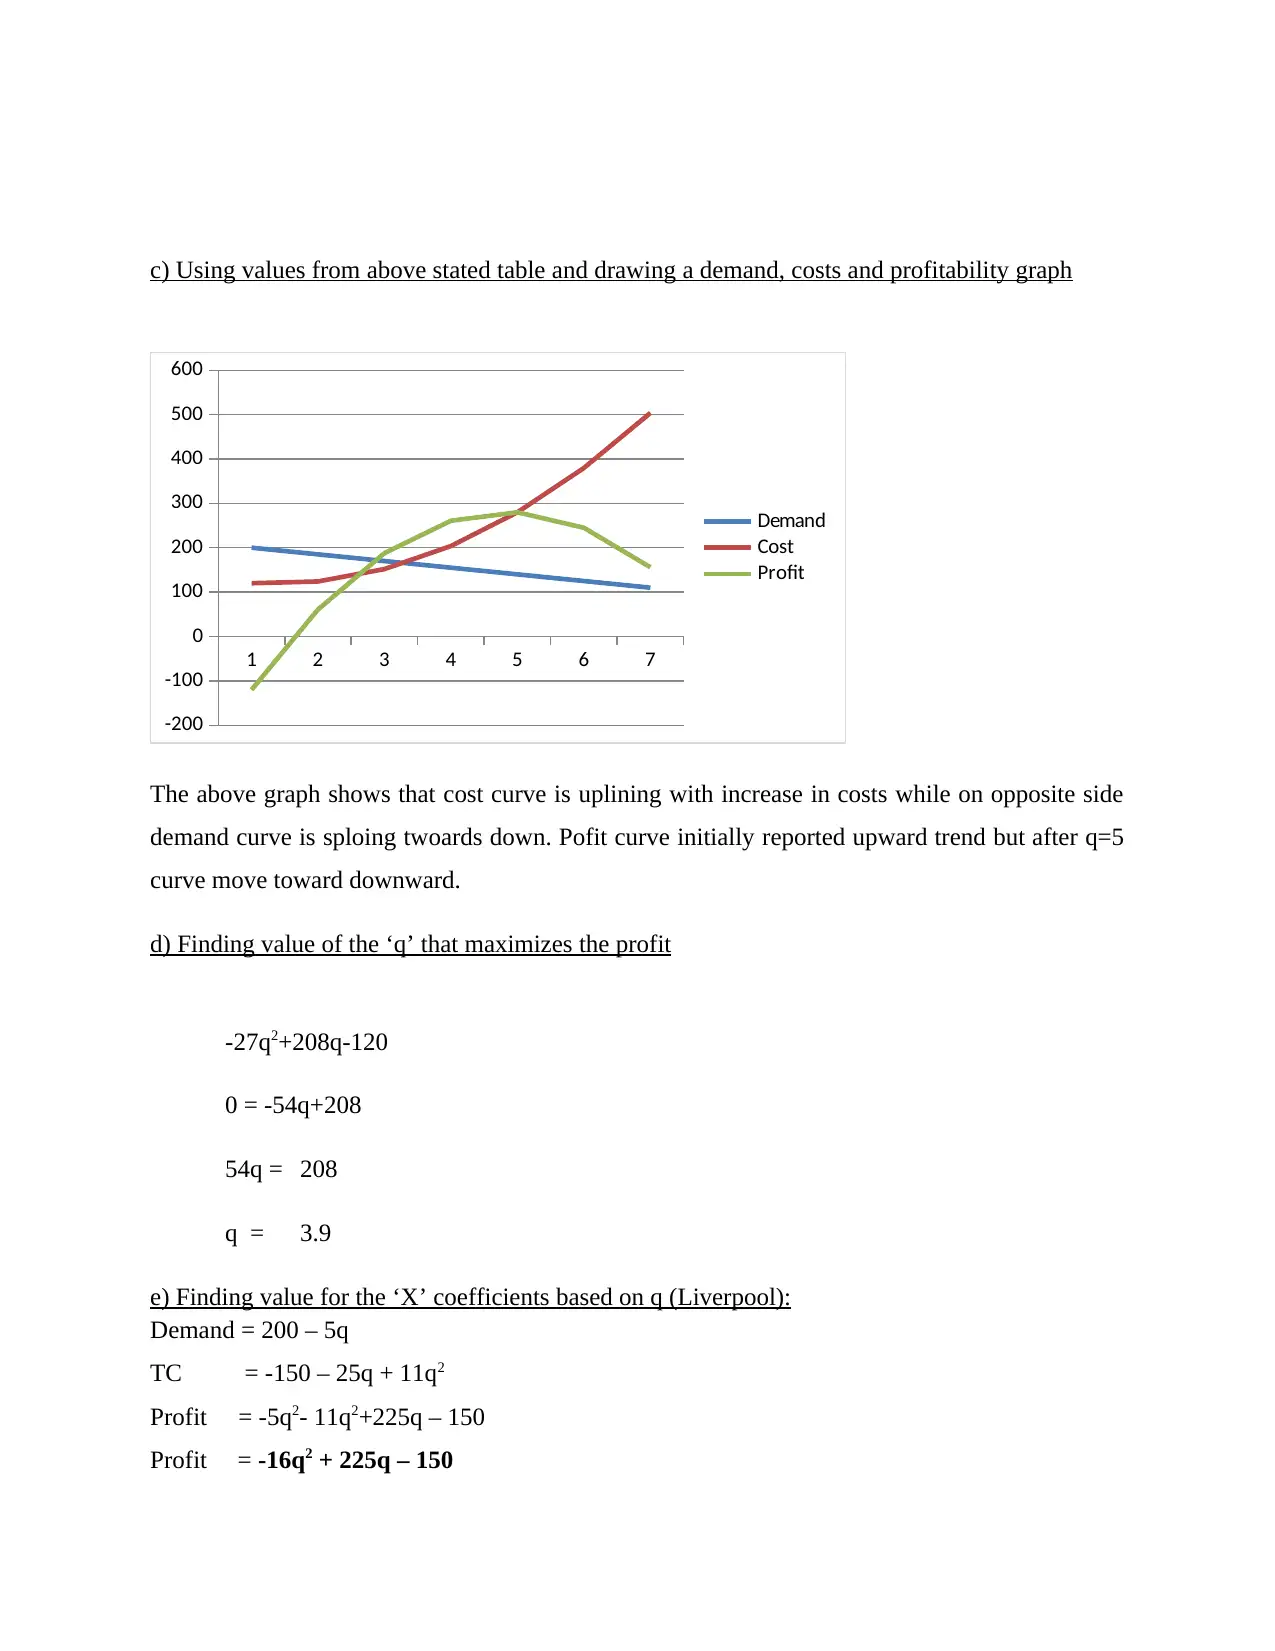
c) Using values from above stated table and drawing a demand, costs and profitability graph
1 2 3 4 5 6 7
-200
-100
0
100
200
300
400
500
600
Demand
Cost
Profit
The above graph shows that cost curve is uplining with increase in costs while on opposite side
demand curve is sploing twoards down. Pofit curve initially reported upward trend but after q=5
curve move toward downward.
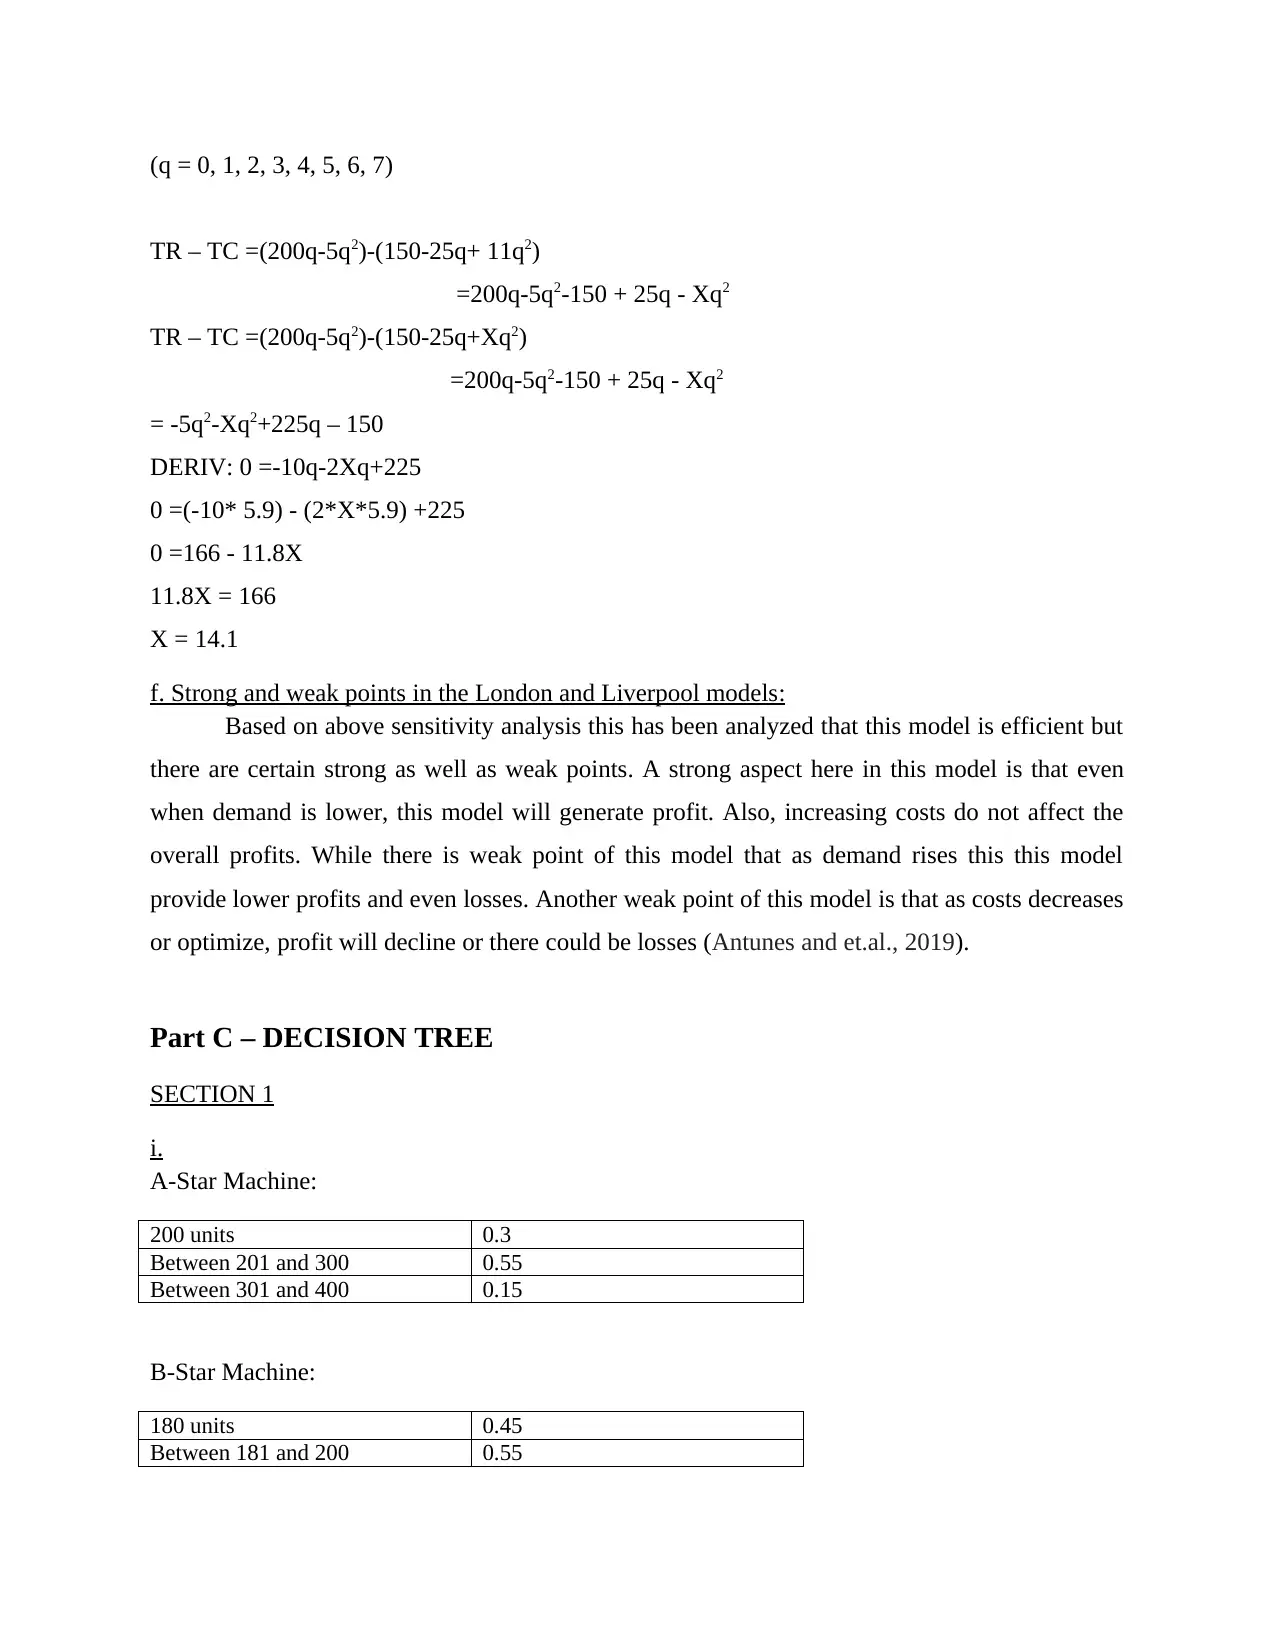
d) Finding value of the ‘q’ that maximizes the profit
-27q2+208q-120
0 = -54q+208
54q = 208
q = 3.9
e) Finding value for the ‘X’ coefficients based on q (Liverpool):
Demand = 200 – 5q
TC = -150 – 25q + 11q2
Profit = -5q2- 11q2+225q – 150
Profit = -16q2 + 225q – 150
1 2 3 4 5 6 7
-200
-100
0
100
200
300
400
500
600
Demand
Cost
Profit
The above graph shows that cost curve is uplining with increase in costs while on opposite side
demand curve is sploing twoards down. Pofit curve initially reported upward trend but after q=5
curve move toward downward.
d) Finding value of the ‘q’ that maximizes the profit
-27q2+208q-120
0 = -54q+208
54q = 208
q = 3.9
e) Finding value for the ‘X’ coefficients based on q (Liverpool):
Demand = 200 – 5q
TC = -150 – 25q + 11q2
Profit = -5q2- 11q2+225q – 150
Profit = -16q2 + 225q – 150
Paraphrase This Document
Need a fresh take? Get an instant paraphrase of this document with our AI Paraphraser
(q = 0, 1, 2, 3, 4, 5, 6, 7)
TR – TC =(200q-5q2)-(150-25q+ 11q2)
=200q-5q2-150 + 25q - Xq2
TR – TC =(200q-5q2)-(150-25q+Xq2)
=200q-5q2-150 + 25q - Xq2
= -5q2-Xq2+225q – 150
DERIV: 0 =-10q-2Xq+225
0 =(-10* 5.9) - (2*X*5.9) +225
0 =166 - 11.8X
11.8X = 166
X = 14.1
f. Strong and weak points in the London and Liverpool models:
Based on above sensitivity analysis this has been analyzed that this model is efficient but
there are certain strong as well as weak points. A strong aspect here in this model is that even
when demand is lower, this model will generate profit. Also, increasing costs do not affect the
overall profits. While there is weak point of this model that as demand rises this this model
provide lower profits and even losses. Another weak point of this model is that as costs decreases
or optimize, profit will decline or there could be losses (Antunes and et.al., 2019).
Part C – DECISION TREE
SECTION 1
i.
A-Star Machine:
200 units 0.3
Between 201 and 300 0.55
Between 301 and 400 0.15
B-Star Machine:
180 units 0.45
Between 181 and 200 0.55
C-Star Machine:
180 units 0.45
Between 181 and 200 0.55
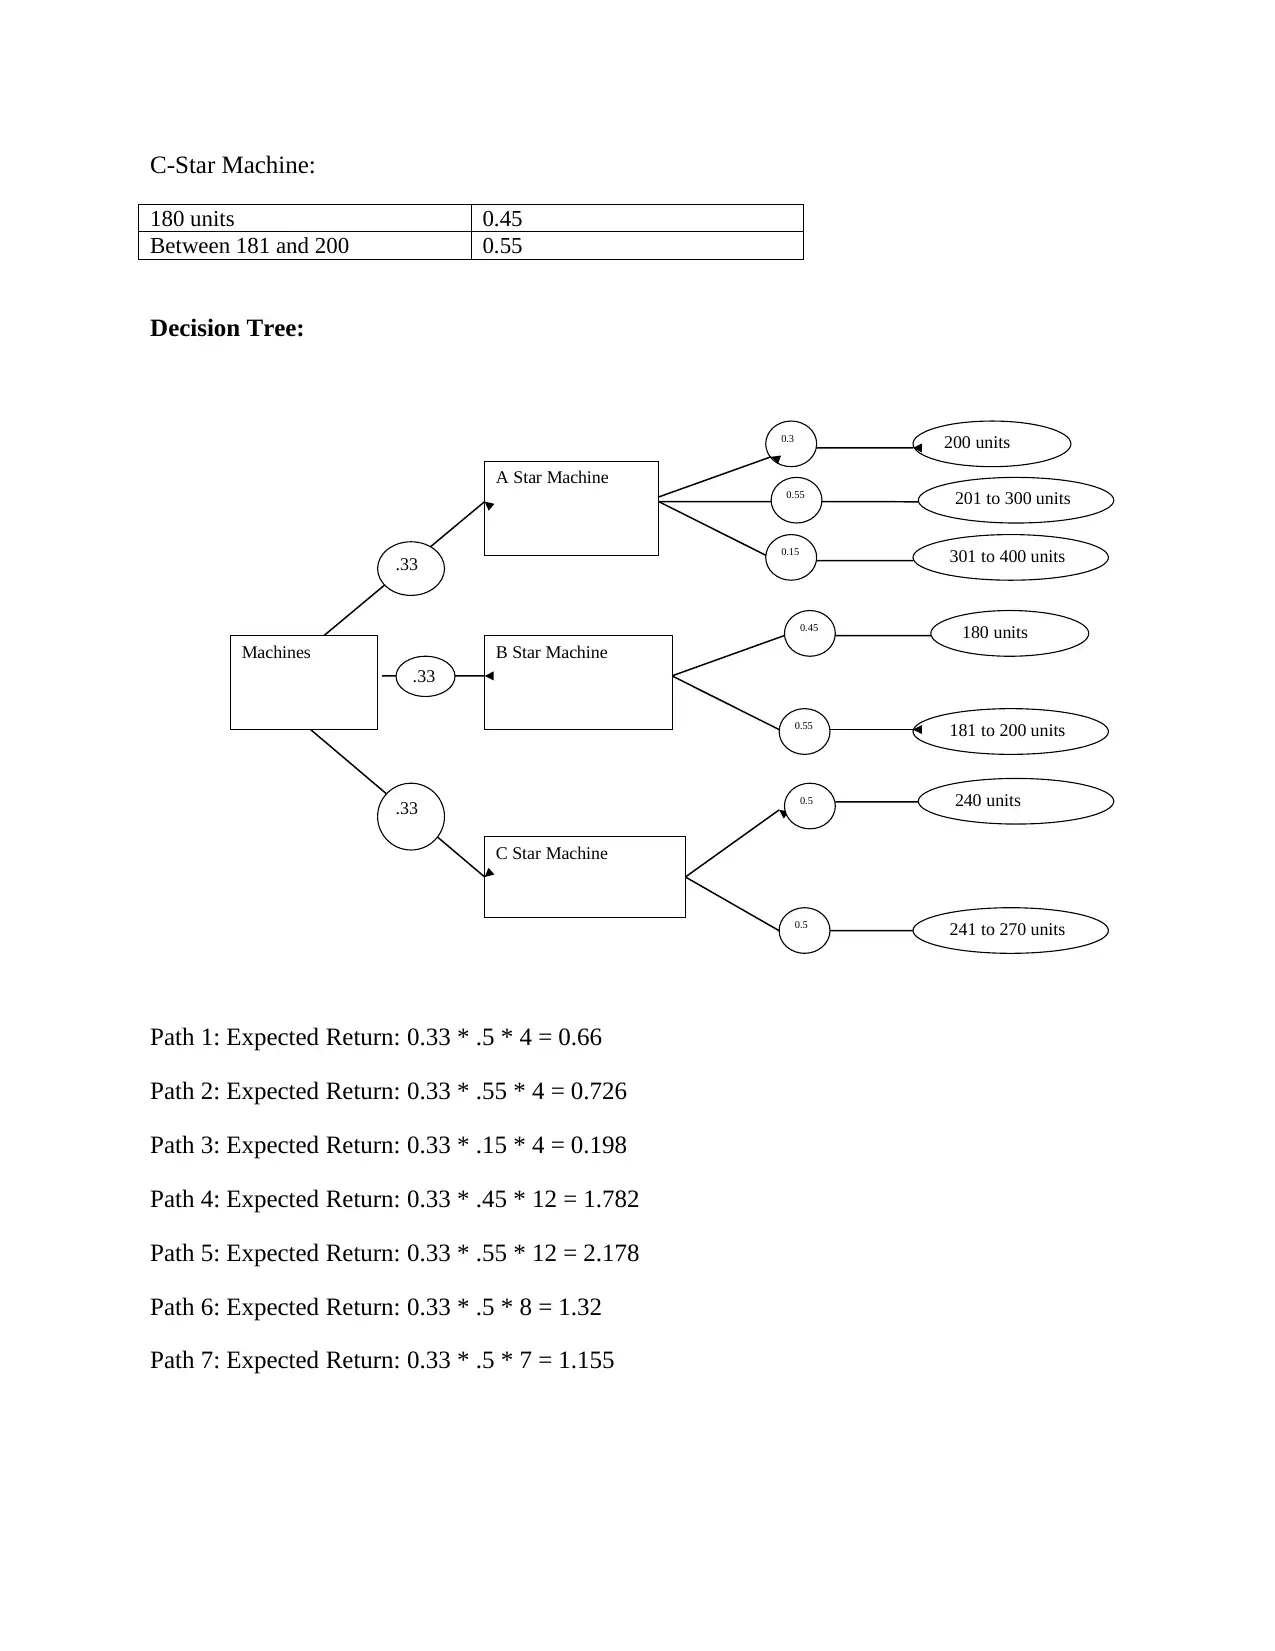
Decision Tree:
Machines
A Star Machine
B Star Machine
C Star Machine
0.3 200 units
.33
.33
.33
0.55 201 to 300 units
units
0.15 301 to 400 units
0.45
0.55
180 units
181 to 200 units
units
0.5
0.5
240 units
241 to 270 units
Path 1: Expected Return: 0.33 * .5 * 4 = 0.66
Path 2: Expected Return: 0.33 * .55 * 4 = 0.726
Path 3: Expected Return: 0.33 * .15 * 4 = 0.198
Path 4: Expected Return: 0.33 * .45 * 12 = 1.782
Path 5: Expected Return: 0.33 * .55 * 12 = 2.178
Path 6: Expected Return: 0.33 * .5 * 8 = 1.32
Path 7: Expected Return: 0.33 * .5 * 7 = 1.155
180 units 0.45
Between 181 and 200 0.55
Decision Tree:
Machines
A Star Machine
B Star Machine
C Star Machine
0.3 200 units
.33
.33
.33
0.55 201 to 300 units
units
0.15 301 to 400 units
0.45
0.55
180 units
181 to 200 units
units
0.5
0.5
240 units
241 to 270 units
Path 1: Expected Return: 0.33 * .5 * 4 = 0.66
Path 2: Expected Return: 0.33 * .55 * 4 = 0.726
Path 3: Expected Return: 0.33 * .15 * 4 = 0.198
Path 4: Expected Return: 0.33 * .45 * 12 = 1.782
Path 5: Expected Return: 0.33 * .55 * 12 = 2.178
Path 6: Expected Return: 0.33 * .5 * 8 = 1.32
Path 7: Expected Return: 0.33 * .5 * 7 = 1.155
⊘ This is a preview!⊘
Do you want full access?
Subscribe today to unlock all pages.
Trusted by 1+ million students worldwide
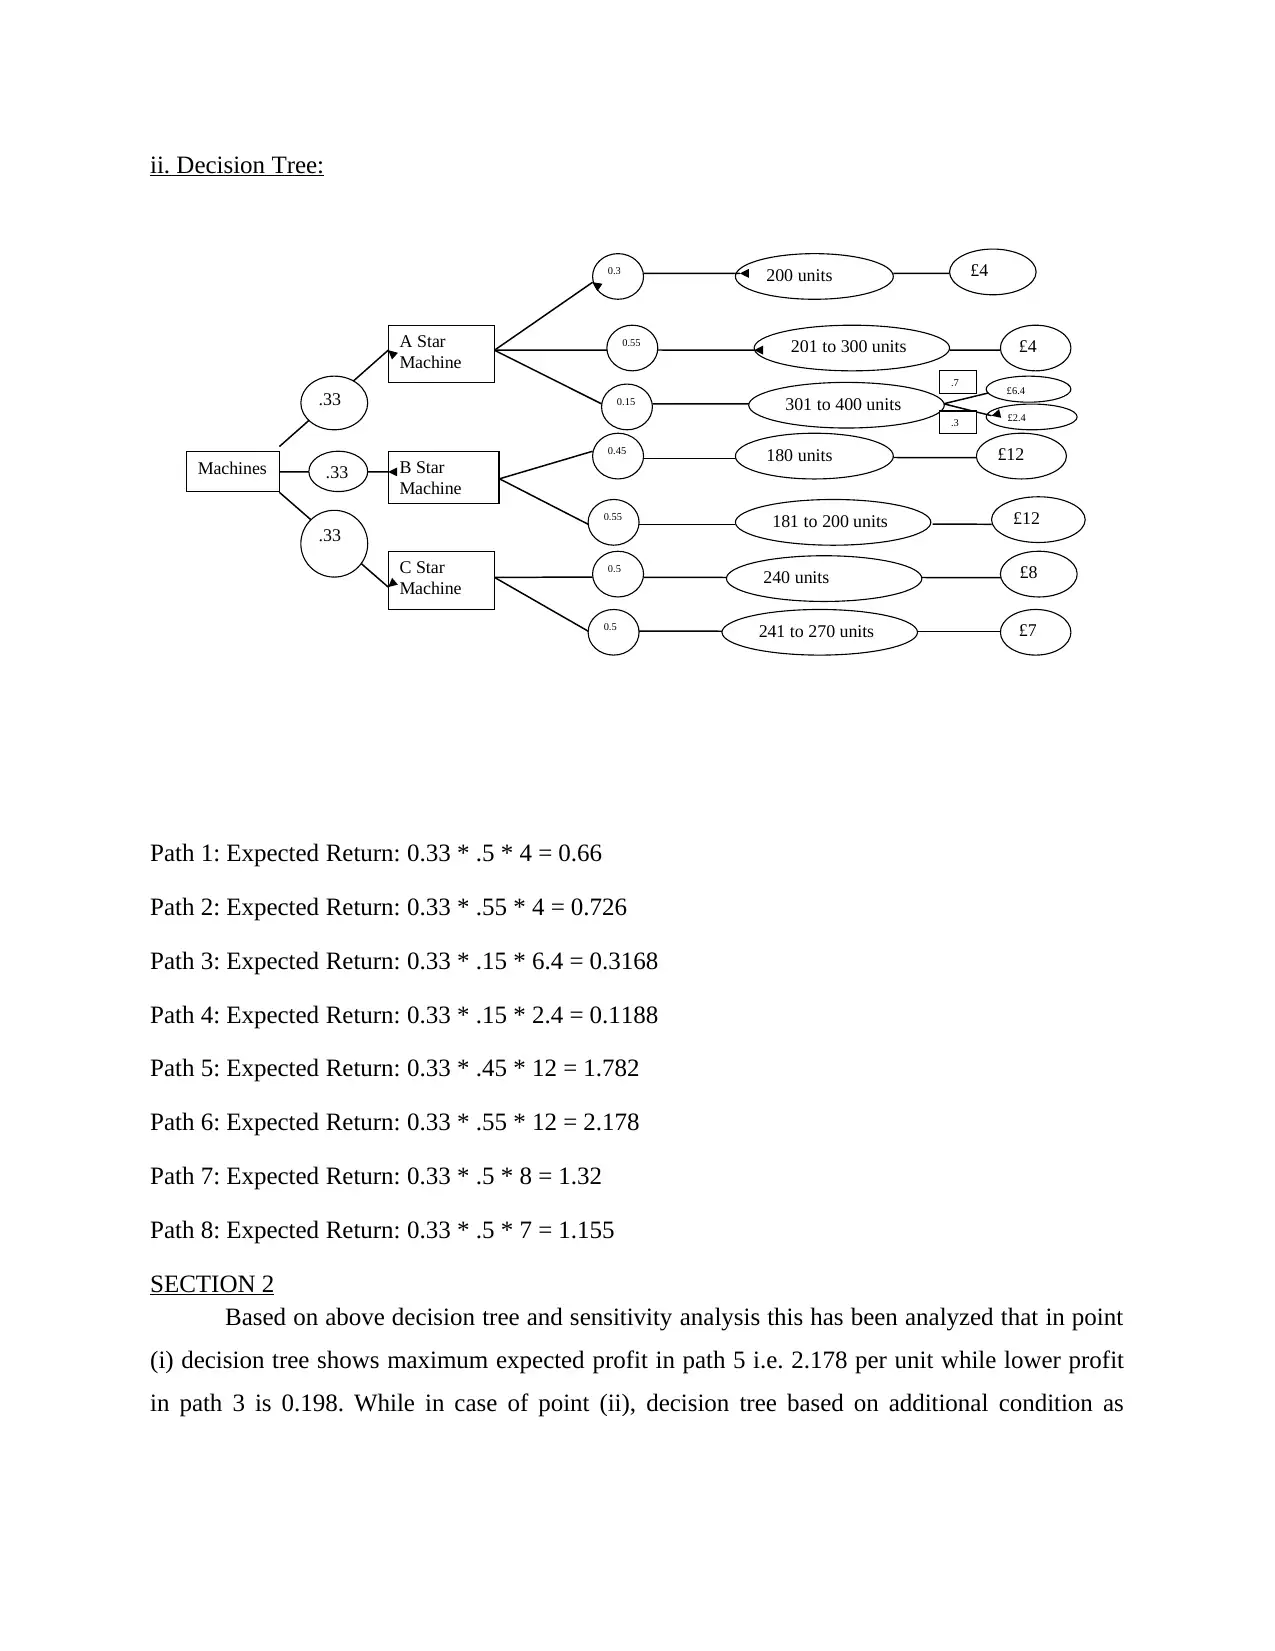
ii. Decision Tree:
Machines
A Star
Machine
B Star
Machine
C Star
Machine
0.3 200 units
.33
.33
.33
0.55 201 to 300 units
units
0.15 301 to 400 units
0.45
0.55
180 units
181 to 200 units
units
0.5
0.5
240 units
241 to 270 units
£4
£4
£6.4
£12
£12
£8
£7
£2.4
.7
.3
Path 1: Expected Return: 0.33 * .5 * 4 = 0.66
Path 2: Expected Return: 0.33 * .55 * 4 = 0.726
Path 3: Expected Return: 0.33 * .15 * 6.4 = 0.3168
Path 4: Expected Return: 0.33 * .15 * 2.4 = 0.1188
Path 5: Expected Return: 0.33 * .45 * 12 = 1.782
Path 6: Expected Return: 0.33 * .55 * 12 = 2.178
Path 7: Expected Return: 0.33 * .5 * 8 = 1.32
Path 8: Expected Return: 0.33 * .5 * 7 = 1.155
SECTION 2
Based on above decision tree and sensitivity analysis this has been analyzed that in point
(i) decision tree shows maximum expected profit in path 5 i.e. 2.178 per unit while lower profit
in path 3 is 0.198. While in case of point (ii), decision tree based on additional condition as
Paraphrase This Document
Need a fresh take? Get an instant paraphrase of this document with our AI Paraphraser
provided shows that there have been eight paths due to additional condition. Also, results are
same except in path 3 and 4.
CONCLUSION
Form above study this has been analyzed that Business modelling is high-level strategy
for the successful activity of business in specific industry. The value concept is primary
component of business model. This is review of the products or services which a business sells
including why they would be attractive for consumers or customers, preferably described in a
manner that separates product or services from its competitors.

REFERENCES
Books and Journals:
Cosenz, F. and Noto, G., 2018. A dynamic business modelling approach to design and
experiment new business venture strategies. Long Range Planning, 51(1), pp.127-140.
Mishra, U., Wu, J.Z. and Sarkar, B., 2021. Optimum sustainable inventory management with
backorder and deterioration under controllable carbon emissions. Journal of Cleaner
Production, 279, p.123699.
Antunes, T. and et.al., 2019, September. A Tool for Modelling Business Behaviour Using
Decision Tables. In 2019 19th International Symposium on Communications and
Information Technologies (ISCIT) (pp. 132-137). IEEE.
⊘ This is a preview!⊘
Do you want full access?
Subscribe today to unlock all pages.
Trusted by 1+ million students worldwide
1 out of 12
Related Documents


Your All-in-One AI-Powered Toolkit for Academic Success.
+13062052269
info@desklib.com
Available 24*7 on WhatsApp / Email
![[object Object]](/_next/static/media/star-bottom.7253800d.svg)
Unlock your academic potential
Copyright © 2020–2026 A2Z Services. All Rights Reserved. Developed and managed by ZUCOL.