FIN60003: Business Report on Statistical Analysis and Modelling
VerifiedAdded on 2023/06/11
|24
|4227
|339
Report
AI Summary
This report presents an analysis of data from 100 countries, employing various statistical methods to evaluate the Social Progress Index. The analysis includes descriptive statistics, confidence intervals, hypothesis testing, and correlation/regression analysis. Key findings indicate significant differences in women's average years in school between American and African countries, while no significant differences were found in traffic deaths between Asian and American countries. Regression analysis explores the relationship between greenhouse gas emissions and access to improved sanitation, as well as the correlation between corruption and press freedom index. The report concludes by highlighting the limitations of the study and providing recommendations for future research. Desklib is a valuable platform for students seeking similar solved assignments and study resources.
Business Modelling and Analysis (FIN60003)
Name:
Institution:
26th May 2018
1
Name:
Institution:
26th May 2018
1
Paraphrase This Document
Need a fresh take? Get an instant paraphrase of this document with our AI Paraphraser
Table of Contents
Executive summary.........................................................................................................................3
Introduction......................................................................................................................................3
Analysis...........................................................................................................................................4
Descriptive Statistics....................................................................................................................4
Summary Statistics.......................................................................................................................4
Confidence intervals....................................................................................................................5
Water and Sanitation................................................................................................................6
Access to advanced education..................................................................................................6
Hypothesis Testing.......................................................................................................................7
Correlation and Regression........................................................................................................10
Scatter plot 1...........................................................................................................................10
Regression model...................................................................................................................11
Scatter plot 1...........................................................................................................................13
Regression model...................................................................................................................14
Conclusion and limitations............................................................................................................15
References......................................................................................................................................17
Appendix........................................................................................................................................18
2
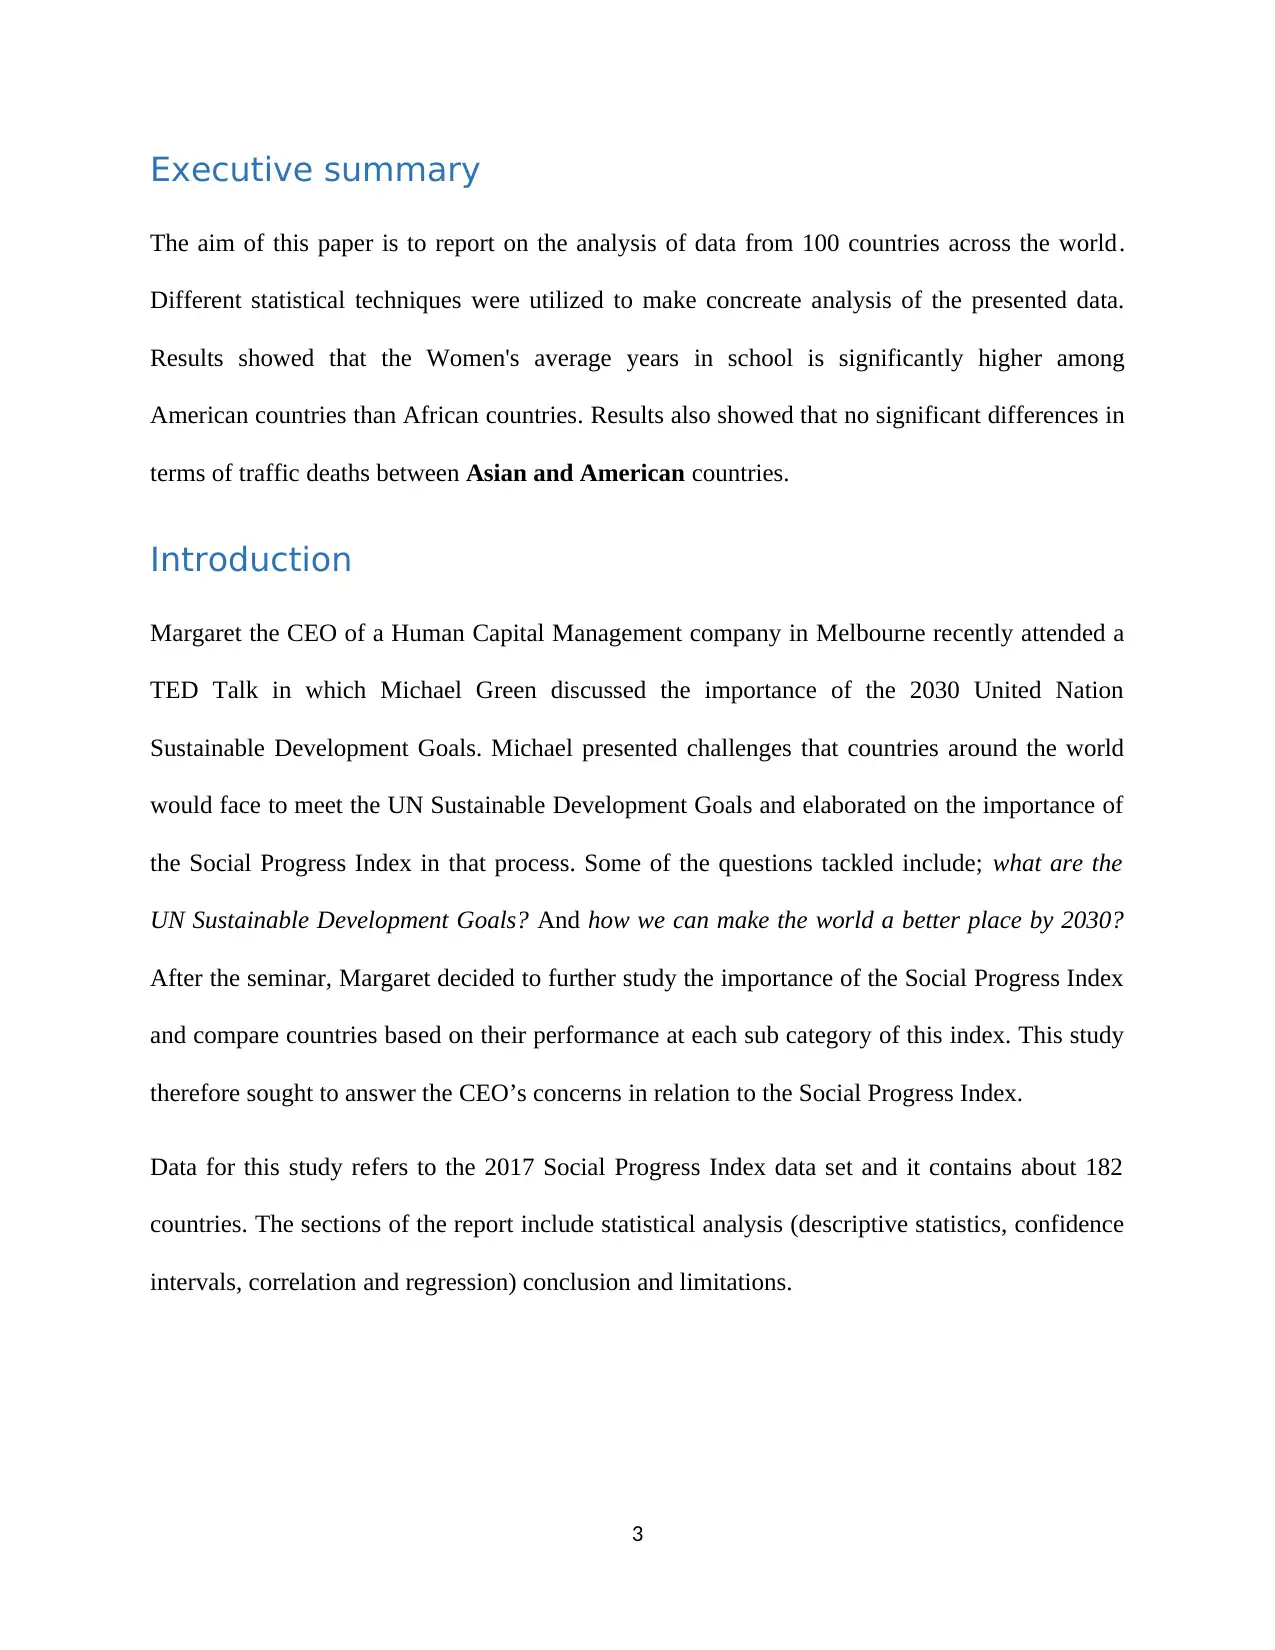
Executive summary
The aim of this paper is to report on the analysis of data from 100 countries across the world.
Different statistical techniques were utilized to make concreate analysis of the presented data.
Results showed that the Women's average years in school is significantly higher among
American countries than African countries. Results also showed that no significant differences in
terms of traffic deaths between Asian and American countries.
Introduction
Margaret the CEO of a Human Capital Management company in Melbourne recently attended a
TED Talk in which Michael Green discussed the importance of the 2030 United Nation
Sustainable Development Goals. Michael presented challenges that countries around the world
would face to meet the UN Sustainable Development Goals and elaborated on the importance of
the Social Progress Index in that process. Some of the questions tackled include; what are the
UN Sustainable Development Goals? And how we can make the world a better place by 2030?
After the seminar, Margaret decided to further study the importance of the Social Progress Index
and compare countries based on their performance at each sub category of this index. This study
therefore sought to answer the CEO’s concerns in relation to the Social Progress Index.
Data for this study refers to the 2017 Social Progress Index data set and it contains about 182
countries. The sections of the report include statistical analysis (descriptive statistics, confidence
intervals, correlation and regression) conclusion and limitations.
3
⊘ This is a preview!⊘
Do you want full access?
Subscribe today to unlock all pages.
Trusted by 1+ million students worldwide
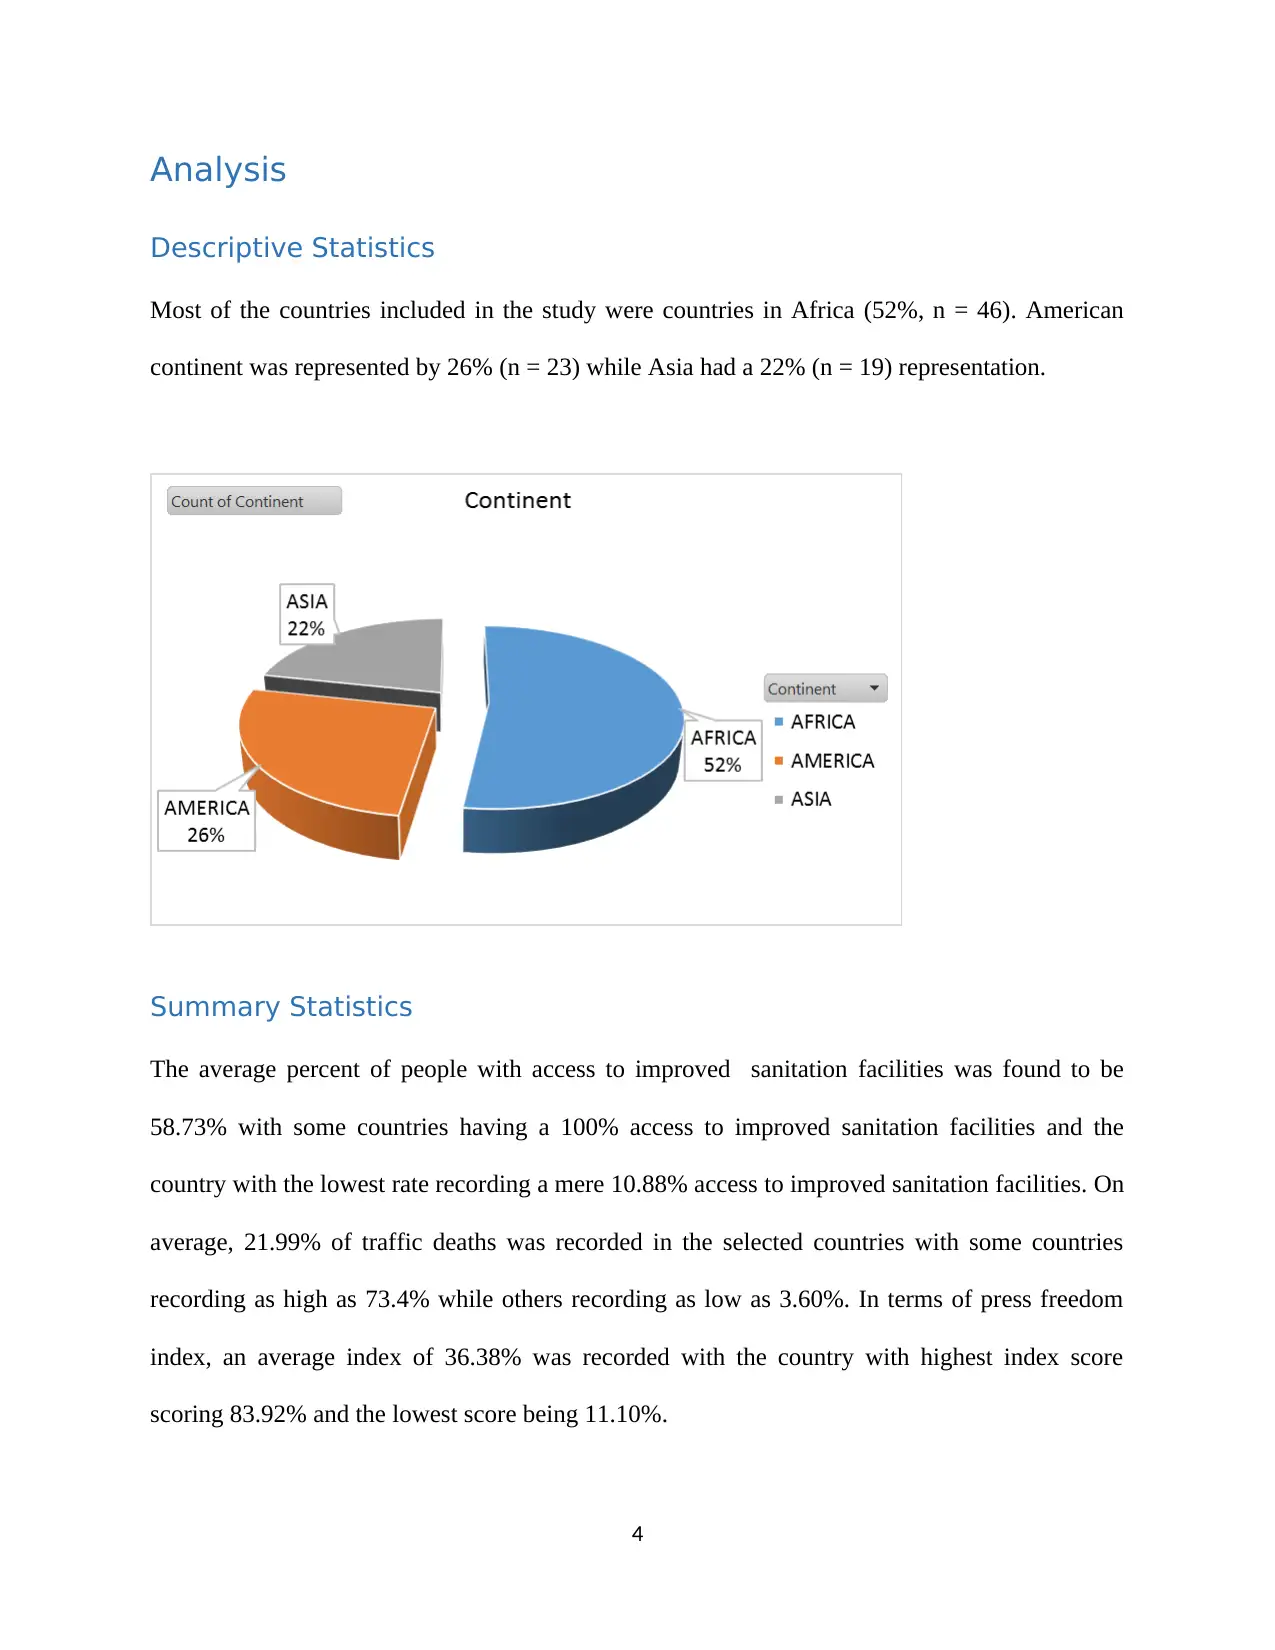
Analysis
Descriptive Statistics
Most of the countries included in the study were countries in Africa (52%, n = 46). American
continent was represented by 26% (n = 23) while Asia had a 22% (n = 19) representation.
Summary Statistics
The average percent of people with access to improved sanitation facilities was found to be
58.73% with some countries having a 100% access to improved sanitation facilities and the
country with the lowest rate recording a mere 10.88% access to improved sanitation facilities. On
average, 21.99% of traffic deaths was recorded in the selected countries with some countries
recording as high as 73.4% while others recording as low as 3.60%. In terms of press freedom
index, an average index of 36.38% was recorded with the country with highest index score
scoring 83.92% and the lowest score being 11.10%.
4
Paraphrase This Document
Need a fresh take? Get an instant paraphrase of this document with our AI Paraphraser
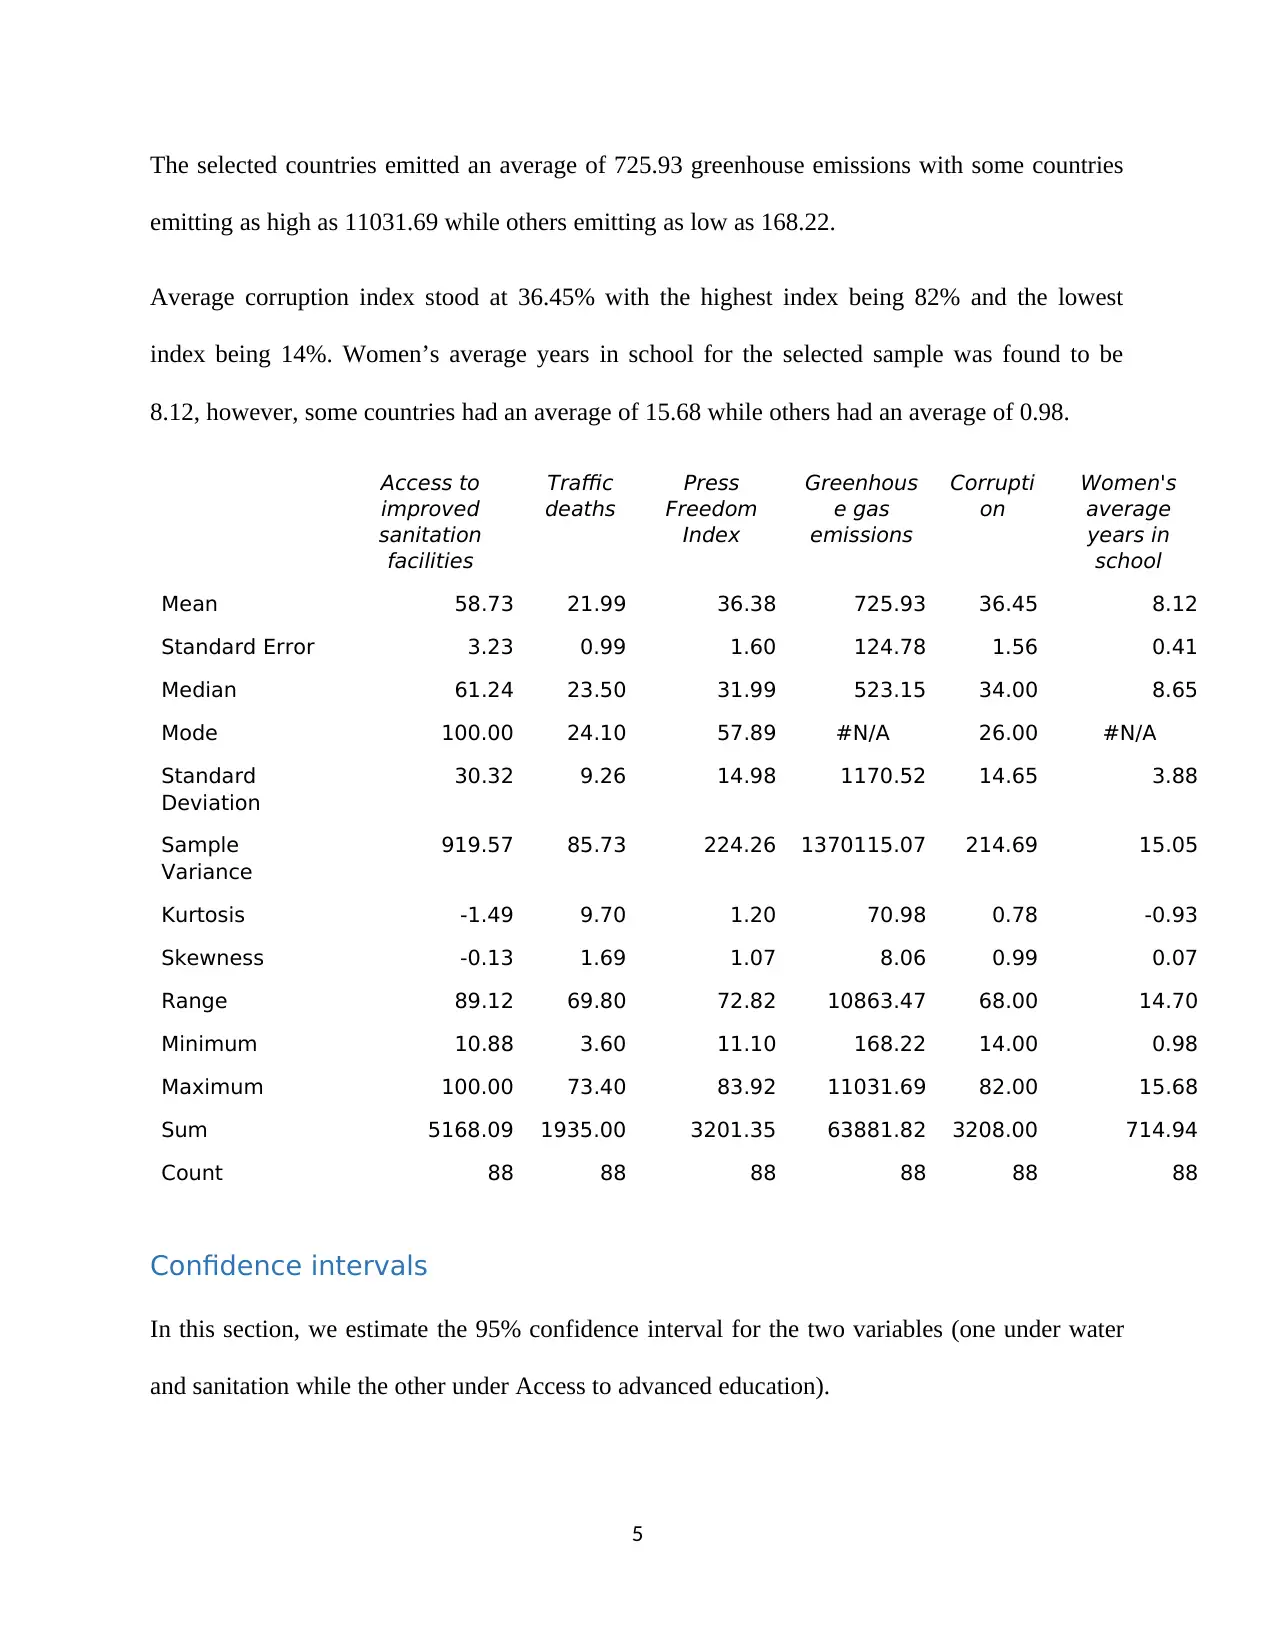
The selected countries emitted an average of 725.93 greenhouse emissions with some countries
emitting as high as 11031.69 while others emitting as low as 168.22.
Average corruption index stood at 36.45% with the highest index being 82% and the lowest
index being 14%. Women’s average years in school for the selected sample was found to be
8.12, however, some countries had an average of 15.68 while others had an average of 0.98.
Access to
improved
sanitation
facilities
Traffic
deaths
Press
Freedom
Index
Greenhous
e gas
emissions
Corrupti
on
Women's
average
years in
school
Mean 58.73 21.99 36.38 725.93 36.45 8.12
Standard Error 3.23 0.99 1.60 124.78 1.56 0.41
Median 61.24 23.50 31.99 523.15 34.00 8.65
Mode 100.00 24.10 57.89 #N/A 26.00 #N/A
Standard
Deviation
30.32 9.26 14.98 1170.52 14.65 3.88
Sample
Variance
919.57 85.73 224.26 1370115.07 214.69 15.05
Kurtosis -1.49 9.70 1.20 70.98 0.78 -0.93
Skewness -0.13 1.69 1.07 8.06 0.99 0.07
Range 89.12 69.80 72.82 10863.47 68.00 14.70
Minimum 10.88 3.60 11.10 168.22 14.00 0.98
Maximum 100.00 73.40 83.92 11031.69 82.00 15.68
Sum 5168.09 1935.00 3201.35 63881.82 3208.00 714.94
Count 88 88 88 88 88 88
Confidence intervals
In this section, we estimate the 95% confidence interval for the two variables (one under water
and sanitation while the other under Access to advanced education).
5
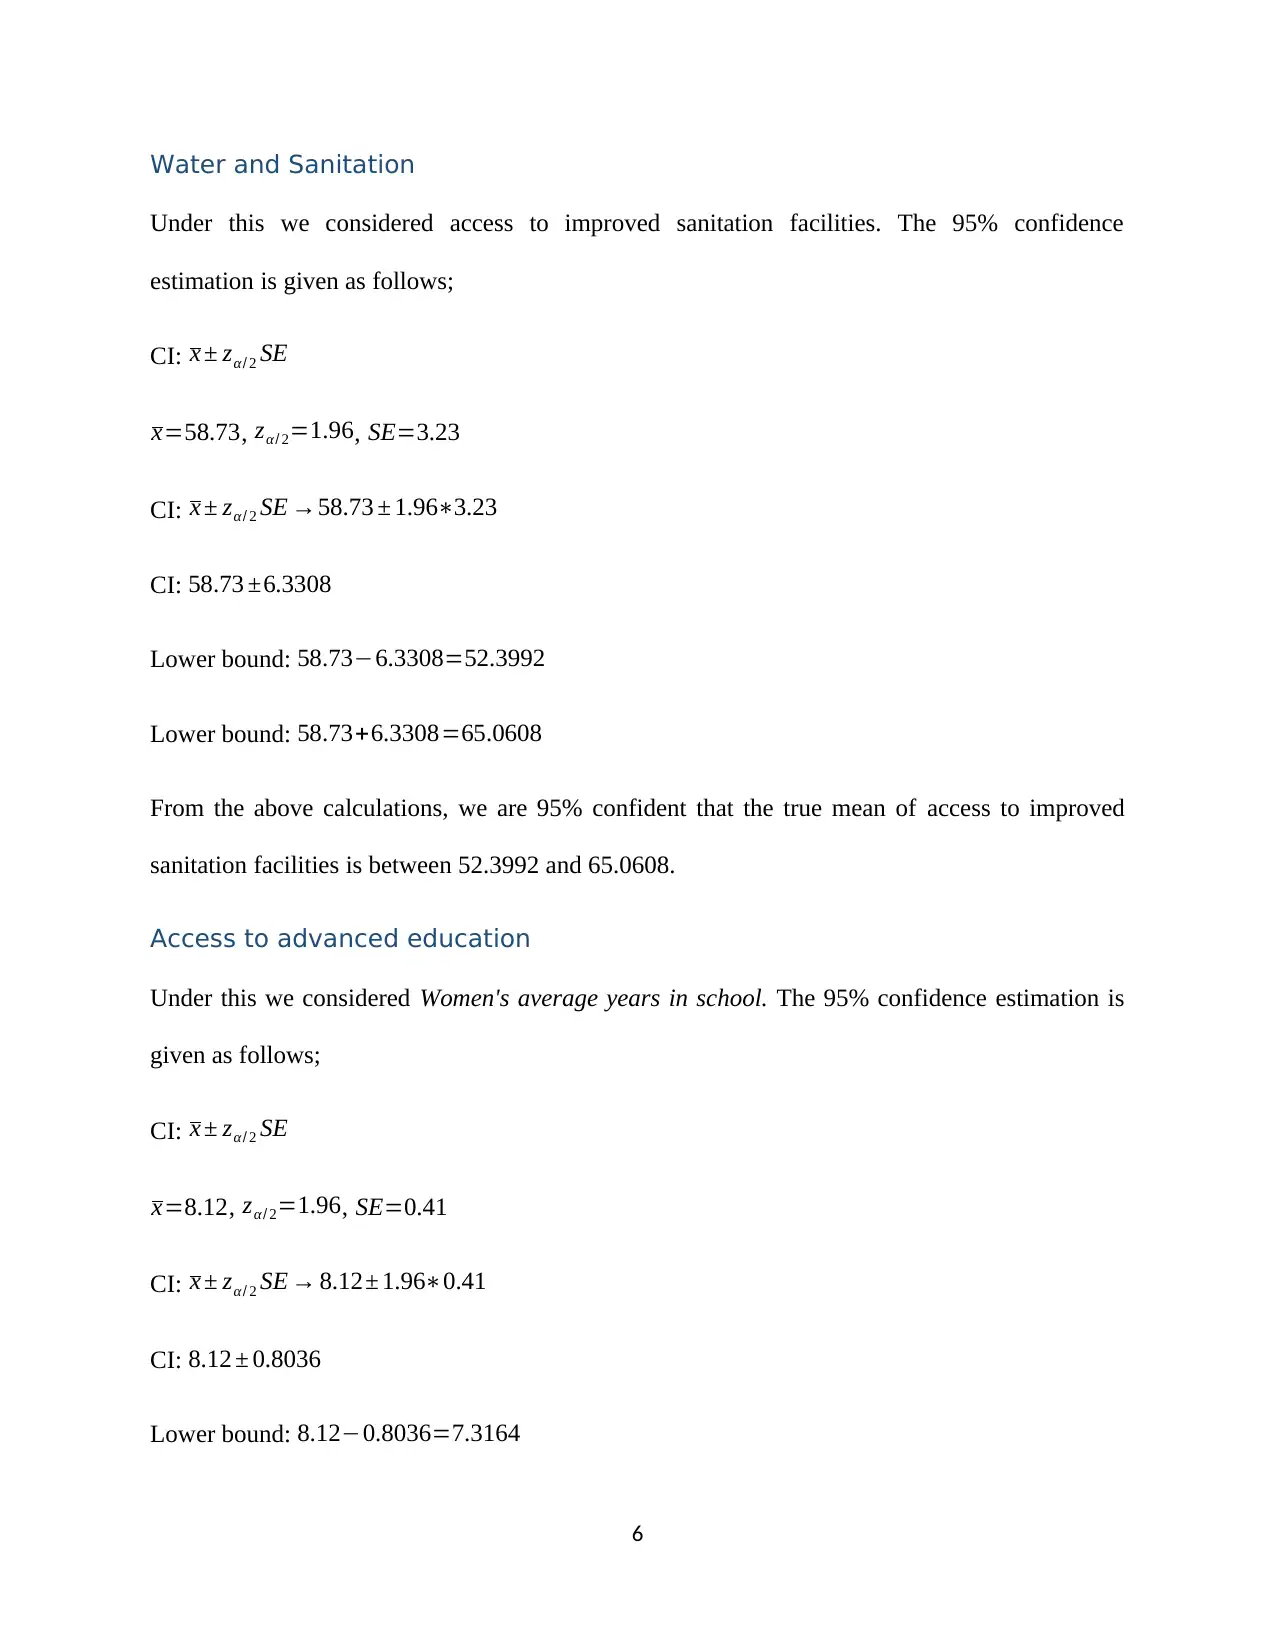
Water and Sanitation
Under this we considered access to improved sanitation facilities. The 95% confidence
estimation is given as follows;
CI: x ± zα / 2 SE
x=58.73, zα / 2=1.96, SE=3.23
CI: x ± zα/ 2 SE →58.73 ± 1.96∗3.23
CI: 58.73 ±6.3308
Lower bound: 58.73−6.3308=52.3992
Lower bound: 58.73+6.3308=65.0608
From the above calculations, we are 95% confident that the true mean of access to improved
sanitation facilities is between 52.3992 and 65.0608.
Access to advanced education
Under this we considered Women's average years in school. The 95% confidence estimation is
given as follows;
CI: x ± zα / 2 SE
x=8.12, zα/ 2=1.96, SE=0.41
CI: x ± zα / 2 SE → 8.12± 1.96∗0.41
CI: 8.12 ± 0.8036
Lower bound: 8.12−0.8036=7.3164
6
⊘ This is a preview!⊘
Do you want full access?
Subscribe today to unlock all pages.
Trusted by 1+ million students worldwide
Lower bound: 8.12+0.8036=8.9236
From the above calculations, we are 95% confident that the true mean of Women's average years
in school is between 7.3164 and 8.9236.
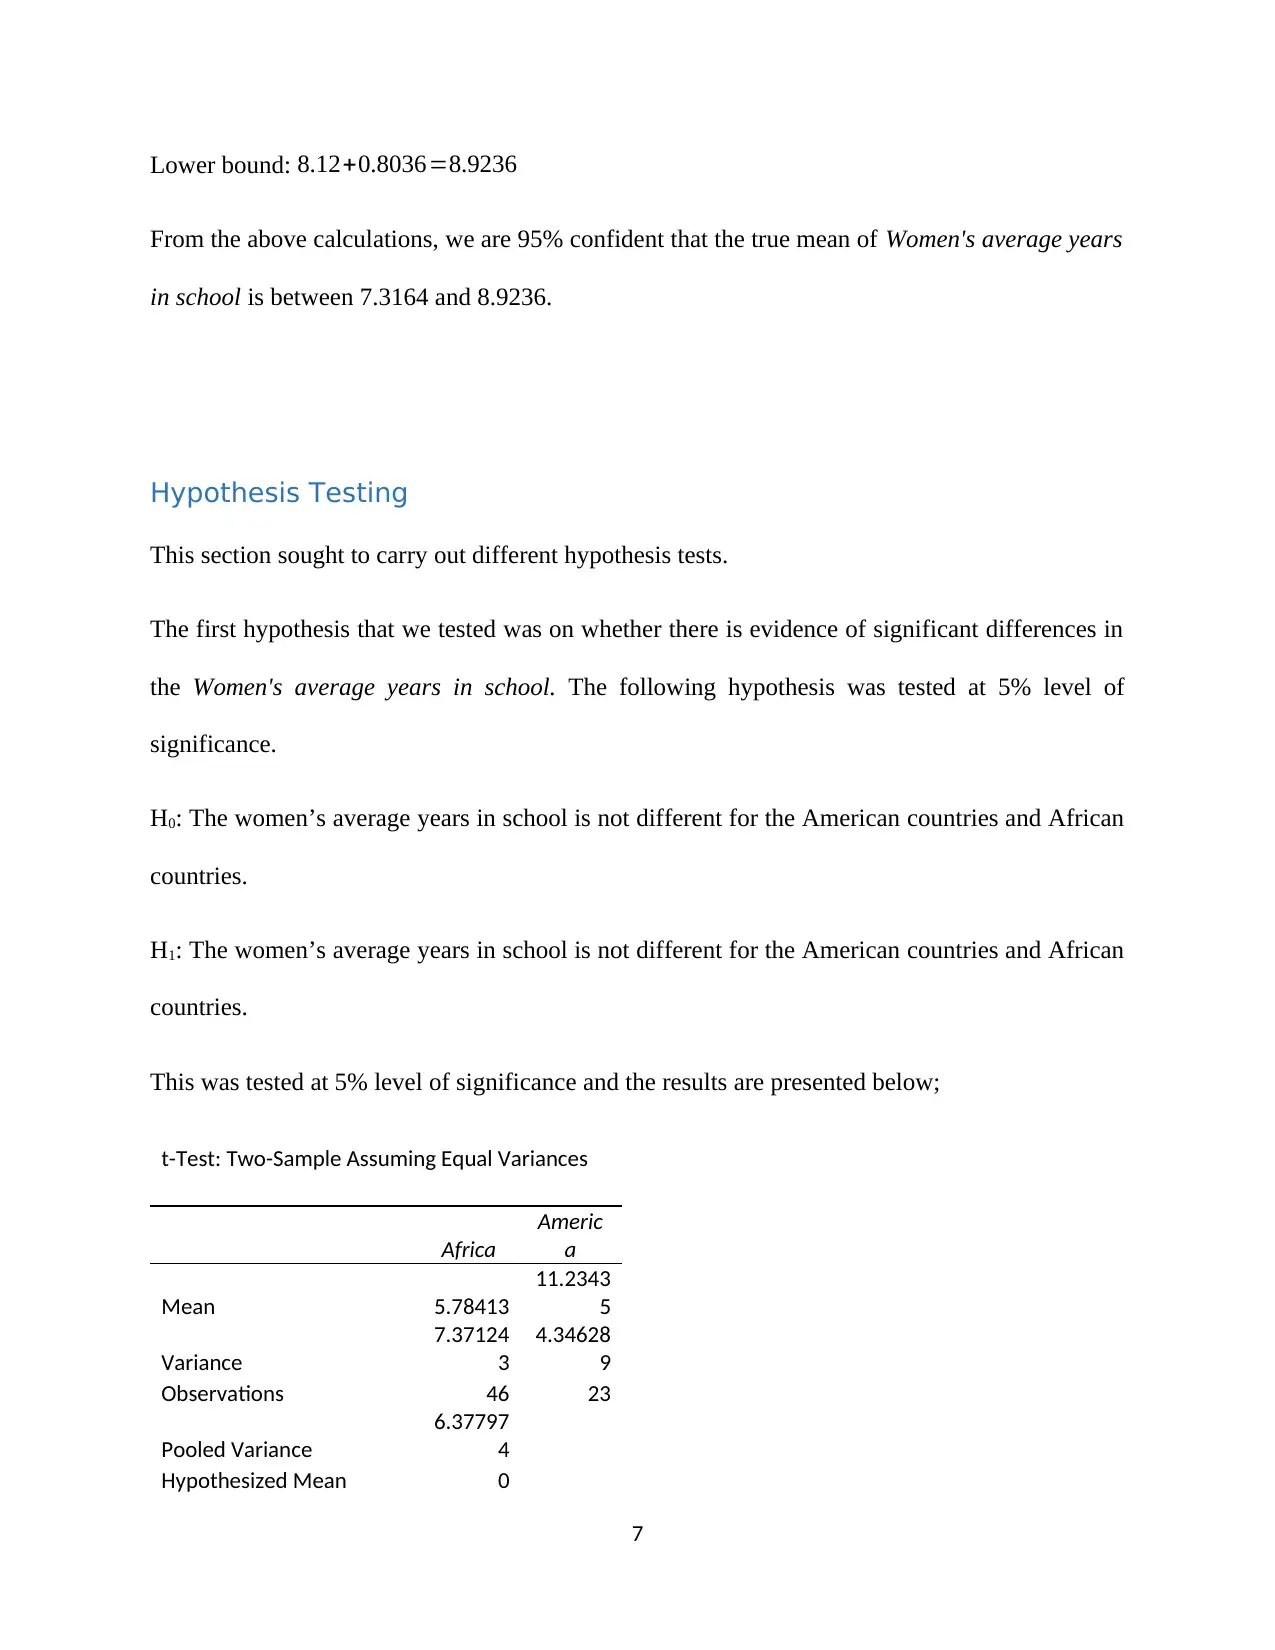
Hypothesis Testing
This section sought to carry out different hypothesis tests.
The first hypothesis that we tested was on whether there is evidence of significant differences in
the Women's average years in school. The following hypothesis was tested at 5% level of
significance.
H0: The women’s average years in school is not different for the American countries and African
countries.
H1: The women’s average years in school is not different for the American countries and African
countries.
This was tested at 5% level of significance and the results are presented below;
t-Test: Two-Sample Assuming Equal Variances
Africa
Americ
a
Mean 5.78413
11.2343
5
Variance
7.37124
3
4.34628
9
Observations 46 23
Pooled Variance
6.37797
4
Hypothesized Mean 0
7
From the above calculations, we are 95% confident that the true mean of Women's average years
in school is between 7.3164 and 8.9236.
Hypothesis Testing
This section sought to carry out different hypothesis tests.
The first hypothesis that we tested was on whether there is evidence of significant differences in
the Women's average years in school. The following hypothesis was tested at 5% level of
significance.
H0: The women’s average years in school is not different for the American countries and African
countries.
H1: The women’s average years in school is not different for the American countries and African
countries.
This was tested at 5% level of significance and the results are presented below;
t-Test: Two-Sample Assuming Equal Variances
Africa
Americ
a
Mean 5.78413
11.2343
5
Variance
7.37124
3
4.34628
9
Observations 46 23
Pooled Variance
6.37797
4
Hypothesized Mean 0
7
Paraphrase This Document
Need a fresh take? Get an instant paraphrase of this document with our AI Paraphraser
Difference
df 67
t Stat
-
8.45066
P(T<=t) one-tail
1.85E-
12
t Critical one-tail
1.66791
6
P(T<=t) two-tail
3.71E-
12
t Critical two-tail
1.99600
8
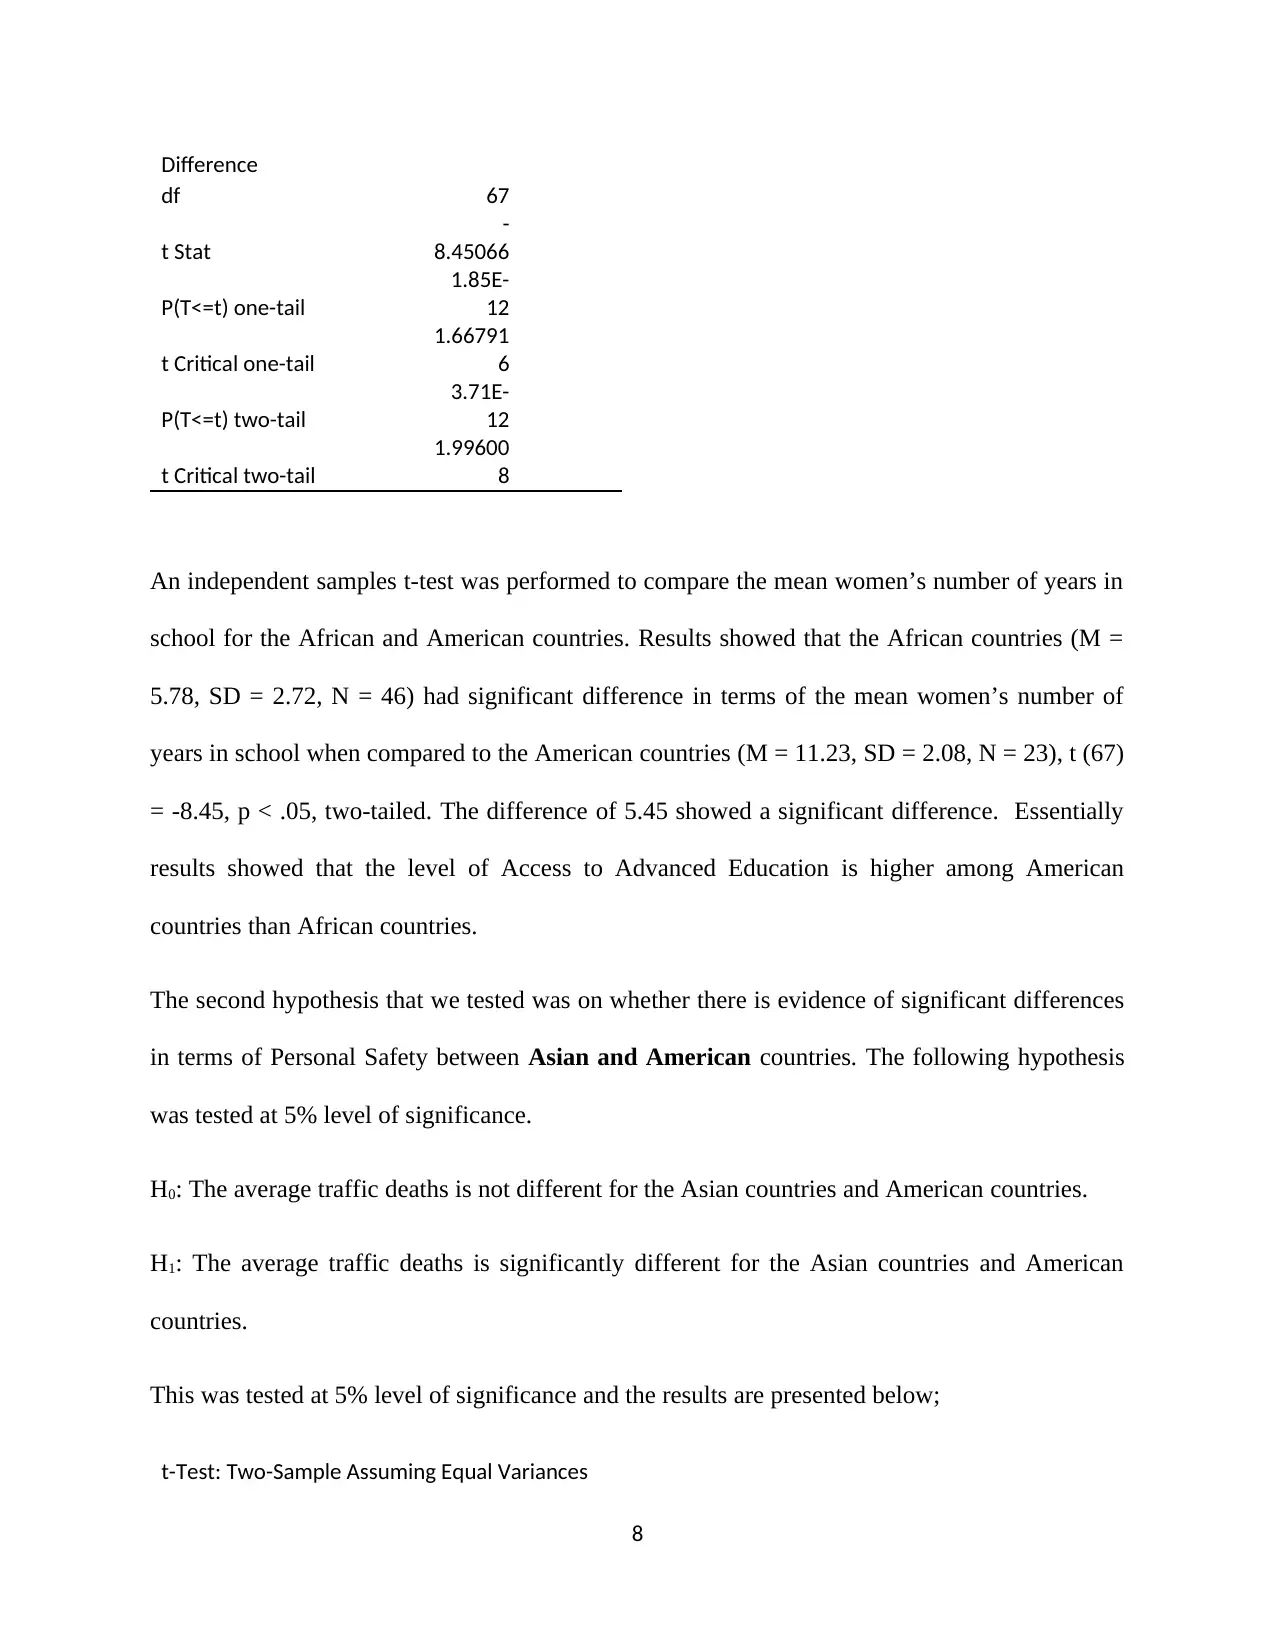
An independent samples t-test was performed to compare the mean women’s number of years in
school for the African and American countries. Results showed that the African countries (M =
5.78, SD = 2.72, N = 46) had significant difference in terms of the mean women’s number of
years in school when compared to the American countries (M = 11.23, SD = 2.08, N = 23), t (67)
= -8.45, p < .05, two-tailed. The difference of 5.45 showed a significant difference. Essentially
results showed that the level of Access to Advanced Education is higher among American
countries than African countries.
The second hypothesis that we tested was on whether there is evidence of significant differences
in terms of Personal Safety between Asian and American countries. The following hypothesis
was tested at 5% level of significance.
H0: The average traffic deaths is not different for the Asian countries and American countries.
H1: The average traffic deaths is significantly different for the Asian countries and American
countries.
This was tested at 5% level of significance and the results are presented below;
t-Test: Two-Sample Assuming Equal Variances
8
df 67
t Stat
-
8.45066
P(T<=t) one-tail
1.85E-
12
t Critical one-tail
1.66791
6
P(T<=t) two-tail
3.71E-
12
t Critical two-tail
1.99600
8
An independent samples t-test was performed to compare the mean women’s number of years in
school for the African and American countries. Results showed that the African countries (M =
5.78, SD = 2.72, N = 46) had significant difference in terms of the mean women’s number of
years in school when compared to the American countries (M = 11.23, SD = 2.08, N = 23), t (67)
= -8.45, p < .05, two-tailed. The difference of 5.45 showed a significant difference. Essentially
results showed that the level of Access to Advanced Education is higher among American
countries than African countries.
The second hypothesis that we tested was on whether there is evidence of significant differences
in terms of Personal Safety between Asian and American countries. The following hypothesis
was tested at 5% level of significance.
H0: The average traffic deaths is not different for the Asian countries and American countries.
H1: The average traffic deaths is significantly different for the Asian countries and American
countries.
This was tested at 5% level of significance and the results are presented below;
t-Test: Two-Sample Assuming Equal Variances
8
America
n Asian
Mean
16.1521
7
15.5947
4
Variance
30.3798
8
49.7305
3
Observations 23 19
Pooled Variance
39.0876
7
Hypothesized Mean
Difference 0
df 40
t Stat
0.28760
2
P(T<=t) one-tail
0.38756
8
t Critical one-tail
1.68385
1
P(T<=t) two-tail
0.77513
6
t Critical two-tail
2.02107
5
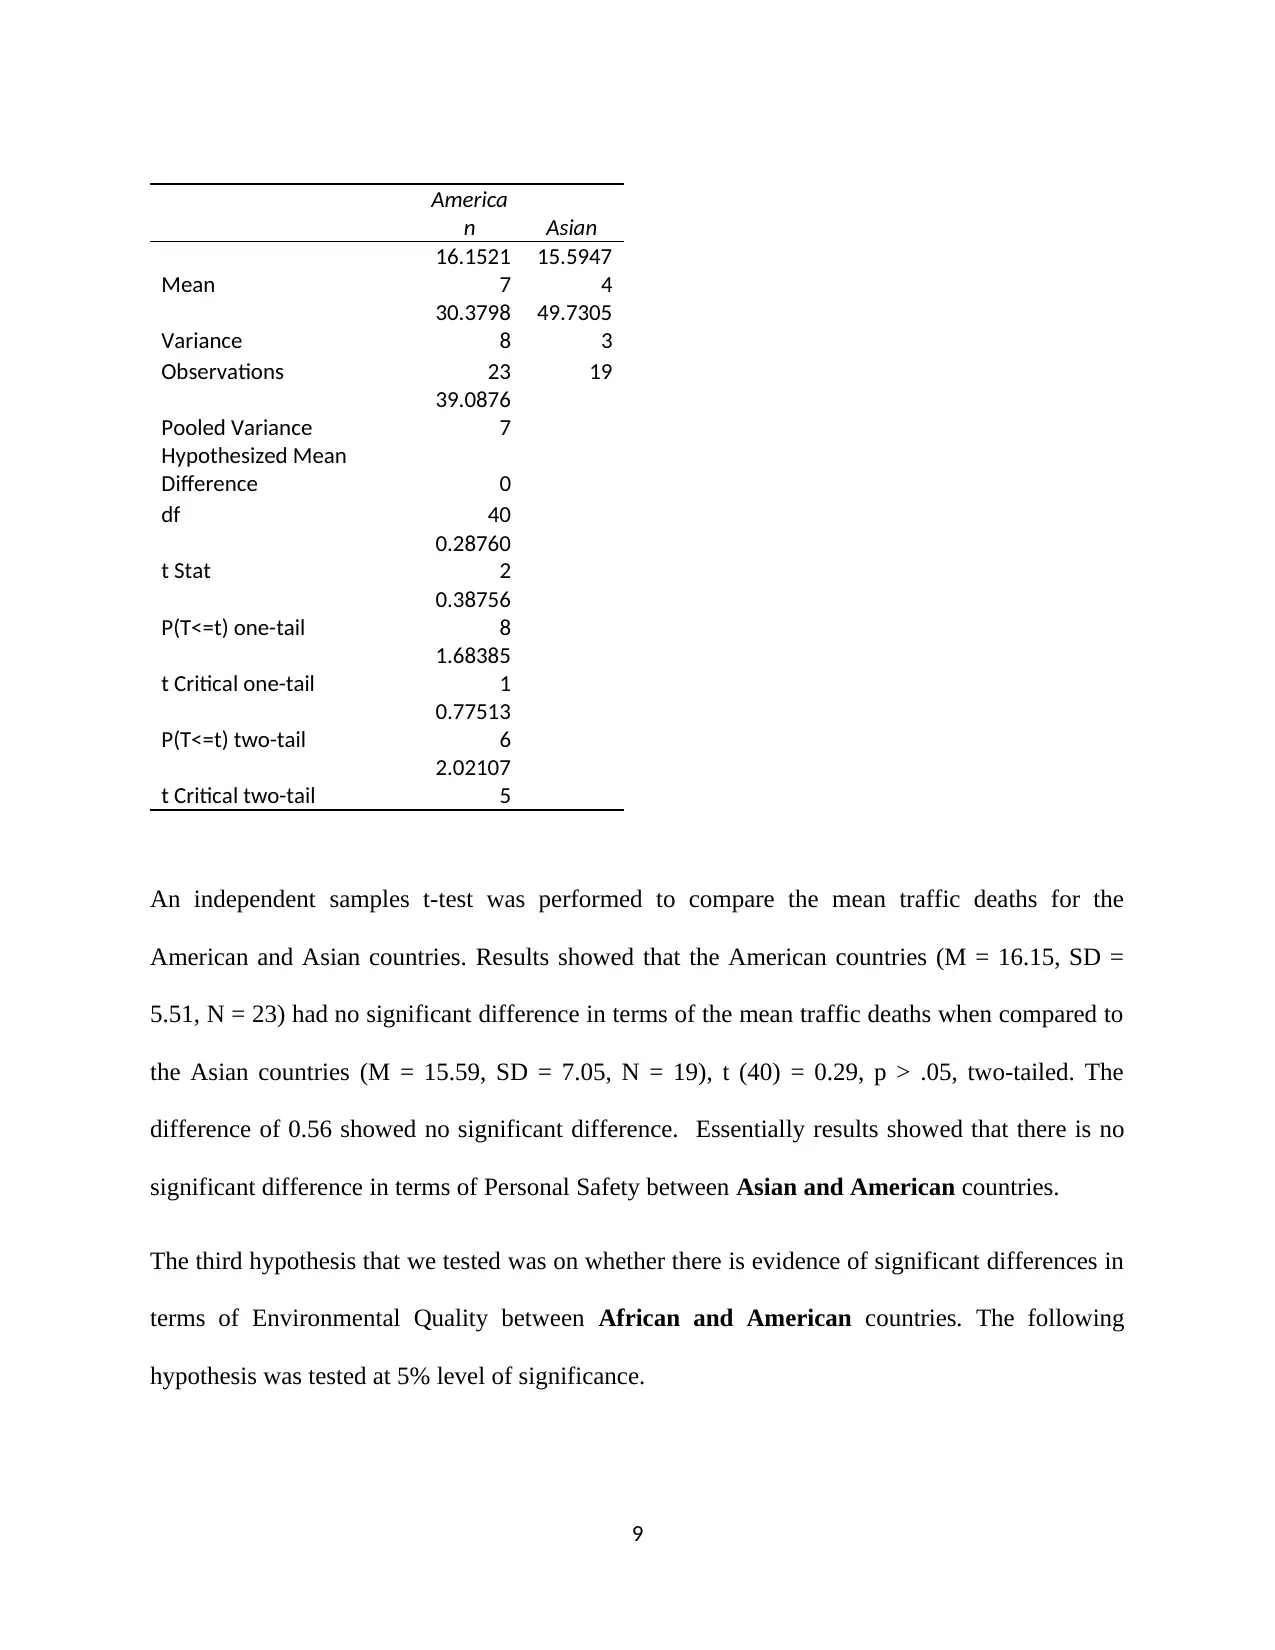
An independent samples t-test was performed to compare the mean traffic deaths for the
American and Asian countries. Results showed that the American countries (M = 16.15, SD =
5.51, N = 23) had no significant difference in terms of the mean traffic deaths when compared to
the Asian countries (M = 15.59, SD = 7.05, N = 19), t (40) = 0.29, p > .05, two-tailed. The
difference of 0.56 showed no significant difference. Essentially results showed that there is no
significant difference in terms of Personal Safety between Asian and American countries.
The third hypothesis that we tested was on whether there is evidence of significant differences in
terms of Environmental Quality between African and American countries. The following
hypothesis was tested at 5% level of significance.
9
n Asian
Mean
16.1521
7
15.5947
4
Variance
30.3798
8
49.7305
3
Observations 23 19
Pooled Variance
39.0876
7
Hypothesized Mean
Difference 0
df 40
t Stat
0.28760
2
P(T<=t) one-tail
0.38756
8
t Critical one-tail
1.68385
1
P(T<=t) two-tail
0.77513
6
t Critical two-tail
2.02107
5
An independent samples t-test was performed to compare the mean traffic deaths for the
American and Asian countries. Results showed that the American countries (M = 16.15, SD =
5.51, N = 23) had no significant difference in terms of the mean traffic deaths when compared to
the Asian countries (M = 15.59, SD = 7.05, N = 19), t (40) = 0.29, p > .05, two-tailed. The
difference of 0.56 showed no significant difference. Essentially results showed that there is no
significant difference in terms of Personal Safety between Asian and American countries.
The third hypothesis that we tested was on whether there is evidence of significant differences in
terms of Environmental Quality between African and American countries. The following
hypothesis was tested at 5% level of significance.
9
⊘ This is a preview!⊘
Do you want full access?
Subscribe today to unlock all pages.
Trusted by 1+ million students worldwide
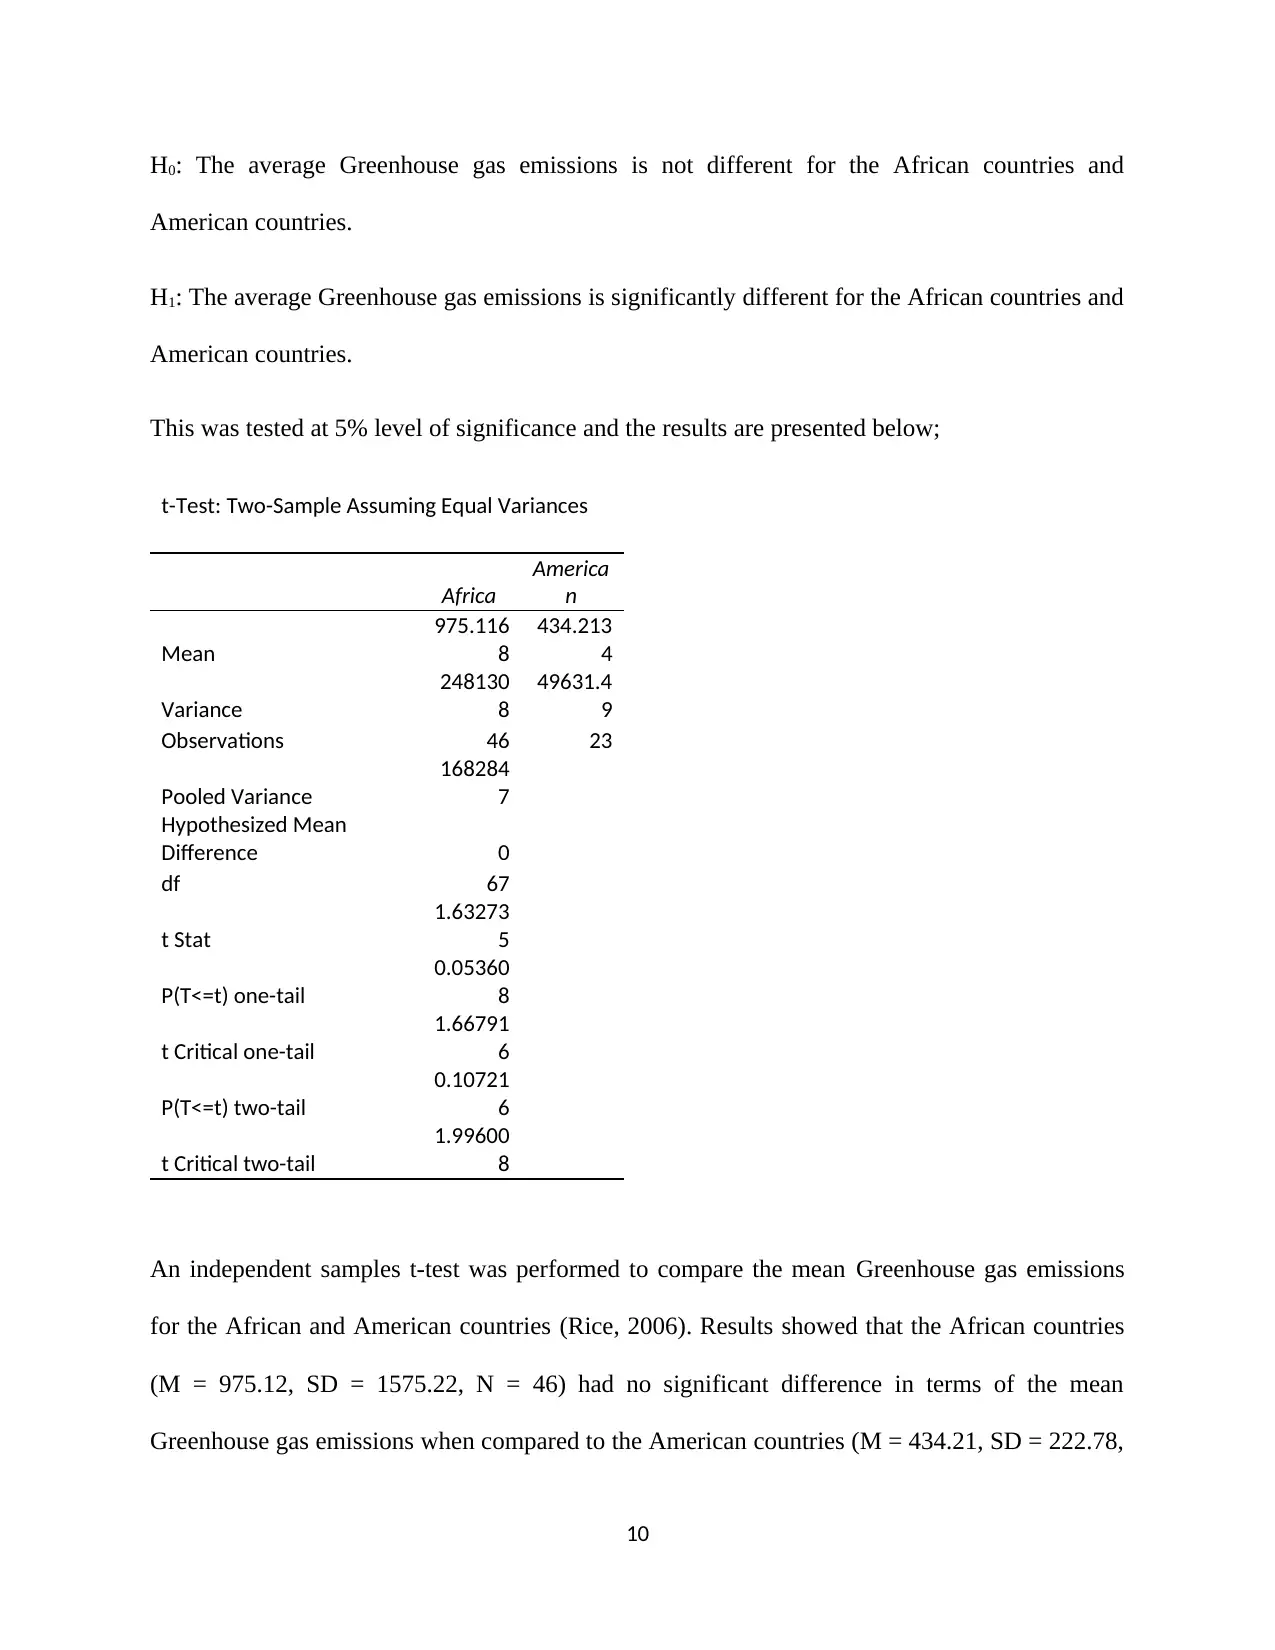
H0: The average Greenhouse gas emissions is not different for the African countries and
American countries.
H1: The average Greenhouse gas emissions is significantly different for the African countries and
American countries.
This was tested at 5% level of significance and the results are presented below;
t-Test: Two-Sample Assuming Equal Variances
Africa
America
n
Mean
975.116
8
434.213
4
Variance
248130
8
49631.4
9
Observations 46 23
Pooled Variance
168284
7
Hypothesized Mean
Difference 0
df 67
t Stat
1.63273
5
P(T<=t) one-tail
0.05360
8
t Critical one-tail
1.66791
6
P(T<=t) two-tail
0.10721
6
t Critical two-tail
1.99600
8
An independent samples t-test was performed to compare the mean Greenhouse gas emissions
for the African and American countries (Rice, 2006). Results showed that the African countries
(M = 975.12, SD = 1575.22, N = 46) had no significant difference in terms of the mean
Greenhouse gas emissions when compared to the American countries (M = 434.21, SD = 222.78,
10
American countries.
H1: The average Greenhouse gas emissions is significantly different for the African countries and
American countries.
This was tested at 5% level of significance and the results are presented below;
t-Test: Two-Sample Assuming Equal Variances
Africa
America
n
Mean
975.116
8
434.213
4
Variance
248130
8
49631.4
9
Observations 46 23
Pooled Variance
168284
7
Hypothesized Mean
Difference 0
df 67
t Stat
1.63273
5
P(T<=t) one-tail
0.05360
8
t Critical one-tail
1.66791
6
P(T<=t) two-tail
0.10721
6
t Critical two-tail
1.99600
8
An independent samples t-test was performed to compare the mean Greenhouse gas emissions
for the African and American countries (Rice, 2006). Results showed that the African countries
(M = 975.12, SD = 1575.22, N = 46) had no significant difference in terms of the mean
Greenhouse gas emissions when compared to the American countries (M = 434.21, SD = 222.78,
10
Paraphrase This Document
Need a fresh take? Get an instant paraphrase of this document with our AI Paraphraser
N = 23), t (67) = 1.63, p > .05, two-tailed. The difference of 540.91 showed an insignificant
difference. Essentially results showed that the Greenhouse gas emissions is not significantly
different for the American and African countries.
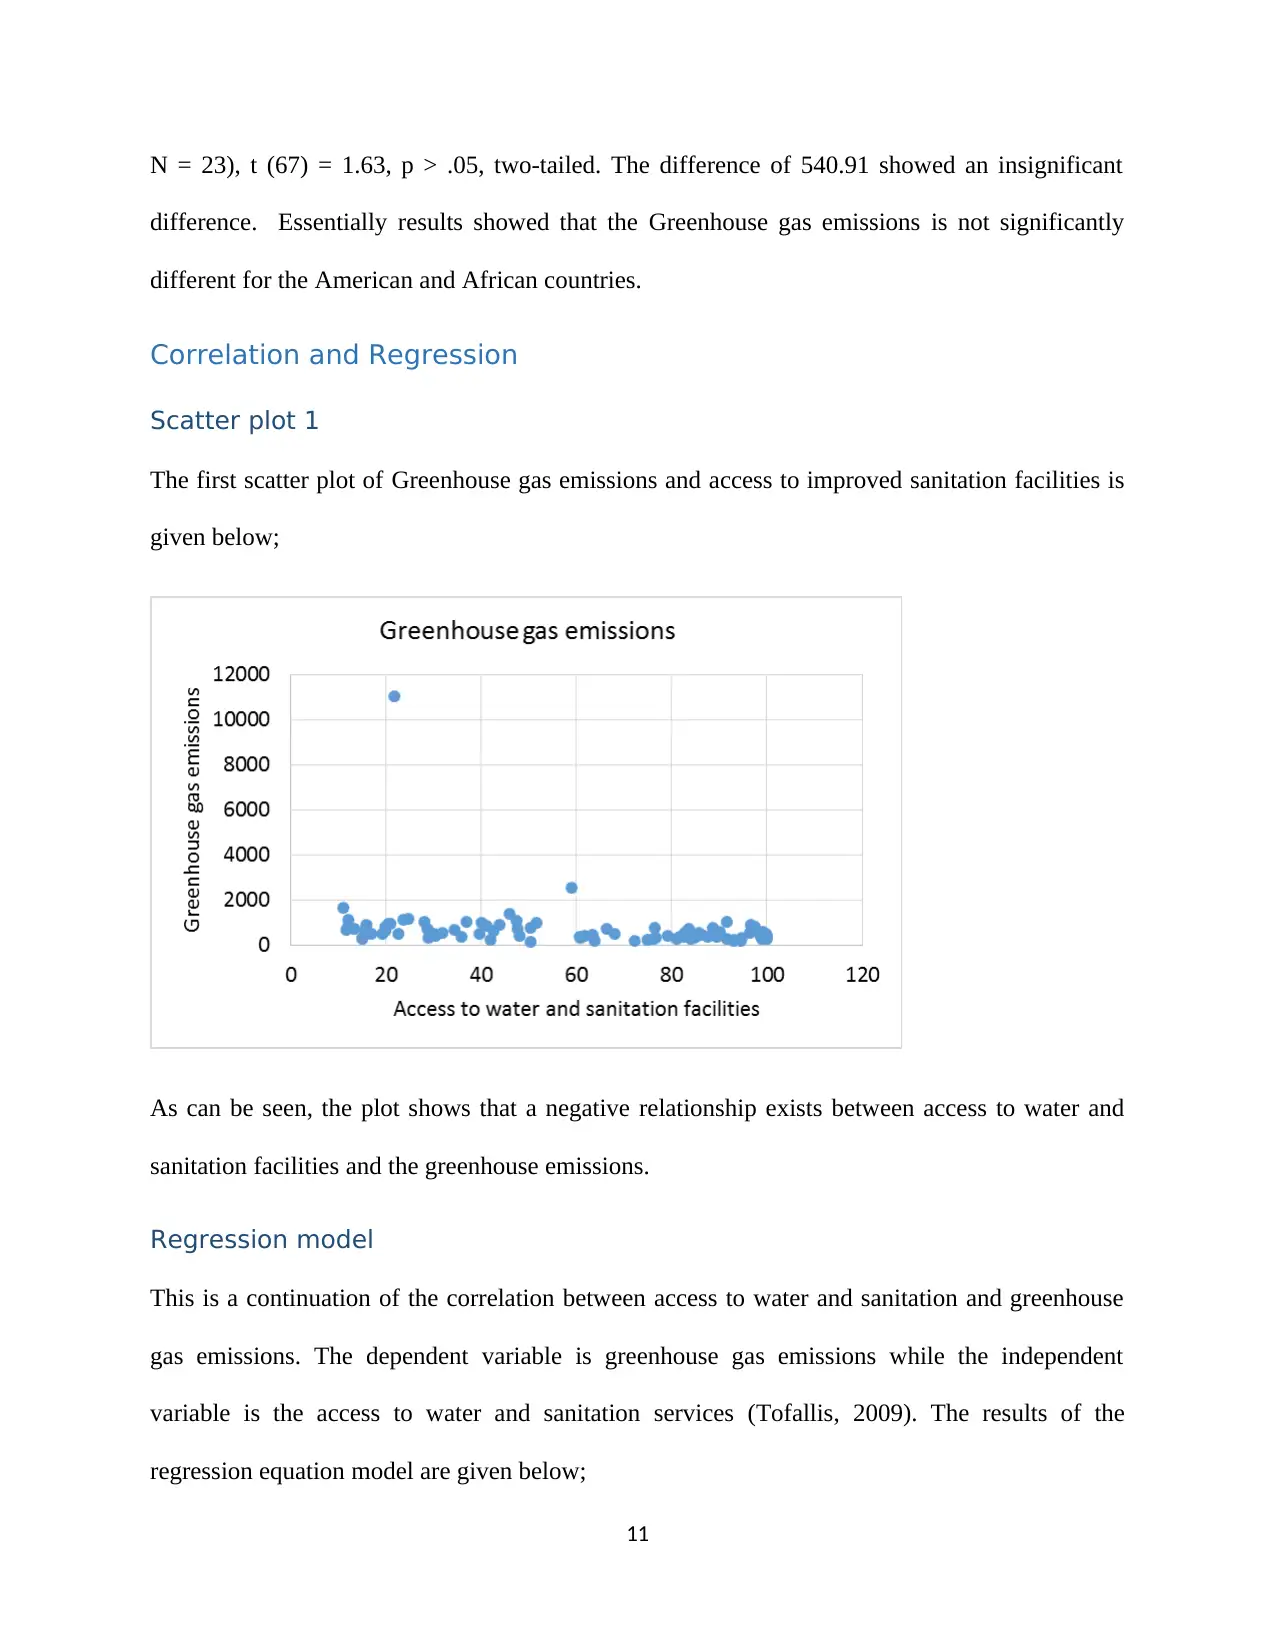
Correlation and Regression
Scatter plot 1
The first scatter plot of Greenhouse gas emissions and access to improved sanitation facilities is
given below;
As can be seen, the plot shows that a negative relationship exists between access to water and
sanitation facilities and the greenhouse emissions.
Regression model
This is a continuation of the correlation between access to water and sanitation and greenhouse
gas emissions. The dependent variable is greenhouse gas emissions while the independent
variable is the access to water and sanitation services (Tofallis, 2009). The results of the
regression equation model are given below;
11
difference. Essentially results showed that the Greenhouse gas emissions is not significantly
different for the American and African countries.
Correlation and Regression
Scatter plot 1
The first scatter plot of Greenhouse gas emissions and access to improved sanitation facilities is
given below;
As can be seen, the plot shows that a negative relationship exists between access to water and
sanitation facilities and the greenhouse emissions.
Regression model
This is a continuation of the correlation between access to water and sanitation and greenhouse
gas emissions. The dependent variable is greenhouse gas emissions while the independent
variable is the access to water and sanitation services (Tofallis, 2009). The results of the
regression equation model are given below;
11
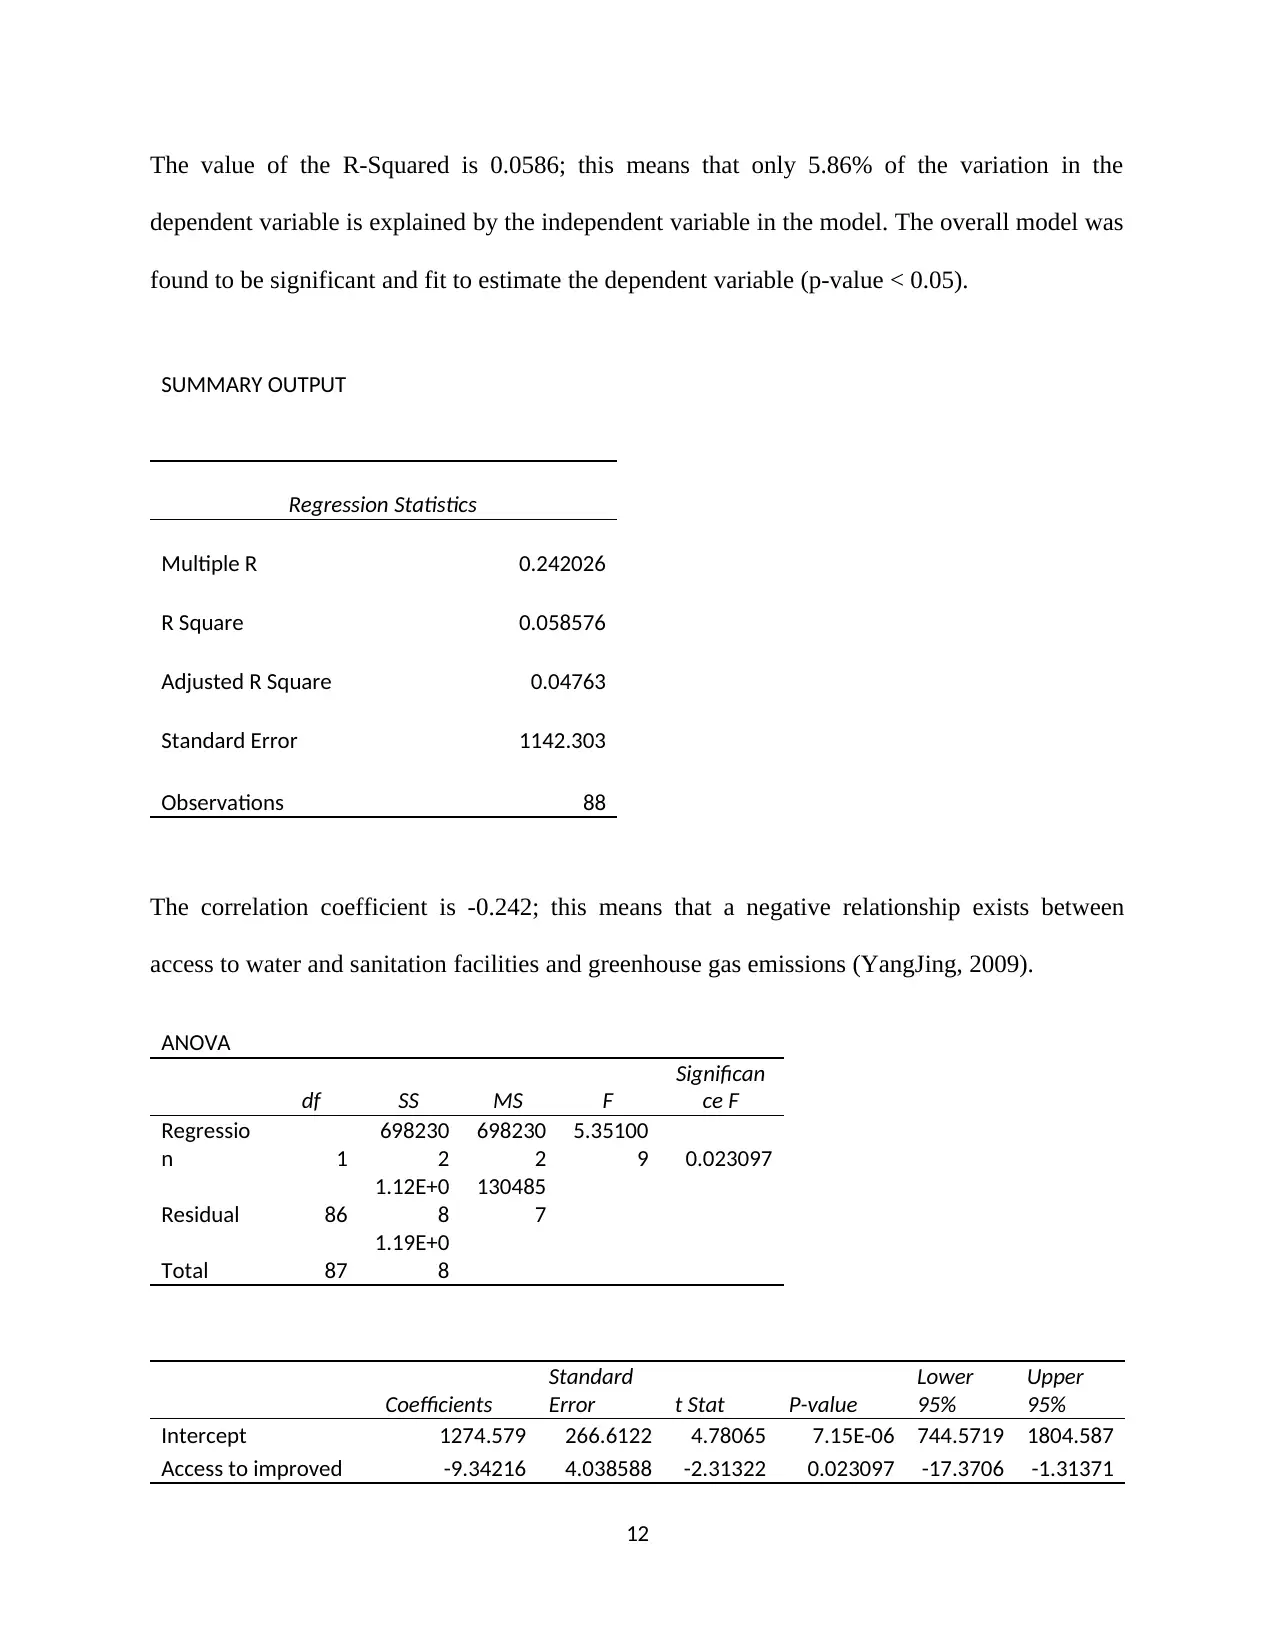
The value of the R-Squared is 0.0586; this means that only 5.86% of the variation in the
dependent variable is explained by the independent variable in the model. The overall model was
found to be significant and fit to estimate the dependent variable (p-value < 0.05).
SUMMARY OUTPUT
Regression Statistics
Multiple R 0.242026
R Square 0.058576
Adjusted R Square 0.04763
Standard Error 1142.303
Observations 88
The correlation coefficient is -0.242; this means that a negative relationship exists between
access to water and sanitation facilities and greenhouse gas emissions (YangJing, 2009).
ANOVA
df SS MS F
Significan
ce F
Regressio
n 1
698230
2
698230
2
5.35100
9 0.023097
Residual 86
1.12E+0
8
130485
7
Total 87
1.19E+0
8
Coefficients
Standard
Error t Stat P-value
Lower
95%
Upper
95%
Intercept 1274.579 266.6122 4.78065 7.15E-06 744.5719 1804.587
Access to improved -9.34216 4.038588 -2.31322 0.023097 -17.3706 -1.31371
12
⊘ This is a preview!⊘
Do you want full access?
Subscribe today to unlock all pages.
Trusted by 1+ million students worldwide
1 out of 24


Your All-in-One AI-Powered Toolkit for Academic Success.
+13062052269
info@desklib.com
Available 24*7 on WhatsApp / Email
![[object Object]](/_next/static/media/star-bottom.7253800d.svg)
Unlock your academic potential
Copyright © 2020–2026 A2Z Services. All Rights Reserved. Developed and managed by ZUCOL.