Business Decision Making Report: Morrison's, London Retail
VerifiedAdded on 2019/12/03
|21
|4373
|525
Report
AI Summary
This report provides a comprehensive analysis of business decision-making within the retail industry, focusing on WM Morrison's. The report begins by outlining plans for primary and secondary data collection, detailing survey methodologies, sampling frames, and the design of a consumer behavior questionnaire. It then delves into statistical tools, calculating and interpreting mean, median, mode, and measures of dispersion to draw conclusions about Morrison's performance. Further, the report examines the application of quartiles, percentiles, and correlation coefficients in a business context. Sales graphs and trend lines of Morrison's and its competitors are presented, culminating in a formal business report. Finally, the report explores the uses of information processing tools and project management techniques, including project plans with critical paths and project evaluation methods, offering a complete overview of the subject.

BUSINESS DECISION
MAKING
MAKING
Paraphrase This Document
Need a fresh take? Get an instant paraphrase of this document with our AI Paraphraser
Table of Contents
Introduction......................................................................................................................................1
TASK 1............................................................................................................................................1
1.1 Plan for collection of primary and secondary data................................................................1
1.2 Survey methodology and sampling frame for research.........................................................2
1.3 Questionnaire on people attitude and consumer behaviour towards discounting retailing in
London .......................................................................................................................................2
TASK 2............................................................................................................................................4
2.1 Calculation of mean, median and mode................................................................................4
Table 1: Calculation of Mean, median and mode..........................................................4
2.2 Conclusions for WM Morrison’s on the basis of mean, median and mode..........................6
2.3 Measures of dispersion..........................................................................................................6
2.4 Use of quartile, percentile and correlation coefficient in business context...........................8
TASK 3............................................................................................................................................9
3.1 Sales graph of Morion's and its competitors.........................................................................9
3.2 Trend line of Morrison’s and its competitors sells..............................................................11
3.4 Formal business report on Morrison’s................................................................................12
TASK 4..........................................................................................................................................12
4.1 Uses of information processing tools..................................................................................12
4.2 Project plan with critical path.............................................................................................13
4.3 Project evaluation techniques..............................................................................................13
Introduction
Morrison is a giant organization that operates in the retail industry. Basically, it sells
grocery items but due to price competition it earns a very low margin in its business. This main
aim of preparing this report is to help reader in understanding research techniques and statistical
tools that are used for this purpose. This report creates a broad understanding about sources of
data and various sampling techniques that are used for conducting a research. Further, this report
provides a detail description about the uses of statistical tools like Mean, median, mode, quartile
and percentile. Finally in this report detailed information is given about application of project
elevation techniques and PERT as well as CPM.
TASK 1
1.1 Plan for collection of primary and secondary data
There are two sources of data collection namely primary and secondary data. Firms use
both source of data but according to their requirements. Further, these sources are explained in
detail.
1. Primary data- It is a data that is new in nature and is not published in books, journals and
newspapers. However firms get already prepared data from various sources but it is better
to collect primary data because business conditions are changing rapidly. On the basis of
secondary data firms can get an overview of only old sceneries. So due to difference in
past and present business situation management cannot takes its business decisions on the
basis of past data (Chen and Ward, 2000). In order to identify changes in consumer
behaviour and attitude of people primary data is collected. For this purpose
questionnaires are distributed among forty people. These questionnaires contain close
ended questions in order to ensure that accurate data is collected from the respondents.
2. Secondary data- Secondary data is a data that is already prepared and published by
someone in newspapers, journals and books. Before collecting primary data it is better to
collect secondary data because latter source of data give adequate information about past
scenario. On the basis of past data and current scenarios firm can prepare perfect
questionnaire for research purpose (Day, 2005).
Data will be collected from different borough of London and sample units will be selected from
different areas of same city. First of all secondary data will be collected and after data primary
1
⊘ This is a preview!⊘
Do you want full access?
Subscribe today to unlock all pages.
Trusted by 1+ million students worldwide
data collection will be commenced. In this way entire research will be conducted in proper
manner.
1.2 Survey methodology and sampling frame for research
In order to create a deep understanding about consumer behaviour and attitude of people
survey will be conducted. In survey sample of forty people is taken. In survey questionnaire will
be distributed among these respondents. In order to avoid errors in data collection person who
will collect entire data will give proper guidance to the respondents. This will helps in prevent
respondents from filling wrong answers in their questionnaires. For selecting appropriate sample
there are lot of sampling techniques like simple random sampling and stratified random sampling
etc (Black, 2006). Researchers select any particular technique according to their data collection
requirements. For example firms wants to know about changing eating habits of the people then
it will use stratified sampling technique because eating habits are affected by people income
level, education level, social factors etc. so by collecting data from particular group researcher
can not arrive at right conclusion. By using this method of sampling, researcher will divide entire
population in several parts and then collects data from these sub groups (Cohen and et. al. 2013.
Morrison’s can use this technique for research purpose in order to identify consumer behaviour
and attitude of the people that belong to different social and economic class.
1.3 Questionnaire on people attitude and consumer behaviour towards discounting retailing in
London
The questionnaire for survey is as follows.
Name
Age
Gender
Profession
Marital status
Are you an employed person?
◦ Yes ( )
◦ No ( )
Do you purchase food products from WM Morrison’s?
◦ Yes ( )
◦ No ( )
2
Paraphrase This Document
Need a fresh take? Get an instant paraphrase of this document with our AI Paraphraser
Why do you prefer to purchase products from Morrison’s store?
◦ Discount ( )
◦ Better quality ( )
◦ Located near your home ( )
◦ Value for money ( )
How often you visit Morrison’s store?
◦ Daily ( )
◦ Weekly ( )
◦ Monthly ( )
◦ According to requirements ( )
How much shopping you do on purchase of edible items?
◦ Less than 20 ( )
◦ 20-70 ( )
◦ 70- 100 ( )
◦ More then 100 ( )
Please rate the service level of Morrison’s stores?
◦ Strongly satisfied ( )
◦ Satisfied ( )
◦ Somewhat satisfied ( )
◦ Dissatisfied ( )
◦ Highly dissatisfied ( )
Do you visit stores other than Morrison’s for buying food discount items?
◦ Yes ( )
◦ No ( )
Which store other than WM Morrison’s you visit to buy grocery items?
◦ LIDL Ltd ( )
◦ JS Sainsburry ( )
◦ ALDI ( )
Whose service do you find the best in terms of discounting food retail stores?
◦ JS Sainsburry ( )
◦ ALDI ( )
3
◦ WM Morrison’s ( )
◦ LIDL ( )
Please rate that satisfaction level of providing information by WM Morrison?
◦ Strongly satisfied ( )
◦ Satisfied ( )
◦ Somewhat satisfied ( )
◦ Dissatisfied ( )
◦ Highly dissatisfied ( )
Do you want to give any valuable suggestion for improving services at WM Morrison?
◦ Yes ( )
◦ No ( )
TASK 2
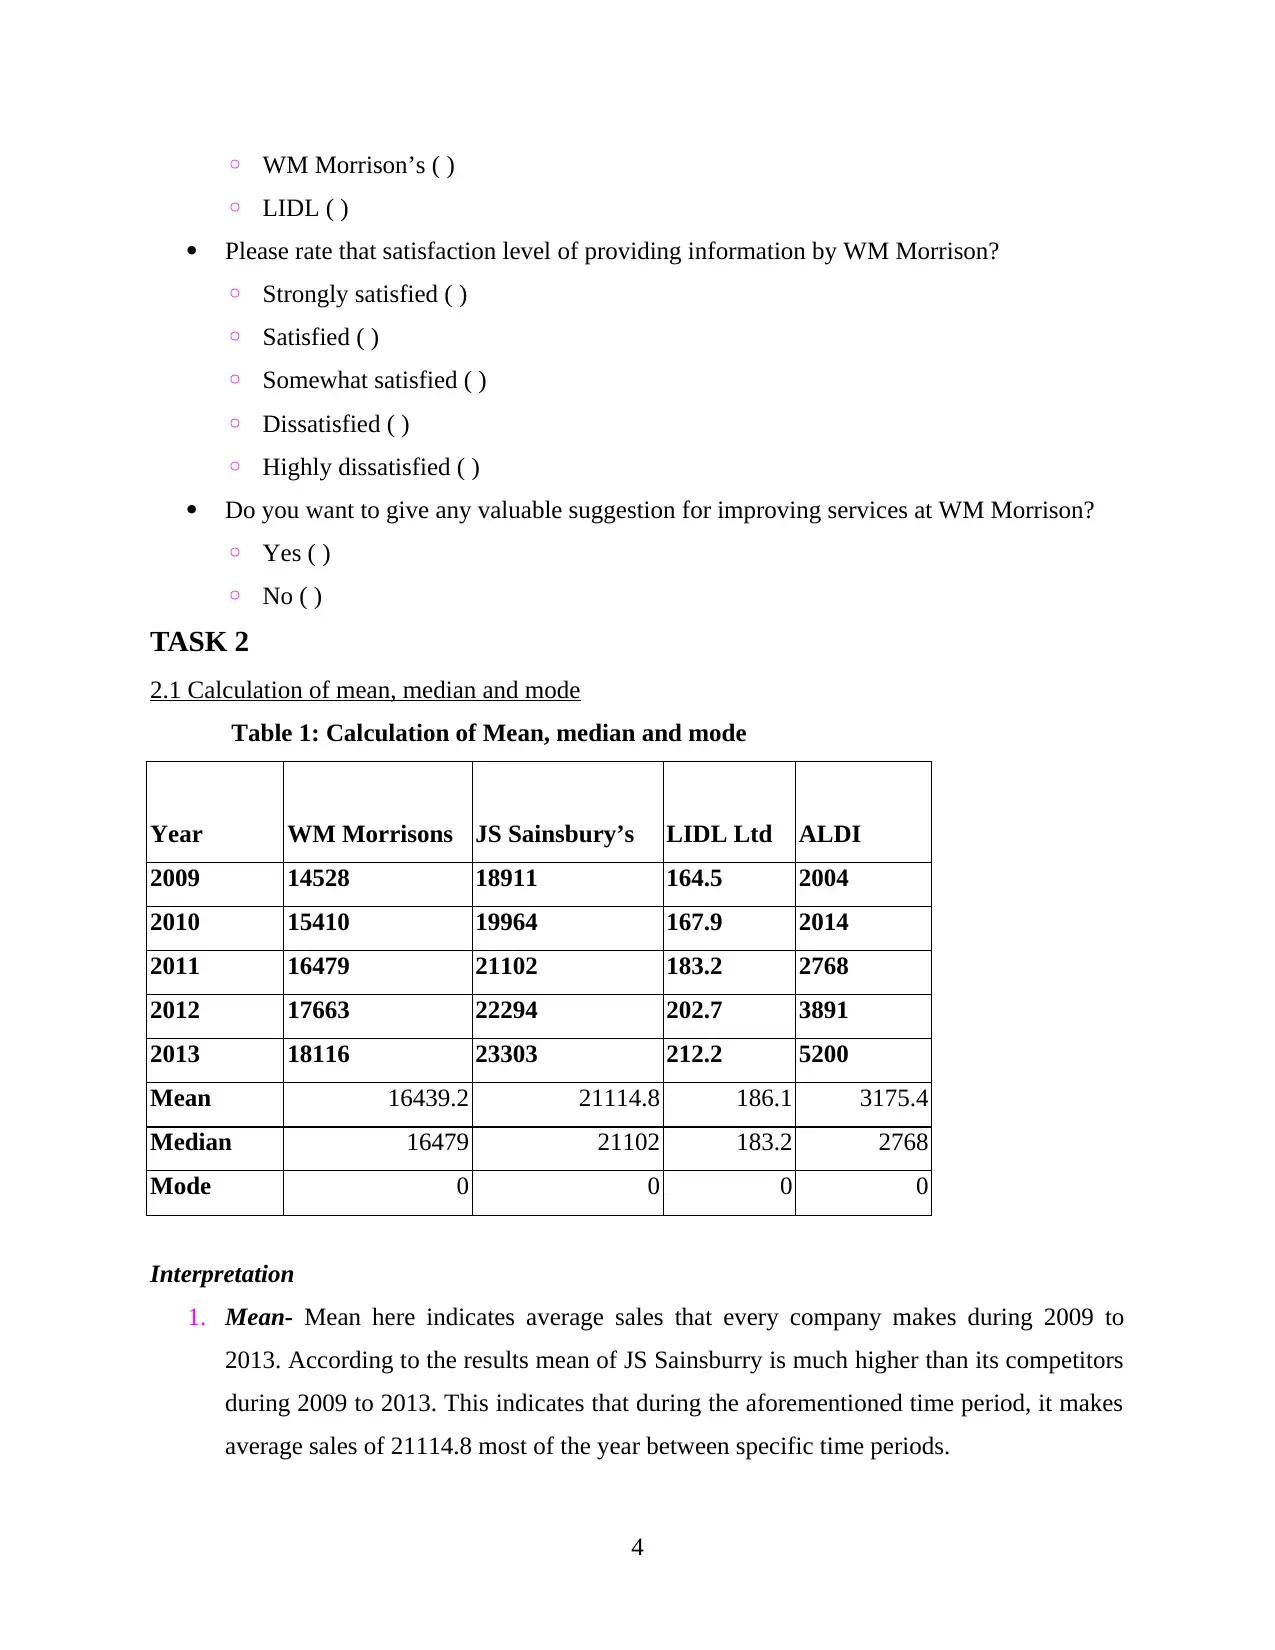
2.1 Calculation of mean, median and mode
Table 1: Calculation of Mean, median and mode
Year WM Morrisons JS Sainsbury’s LIDL Ltd ALDI
2009 14528 18911 164.5 2004
2010 15410 19964 167.9 2014
2011 16479 21102 183.2 2768
2012 17663 22294 202.7 3891
2013 18116 23303 212.2 5200
Mean 16439.2 21114.8 186.1 3175.4
Median 16479 21102 183.2 2768
Mode 0 0 0 0
Interpretation
1. Mean- Mean here indicates average sales that every company makes during 2009 to
2013. According to the results mean of JS Sainsburry is much higher than its competitors
during 2009 to 2013. This indicates that during the aforementioned time period, it makes
average sales of 21114.8 most of the year between specific time periods.
4
◦ LIDL ( )
Please rate that satisfaction level of providing information by WM Morrison?
◦ Strongly satisfied ( )
◦ Satisfied ( )
◦ Somewhat satisfied ( )
◦ Dissatisfied ( )
◦ Highly dissatisfied ( )
Do you want to give any valuable suggestion for improving services at WM Morrison?
◦ Yes ( )
◦ No ( )
TASK 2
2.1 Calculation of mean, median and mode
Table 1: Calculation of Mean, median and mode
Year WM Morrisons JS Sainsbury’s LIDL Ltd ALDI
2009 14528 18911 164.5 2004
2010 15410 19964 167.9 2014
2011 16479 21102 183.2 2768
2012 17663 22294 202.7 3891
2013 18116 23303 212.2 5200
Mean 16439.2 21114.8 186.1 3175.4
Median 16479 21102 183.2 2768
Mode 0 0 0 0
Interpretation
1. Mean- Mean here indicates average sales that every company makes during 2009 to
2013. According to the results mean of JS Sainsburry is much higher than its competitors
during 2009 to 2013. This indicates that during the aforementioned time period, it makes
average sales of 21114.8 most of the year between specific time periods.
4
⊘ This is a preview!⊘
Do you want full access?
Subscribe today to unlock all pages.
Trusted by 1+ million students worldwide
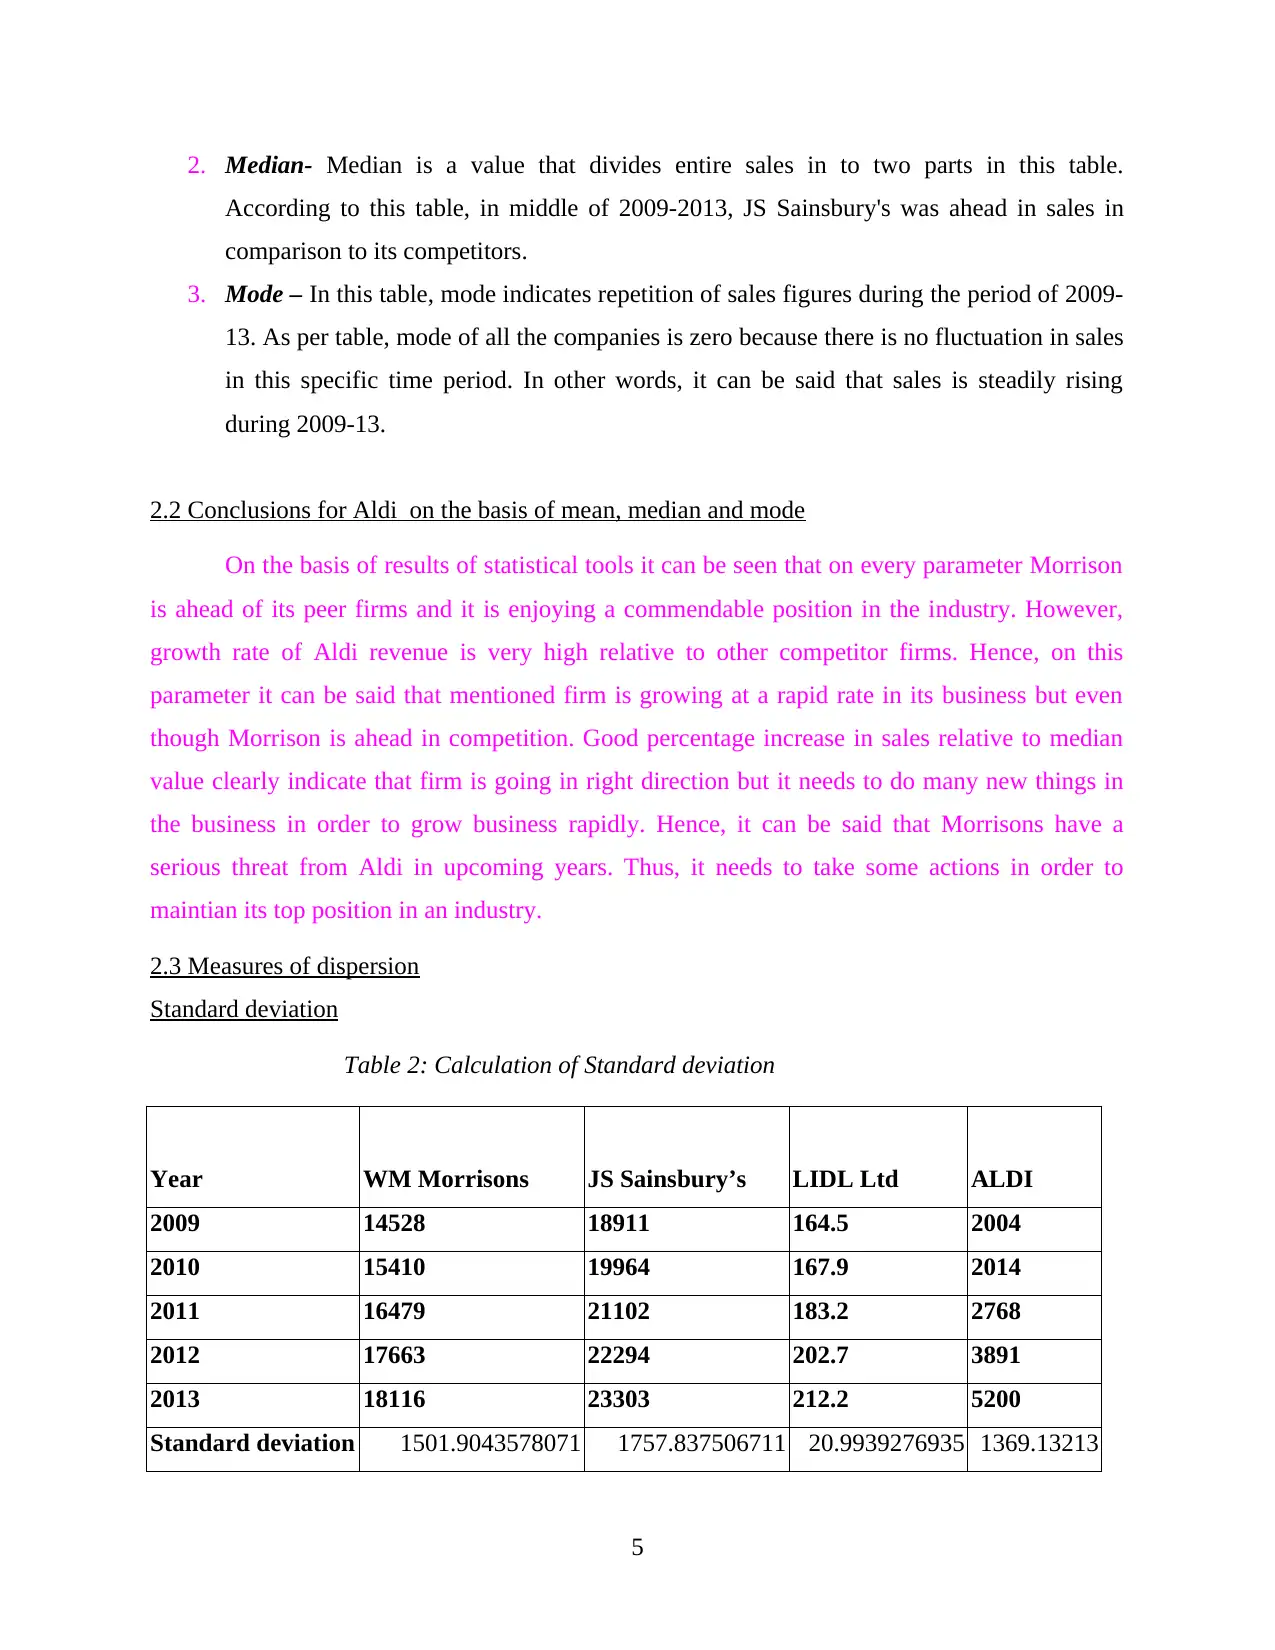
2. Median- Median is a value that divides entire sales in to two parts in this table.
According to this table, in middle of 2009-2013, JS Sainsbury's was ahead in sales in
comparison to its competitors.
3. Mode – In this table, mode indicates repetition of sales figures during the period of 2009-
13. As per table, mode of all the companies is zero because there is no fluctuation in sales
in this specific time period. In other words, it can be said that sales is steadily rising
during 2009-13.
2.2 Conclusions for Aldi on the basis of mean, median and mode
On the basis of results of statistical tools it can be seen that on every parameter Morrison
is ahead of its peer firms and it is enjoying a commendable position in the industry. However,
growth rate of Aldi revenue is very high relative to other competitor firms. Hence, on this
parameter it can be said that mentioned firm is growing at a rapid rate in its business but even
though Morrison is ahead in competition. Good percentage increase in sales relative to median
value clearly indicate that firm is going in right direction but it needs to do many new things in
the business in order to grow business rapidly. Hence, it can be said that Morrisons have a
serious threat from Aldi in upcoming years. Thus, it needs to take some actions in order to
maintian its top position in an industry.
2.3 Measures of dispersion
Standard deviation
Table 2: Calculation of Standard deviation
Year WM Morrisons JS Sainsbury’s LIDL Ltd ALDI
2009 14528 18911 164.5 2004
2010 15410 19964 167.9 2014
2011 16479 21102 183.2 2768
2012 17663 22294 202.7 3891
2013 18116 23303 212.2 5200
Standard deviation 1501.9043578071 1757.837506711 20.9939276935 1369.13213
5
Paraphrase This Document
Need a fresh take? Get an instant paraphrase of this document with our AI Paraphraser
38717
Interpretation
Standard deviation simply indicates changes in the value of a particular variable in
comparison to the average value of the same variable. This data is based on sales and the
standard deviation of JS Sainsbury is higher than its competitors specially Morrison. Morrison is
at second position in terms of standard deviation and this means that in comparison to average
sales current sale of mentioned firm is growing at slow rate relative to Sainsbury.
Table 3: Calculation of variance and range
Year WM Morrisons JS Sainsbury’s LIDL Ltd ALDI
2009 14528 18911 164.5 2004
2010 15410 19964 167.9 2014
2011 16479 21102 183.2 2768
2012 17663 22294 202.7 3891
2013 18116 23303 212.2 5200
Range 3588 4392 47.7 3196
Variance 2255716.7 3089992.7 440.745 1874522.8
Interpretation
Range is a statistical tool that reflects the difference between higher and lower value. The
value of range is higher in case of WM Morrison’s and Aldi stands at second position. This
means that during the time period which is 2009-2013 it is a firm whose revenue increased at a
rapid rate. On the other hand, other statistical tool which is also known as variance is applied on
revenue of the firms. Variance indicate the movement in values of the specific variable relative
to mean value. Here variance of Aldi is low and it means that relative to mean value revenue
increased at a slow rate in case of the mentioned firm relative to other firms.
2.4 Use of quartile, percentile and correlation coefficient in business context
Quartile
6
Interpretation
Standard deviation simply indicates changes in the value of a particular variable in
comparison to the average value of the same variable. This data is based on sales and the
standard deviation of JS Sainsbury is higher than its competitors specially Morrison. Morrison is
at second position in terms of standard deviation and this means that in comparison to average
sales current sale of mentioned firm is growing at slow rate relative to Sainsbury.
Table 3: Calculation of variance and range
Year WM Morrisons JS Sainsbury’s LIDL Ltd ALDI
2009 14528 18911 164.5 2004
2010 15410 19964 167.9 2014
2011 16479 21102 183.2 2768
2012 17663 22294 202.7 3891
2013 18116 23303 212.2 5200
Range 3588 4392 47.7 3196
Variance 2255716.7 3089992.7 440.745 1874522.8
Interpretation
Range is a statistical tool that reflects the difference between higher and lower value. The
value of range is higher in case of WM Morrison’s and Aldi stands at second position. This
means that during the time period which is 2009-2013 it is a firm whose revenue increased at a
rapid rate. On the other hand, other statistical tool which is also known as variance is applied on
revenue of the firms. Variance indicate the movement in values of the specific variable relative
to mean value. Here variance of Aldi is low and it means that relative to mean value revenue
increased at a slow rate in case of the mentioned firm relative to other firms.
2.4 Use of quartile, percentile and correlation coefficient in business context
Quartile
6
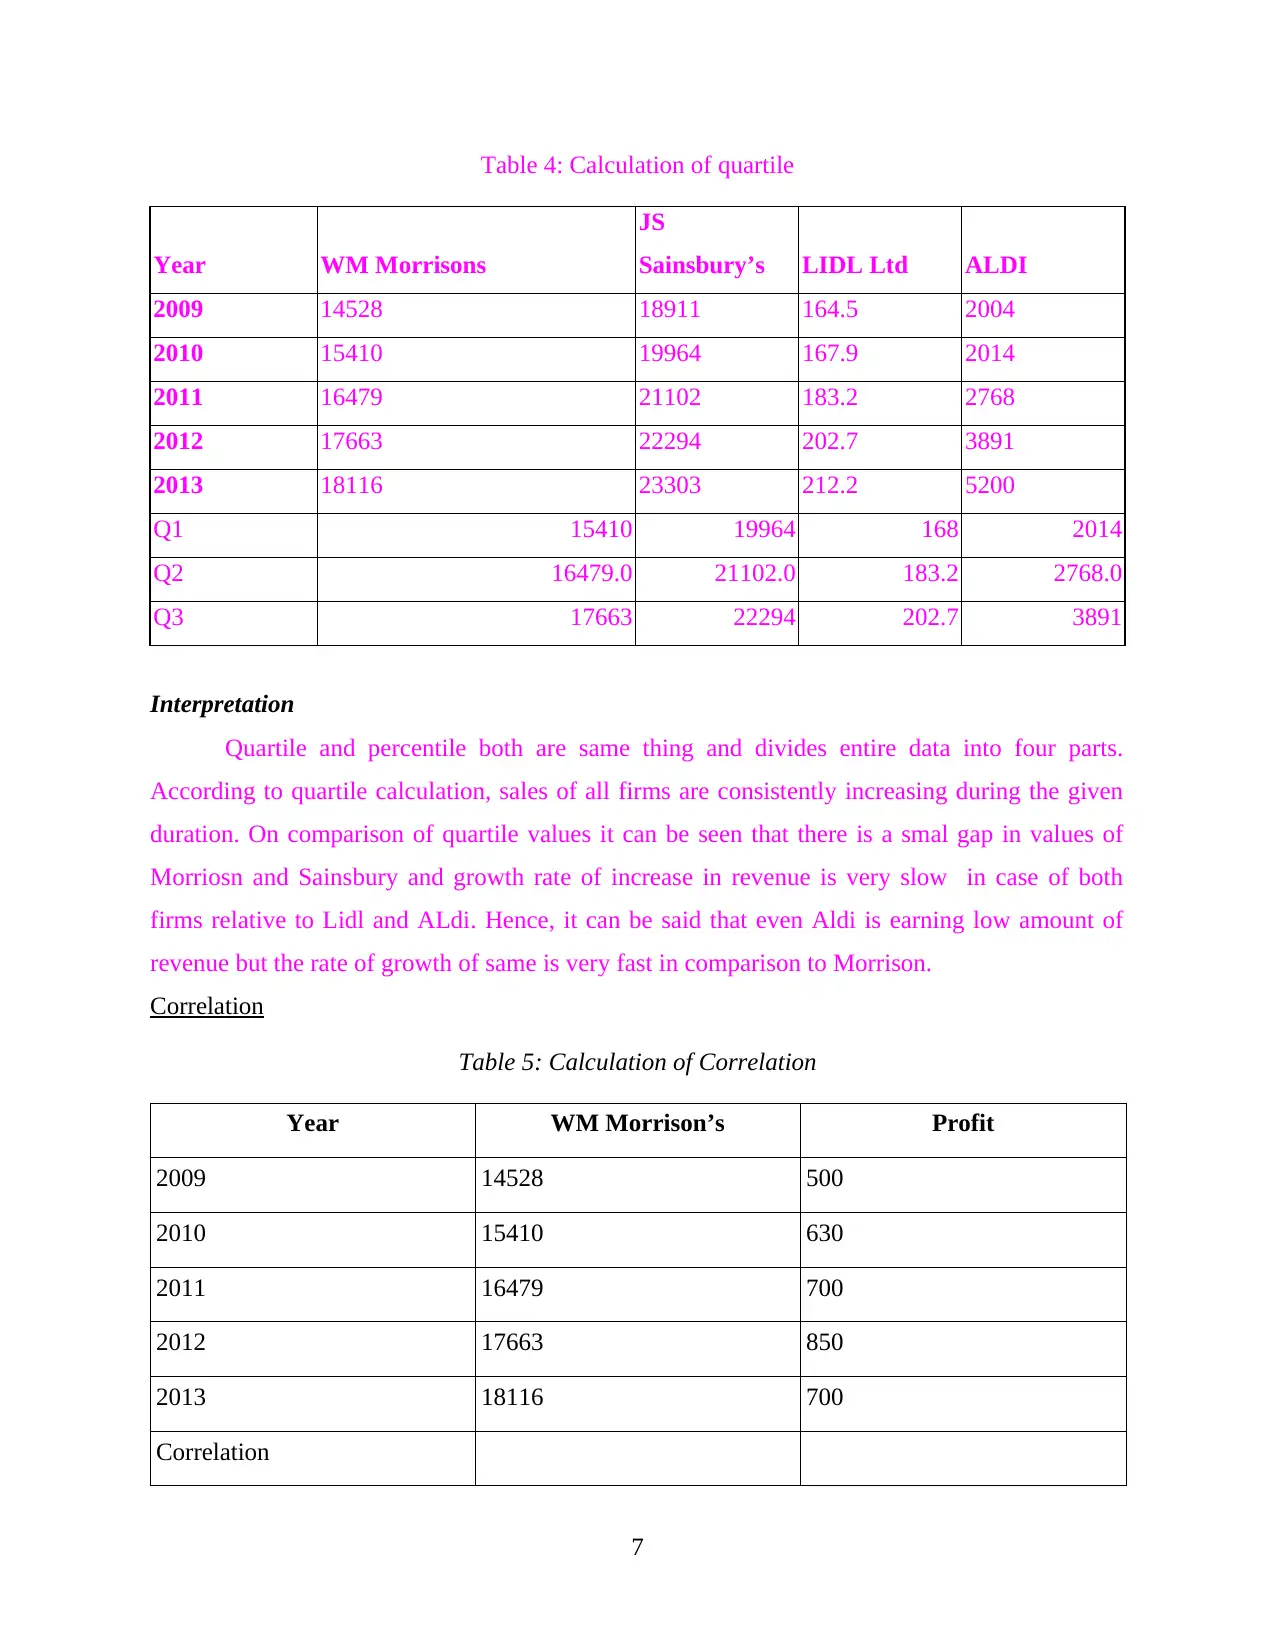
Table 4: Calculation of quartile
Year WM Morrisons
JS
Sainsbury’s LIDL Ltd ALDI
2009 14528 18911 164.5 2004
2010 15410 19964 167.9 2014
2011 16479 21102 183.2 2768
2012 17663 22294 202.7 3891
2013 18116 23303 212.2 5200
Q1 15410 19964 168 2014
Q2 16479.0 21102.0 183.2 2768.0
Q3 17663 22294 202.7 3891
Interpretation
Quartile and percentile both are same thing and divides entire data into four parts.
According to quartile calculation, sales of all firms are consistently increasing during the given
duration. On comparison of quartile values it can be seen that there is a smal gap in values of
Morriosn and Sainsbury and growth rate of increase in revenue is very slow in case of both
firms relative to Lidl and ALdi. Hence, it can be said that even Aldi is earning low amount of
revenue but the rate of growth of same is very fast in comparison to Morrison.
Correlation
Table 5: Calculation of Correlation
Year WM Morrison’s Profit
2009 14528 500
2010 15410 630
2011 16479 700
2012 17663 850
2013 18116 700
Correlation
7
⊘ This is a preview!⊘
Do you want full access?
Subscribe today to unlock all pages.
Trusted by 1+ million students worldwide
Interpretation
Correlation here simply reveals the relationship between two variables i.e. sales and
profit. Correlation of WM Morrisons is 0.83 which is near to 1. This indicates that sales and
overall profit of WM Morrison are highly correlated with each other.
TASK 3
3.1 Sales graph of Aldi and its competitors
WM Morrison
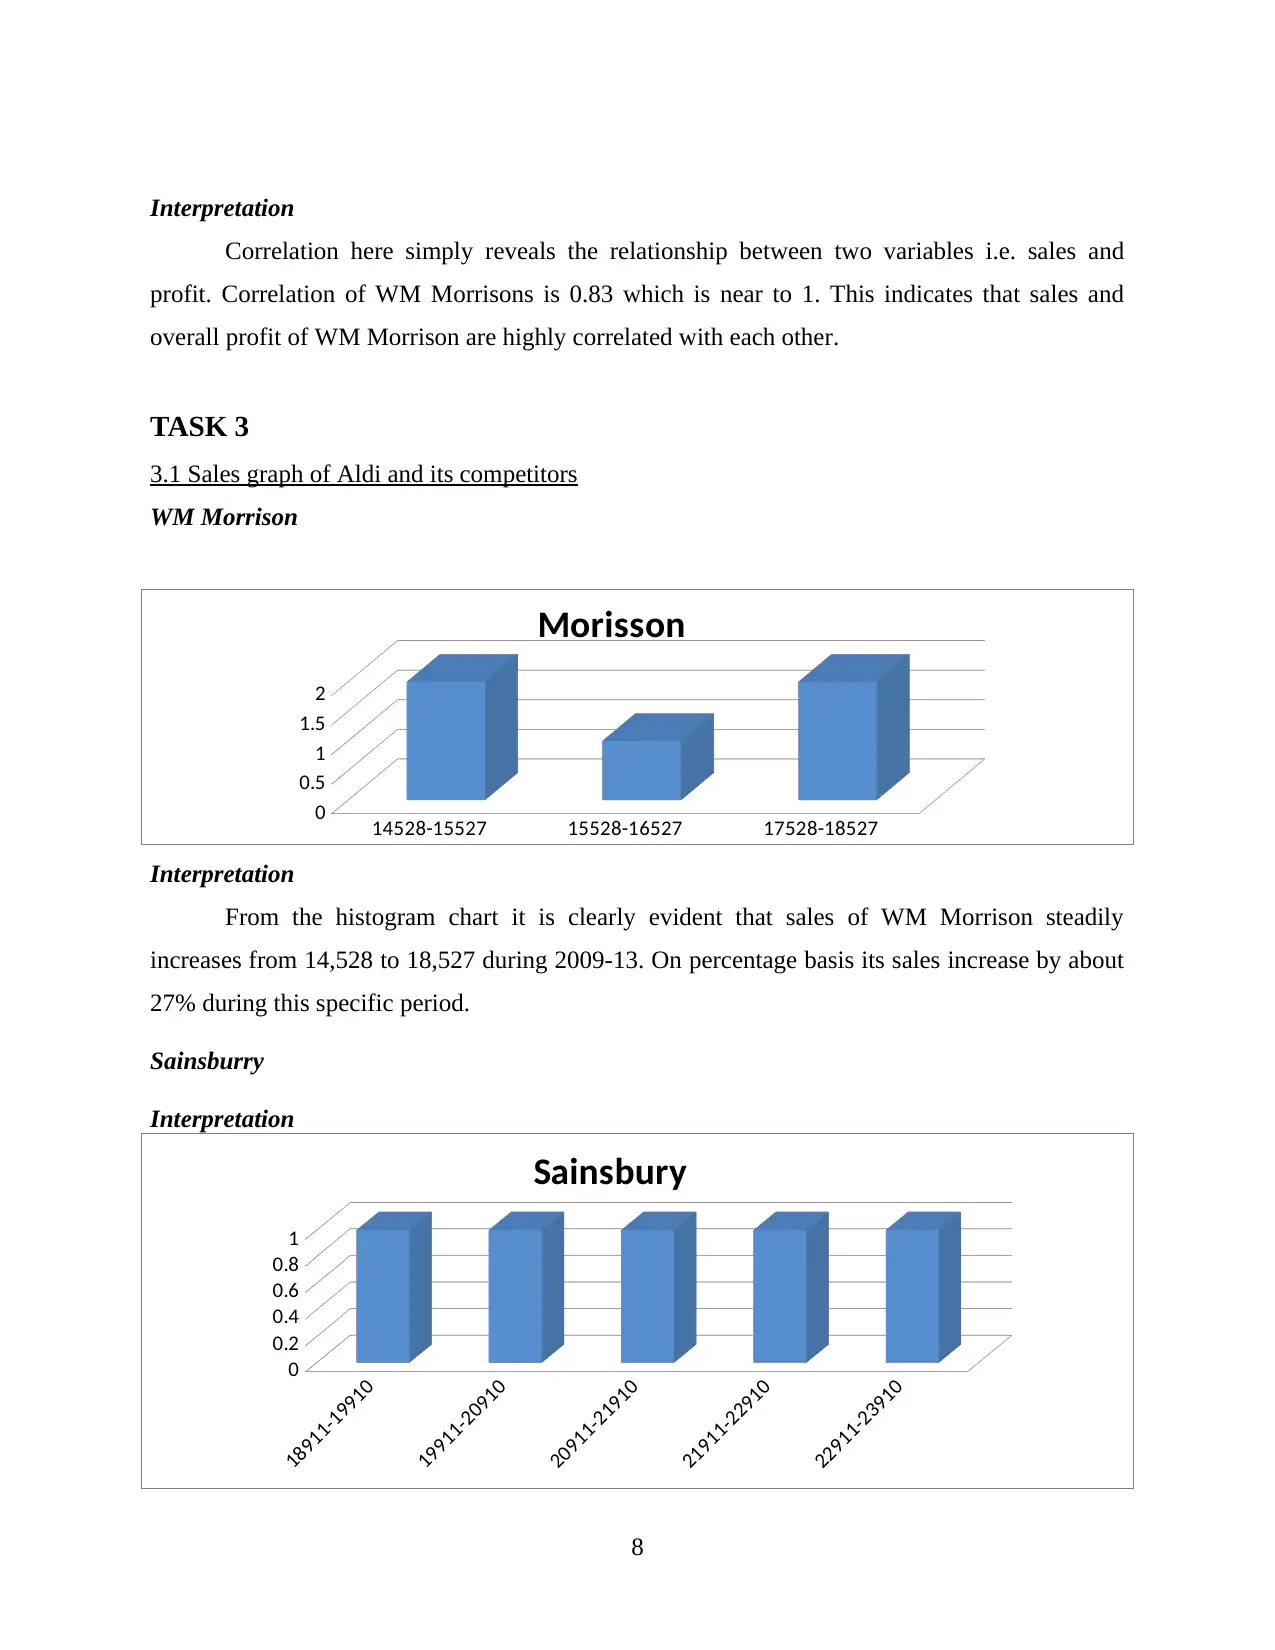
Interpretation
From the histogram chart it is clearly evident that sales of WM Morrison steadily
increases from 14,528 to 18,527 during 2009-13. On percentage basis its sales increase by about
27% during this specific period.
Sainsburry
Interpretation
8
14528-15527 15528-16527 17528-18527
0
0.5
1
1.5
2
Morisson
18911-19910
19911-20910
20911-21910
21911-22910
22911-23910
0
0.2
0.4
0.6
0.8
1
Sainsbury
Correlation here simply reveals the relationship between two variables i.e. sales and
profit. Correlation of WM Morrisons is 0.83 which is near to 1. This indicates that sales and
overall profit of WM Morrison are highly correlated with each other.
TASK 3
3.1 Sales graph of Aldi and its competitors
WM Morrison
Interpretation
From the histogram chart it is clearly evident that sales of WM Morrison steadily
increases from 14,528 to 18,527 during 2009-13. On percentage basis its sales increase by about
27% during this specific period.
Sainsburry
Interpretation
8
14528-15527 15528-16527 17528-18527
0
0.5
1
1.5
2
Morisson
18911-19910
19911-20910
20911-21910
21911-22910
22911-23910
0
0.2
0.4
0.6
0.8
1
Sainsbury
Paraphrase This Document
Need a fresh take? Get an instant paraphrase of this document with our AI Paraphraser
I histogram of Sainsburry is compared with its competitors it is clear that it has a very
high sales volume in comparison to peer companies. During this period its sales plunged by 26%,
on the basis of figures of sales volume Sainsburry is far ahead of Morrison but if we compare
both on growth rate basis both stands at same position.
LIDL
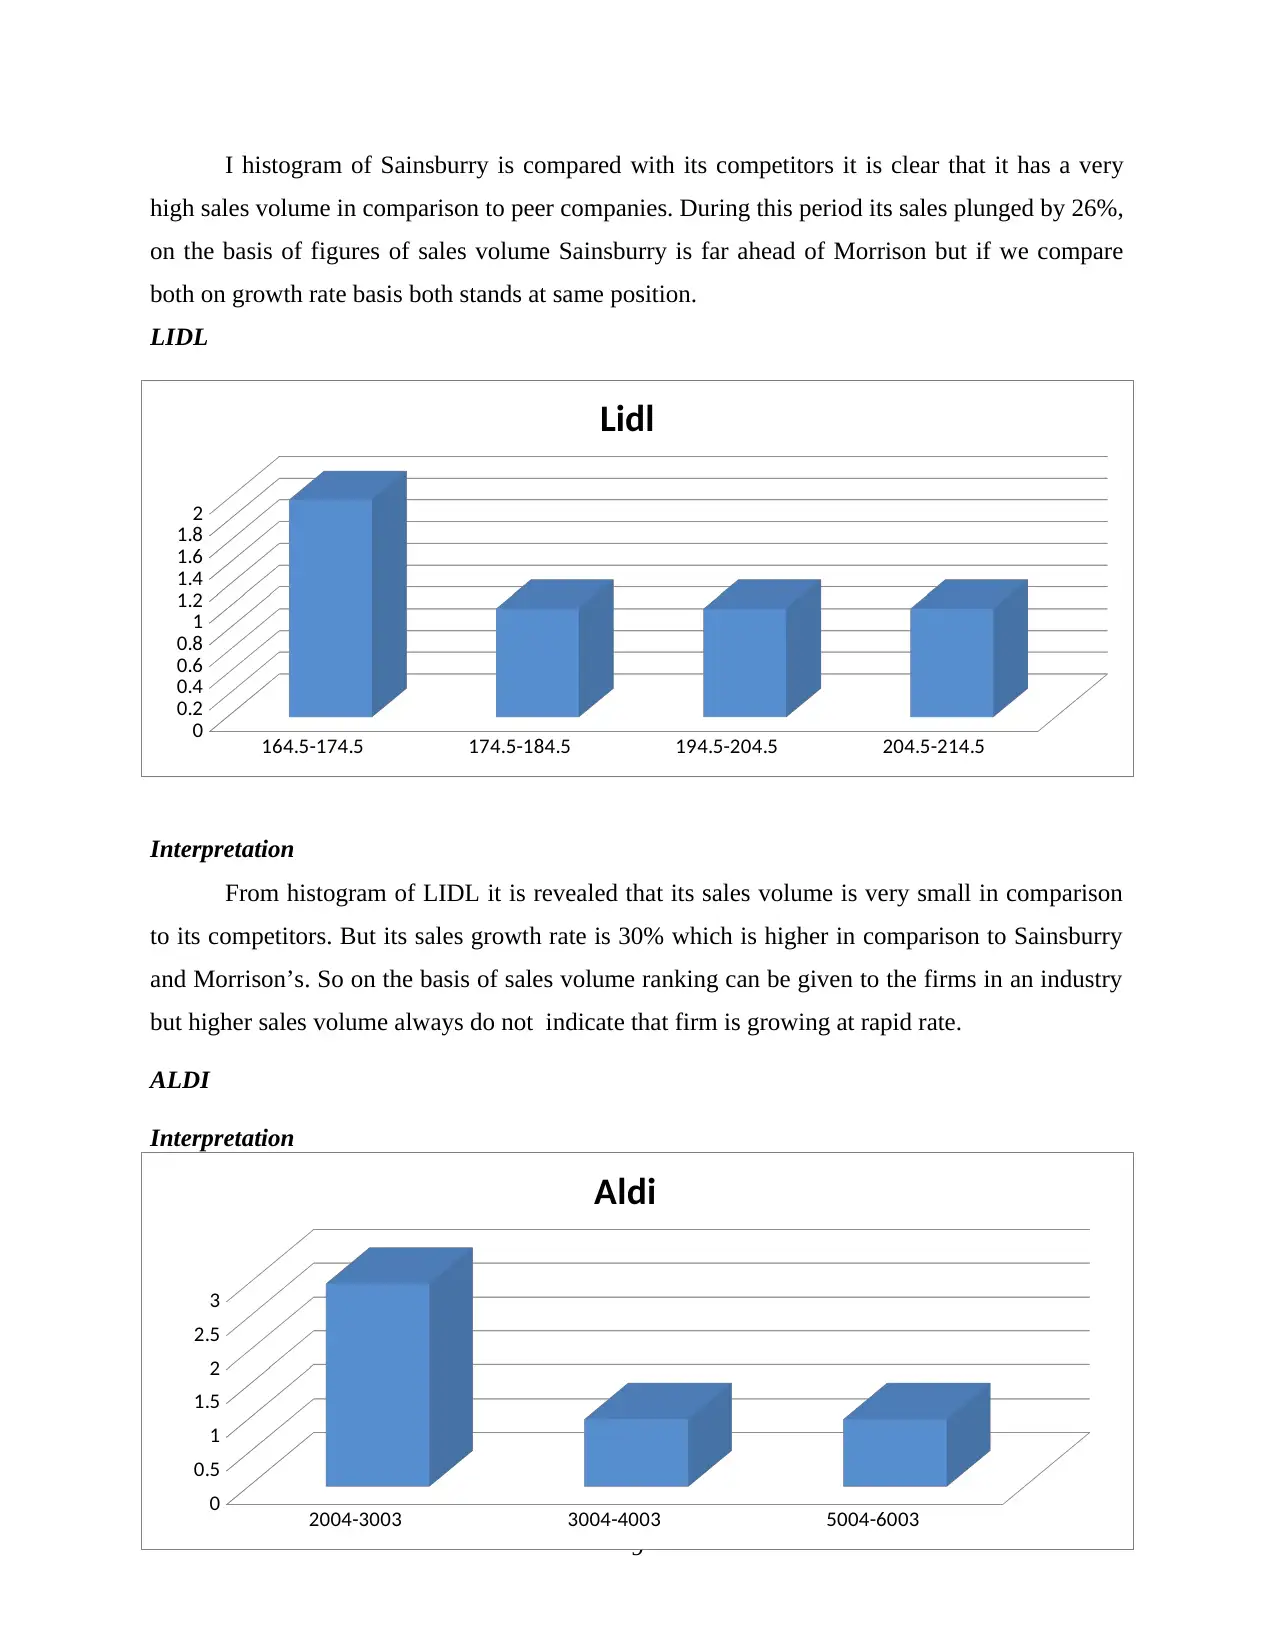
Interpretation
From histogram of LIDL it is revealed that its sales volume is very small in comparison
to its competitors. But its sales growth rate is 30% which is higher in comparison to Sainsburry
and Morrison’s. So on the basis of sales volume ranking can be given to the firms in an industry
but higher sales volume always do not indicate that firm is growing at rapid rate.
ALDI
Interpretation
9
164.5-174.5 174.5-184.5 194.5-204.5 204.5-214.5
0
0.2
0.4
0.6
0.8
1
1.2
1.4
1.6
1.8
2
Lidl
2004-3003 3004-4003 5004-6003
0
0.5
1
1.5
2
2.5
3
Aldi
high sales volume in comparison to peer companies. During this period its sales plunged by 26%,
on the basis of figures of sales volume Sainsburry is far ahead of Morrison but if we compare
both on growth rate basis both stands at same position.
LIDL
Interpretation
From histogram of LIDL it is revealed that its sales volume is very small in comparison
to its competitors. But its sales growth rate is 30% which is higher in comparison to Sainsburry
and Morrison’s. So on the basis of sales volume ranking can be given to the firms in an industry
but higher sales volume always do not indicate that firm is growing at rapid rate.
ALDI
Interpretation
9
164.5-174.5 174.5-184.5 194.5-204.5 204.5-214.5
0
0.2
0.4
0.6
0.8
1
1.2
1.4
1.6
1.8
2
Lidl
2004-3003 3004-4003 5004-6003
0
0.5
1
1.5
2
2.5
3
Aldi
Histogram of ALDI clearly shows that it is in third position if compared with its aforesaid
three competitors. Its sales volume is small in comparison to Sainsburry and Morrison’s. But if
we compare all these companies on the basis of sales growth rate then ALDI is far ahead of these
companies with growth rate of 199% from 2009-13.
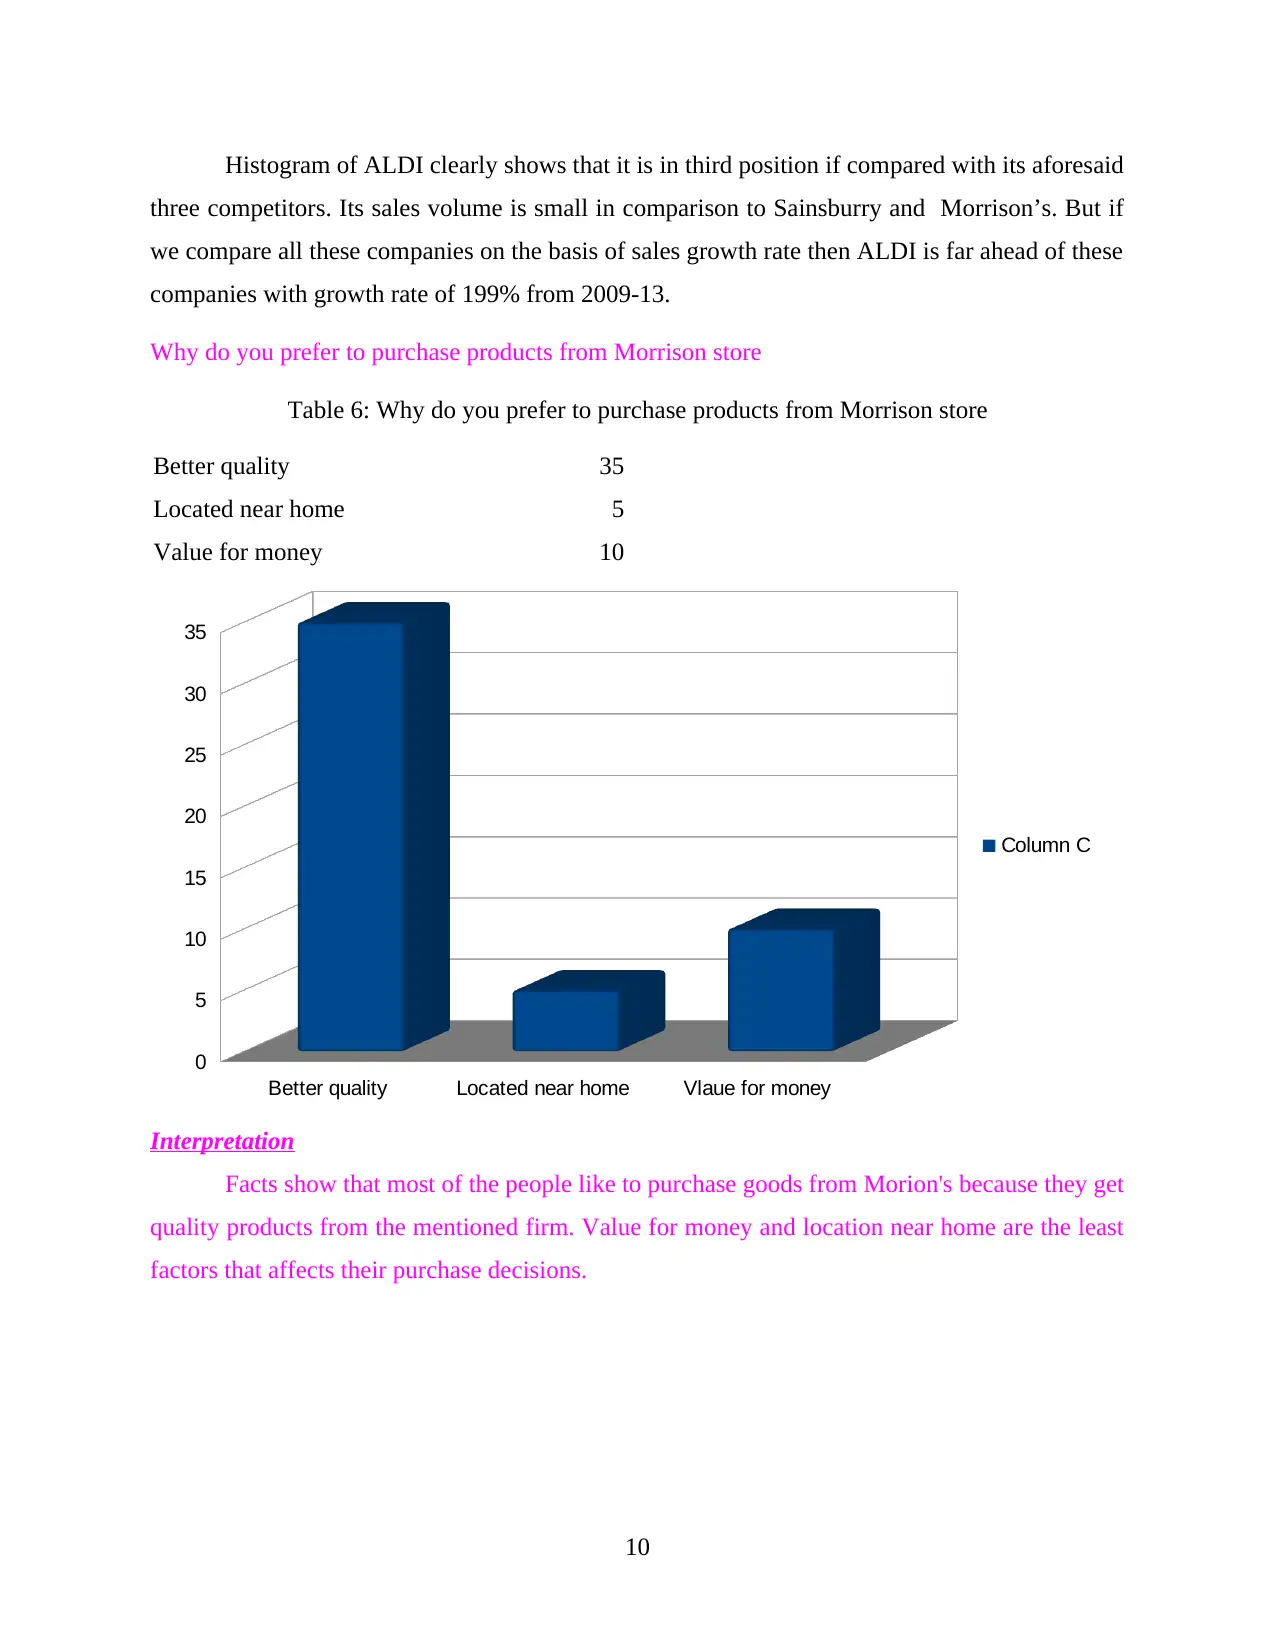
Why do you prefer to purchase products from Morrison store
Table 6: Why do you prefer to purchase products from Morrison store
Better quality 35
Located near home 5
Value for money 10
Interpretation
Facts show that most of the people like to purchase goods from Morion's because they get
quality products from the mentioned firm. Value for money and location near home are the least
factors that affects their purchase decisions.
10
Better quality Located near home Vlaue for money
0
5
10
15
20
25
30
35
Column C
three competitors. Its sales volume is small in comparison to Sainsburry and Morrison’s. But if
we compare all these companies on the basis of sales growth rate then ALDI is far ahead of these
companies with growth rate of 199% from 2009-13.
Why do you prefer to purchase products from Morrison store
Table 6: Why do you prefer to purchase products from Morrison store
Better quality 35
Located near home 5
Value for money 10
Interpretation
Facts show that most of the people like to purchase goods from Morion's because they get
quality products from the mentioned firm. Value for money and location near home are the least
factors that affects their purchase decisions.
10
Better quality Located near home Vlaue for money
0
5
10
15
20
25
30
35
Column C
⊘ This is a preview!⊘
Do you want full access?
Subscribe today to unlock all pages.
Trusted by 1+ million students worldwide
1 out of 21
Related Documents


Your All-in-One AI-Powered Toolkit for Academic Success.
+13062052269
info@desklib.com
Available 24*7 on WhatsApp / Email
![[object Object]](/_next/static/media/star-bottom.7253800d.svg)
Unlock your academic potential
Copyright © 2020–2026 A2Z Services. All Rights Reserved. Developed and managed by ZUCOL.