Stationery Market Analysis and Business Operations Report
VerifiedAdded on 2020/06/04
|14
|2522
|42
Report
AI Summary
This report presents a comprehensive analysis of the stationary business, focusing on market trends in Germany and France. It examines sales data from 2015 to 2017, including total sales figures and pie charts illustrating the mix of produced items. The report includes a scatter diagram and correlation coefficient analysis to assess the relationship between sales. Furthermore, it forecasts sales for 2018 and 2019 based on historical trends. The assessment also explores the pros and cons of business expansion, suggests international standards for operational improvements (ISO 14001 and ISO 26000), and analyzes monthly repayment costs for potential business loans. Descriptive statistics are provided for various components such as customer service, product quality, sales staff, and price value. The report concludes with recommendations for improving business operations and consumer engagement. This report is contributed by a student to be published on Desklib, a platform which provides all the necessary AI based study tools for students.
Summative Assessment
Paraphrase This Document
Need a fresh take? Get an instant paraphrase of this document with our AI Paraphraser
TABLE OF CONTENTS
INTRODUCTION...........................................................................................................................1
TASK 1............................................................................................................................................1
TASK 2............................................................................................................................................2
TASK 3............................................................................................................................................2
A Measuring the total sales....................................................................................................2
B Presenting the mix pie chart for the year 2016 and 2017 in terms of produced items.......3
C Presenting the scatter diagram for Total sales and Correlation Coefficient.......................4
D Determining the Forecasted sales for the years 2018 and 2019 on the basis of continues
sales trends..............................................................................................................................5
TASK 4............................................................................................................................................6
A Pros and Cons Table...........................................................................................................6
B Implementing various international standards to improve the operational activities of such
business...................................................................................................................................6
TASK 5............................................................................................................................................7
A Measuring the monthly costs of repayment........................................................................7
B Re-Calculating the monthly cost over interest and loans...................................................7
TASK 6............................................................................................................................................8
TASK 7............................................................................................................................................8
A Suggesting firm to improve the business operations..........................................................8
B Analysing the descriptive statistics over the given data set................................................8
TASK 8............................................................................................................................................9
REFERENCES..............................................................................................................................10
APPENDIX....................................................................................................................................11
INTRODUCTION
To make the favourable increment in the sale and revenue for business in the long run
there is need to have the proper analysis over various business operations. Germany, France and
many European companies are currently facing obstacles in the stationary businesses. However,
in the present assessment there has been analysis over the current market scenario, trend in the
stationary industries of such countries. There will be presentation of various data set which in
turn helpful for making the adequate increments in the sale or revenue generation for such trade
practices. The report will also present various diagrams such as Pie chart, scatter diagrams etc.
which in turn beneficial to analyse the growth of such market as well as intermittence in the sale
of such industries.
TASK 1
In accordance with the trends in Germany and France it can be said that there is no
favourable results come from the Germany as there is not adequate trend in such country. There
has been reduction in the wholesale or retail business for stationary in accordance with the
drastic reduction in demands or requirement for such items. Thus, the impact over having the
reductions in the demand is due to decreasing numbers of children as well as declining demand
of stationer will lead such businesses on the downfall (Suzuki and Okamuro, 2016). In terms of
the regular decline in te demand which is cause d by declining turnover of the company.
Therefore, there will be main reasons behind such changes such as digitalisation However, it has
affected the sales of Stationary items in the country because of the existence of digital ways of
submitting the homework, preparing the projects, assignment over computer devices as well as it
has become trend and very promptly prepared or edited. Thus, for the ease of consumers there
has been reduction in the paper work which in turn results in the declining demand for
stationeries (Sayed-Mouchaweh and Lughofer, eds., 2012). Hence, it can be said that the
company nee to have the adequate strategies to have the favourable survival in the rivalry
environment.
1
⊘ This is a preview!⊘
Do you want full access?
Subscribe today to unlock all pages.
Trusted by 1+ million students worldwide
TASK 2
0
5
10
15
20
25
30
35
40
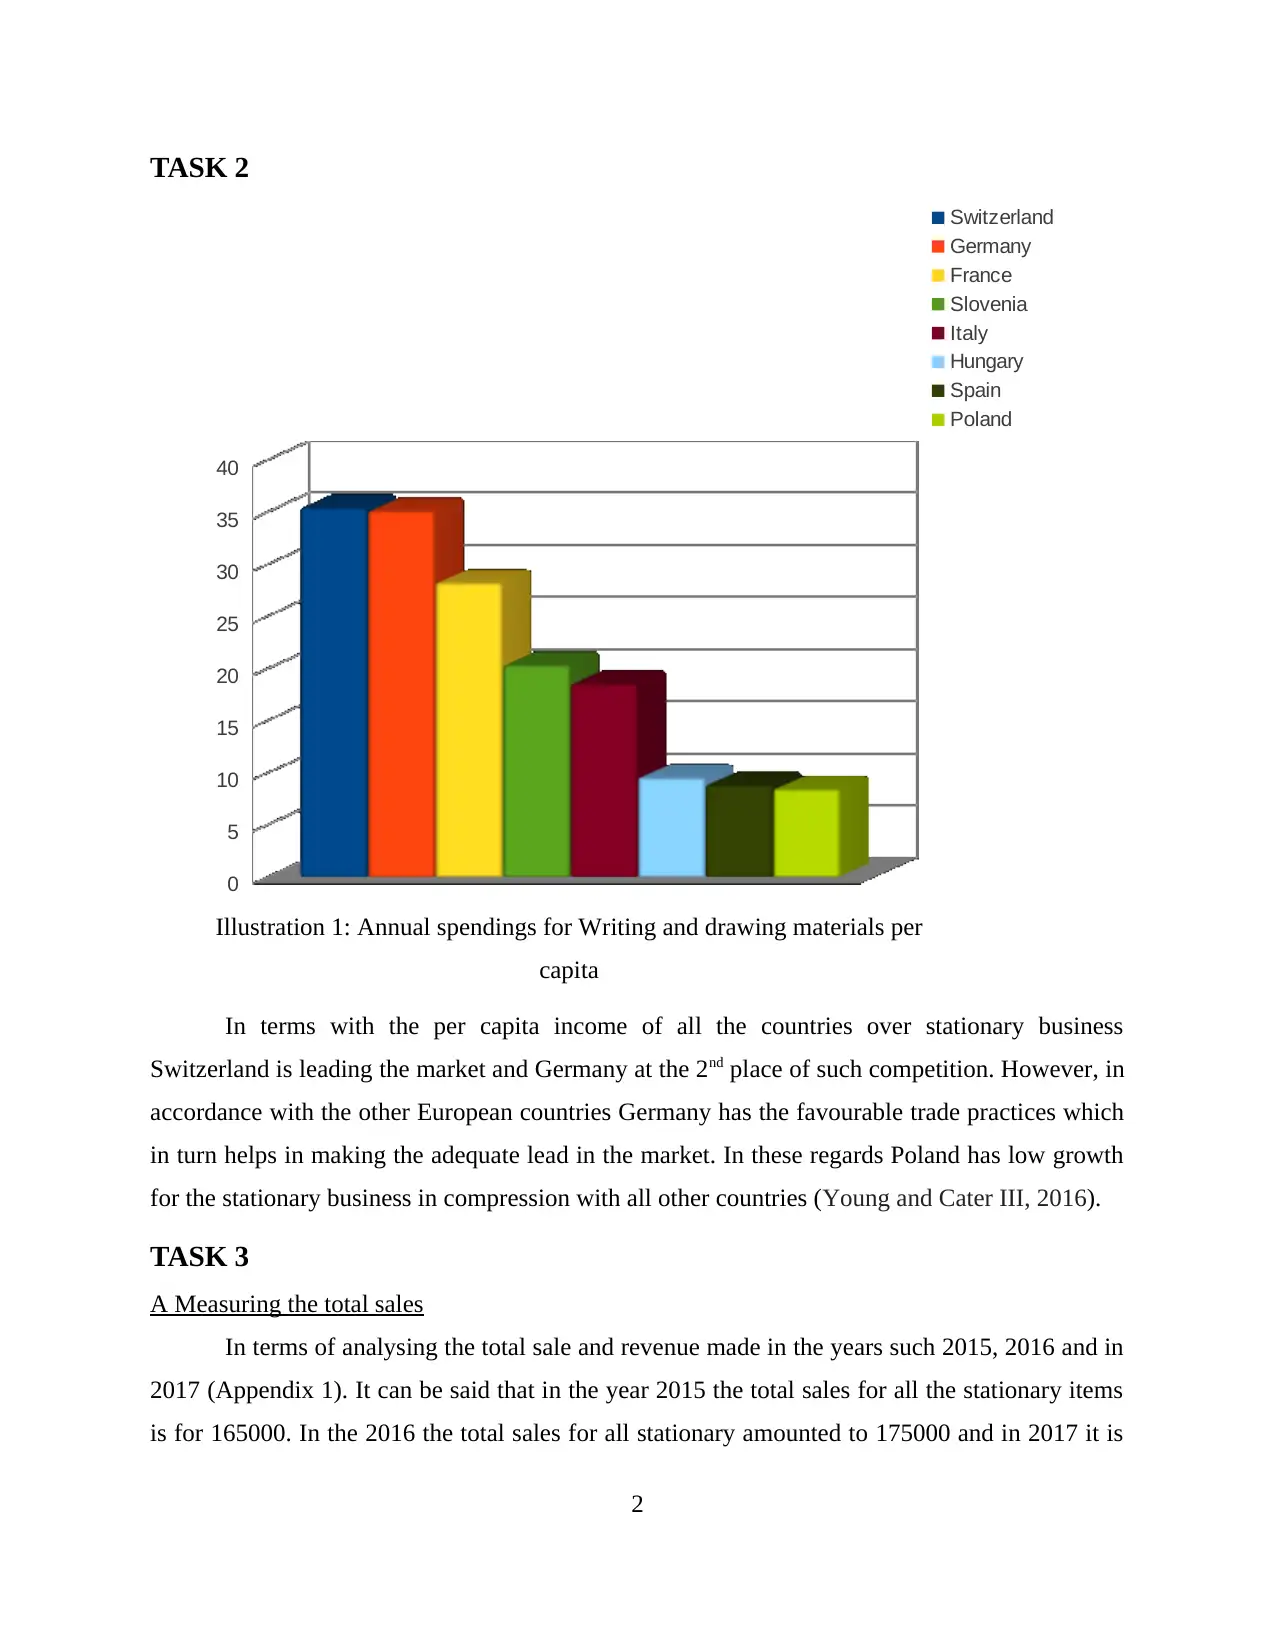
Illustration 1: Annual spendings for Writing and drawing materials per
capita
Switzerland
Germany
France
Slovenia
Italy
Hungary
Spain
Poland
In terms with the per capita income of all the countries over stationary business
Switzerland is leading the market and Germany at the 2nd place of such competition. However, in
accordance with the other European countries Germany has the favourable trade practices which
in turn helps in making the adequate lead in the market. In these regards Poland has low growth
for the stationary business in compression with all other countries (Young and Cater III, 2016).
TASK 3
A Measuring the total sales
In terms of analysing the total sale and revenue made in the years such 2015, 2016 and in
2017 (Appendix 1). It can be said that in the year 2015 the total sales for all the stationary items
is for 165000. In the 2016 the total sales for all stationary amounted to 175000 and in 2017 it is
2
0
5
10
15
20
25
30
35
40
Illustration 1: Annual spendings for Writing and drawing materials per
capita
Switzerland
Germany
France
Slovenia
Italy
Hungary
Spain
Poland
In terms with the per capita income of all the countries over stationary business
Switzerland is leading the market and Germany at the 2nd place of such competition. However, in
accordance with the other European countries Germany has the favourable trade practices which
in turn helps in making the adequate lead in the market. In these regards Poland has low growth
for the stationary business in compression with all other countries (Young and Cater III, 2016).
TASK 3
A Measuring the total sales
In terms of analysing the total sale and revenue made in the years such 2015, 2016 and in
2017 (Appendix 1). It can be said that in the year 2015 the total sales for all the stationary items
is for 165000. In the 2016 the total sales for all stationary amounted to 175000 and in 2017 it is
2
Paraphrase This Document
Need a fresh take? Get an instant paraphrase of this document with our AI Paraphraser
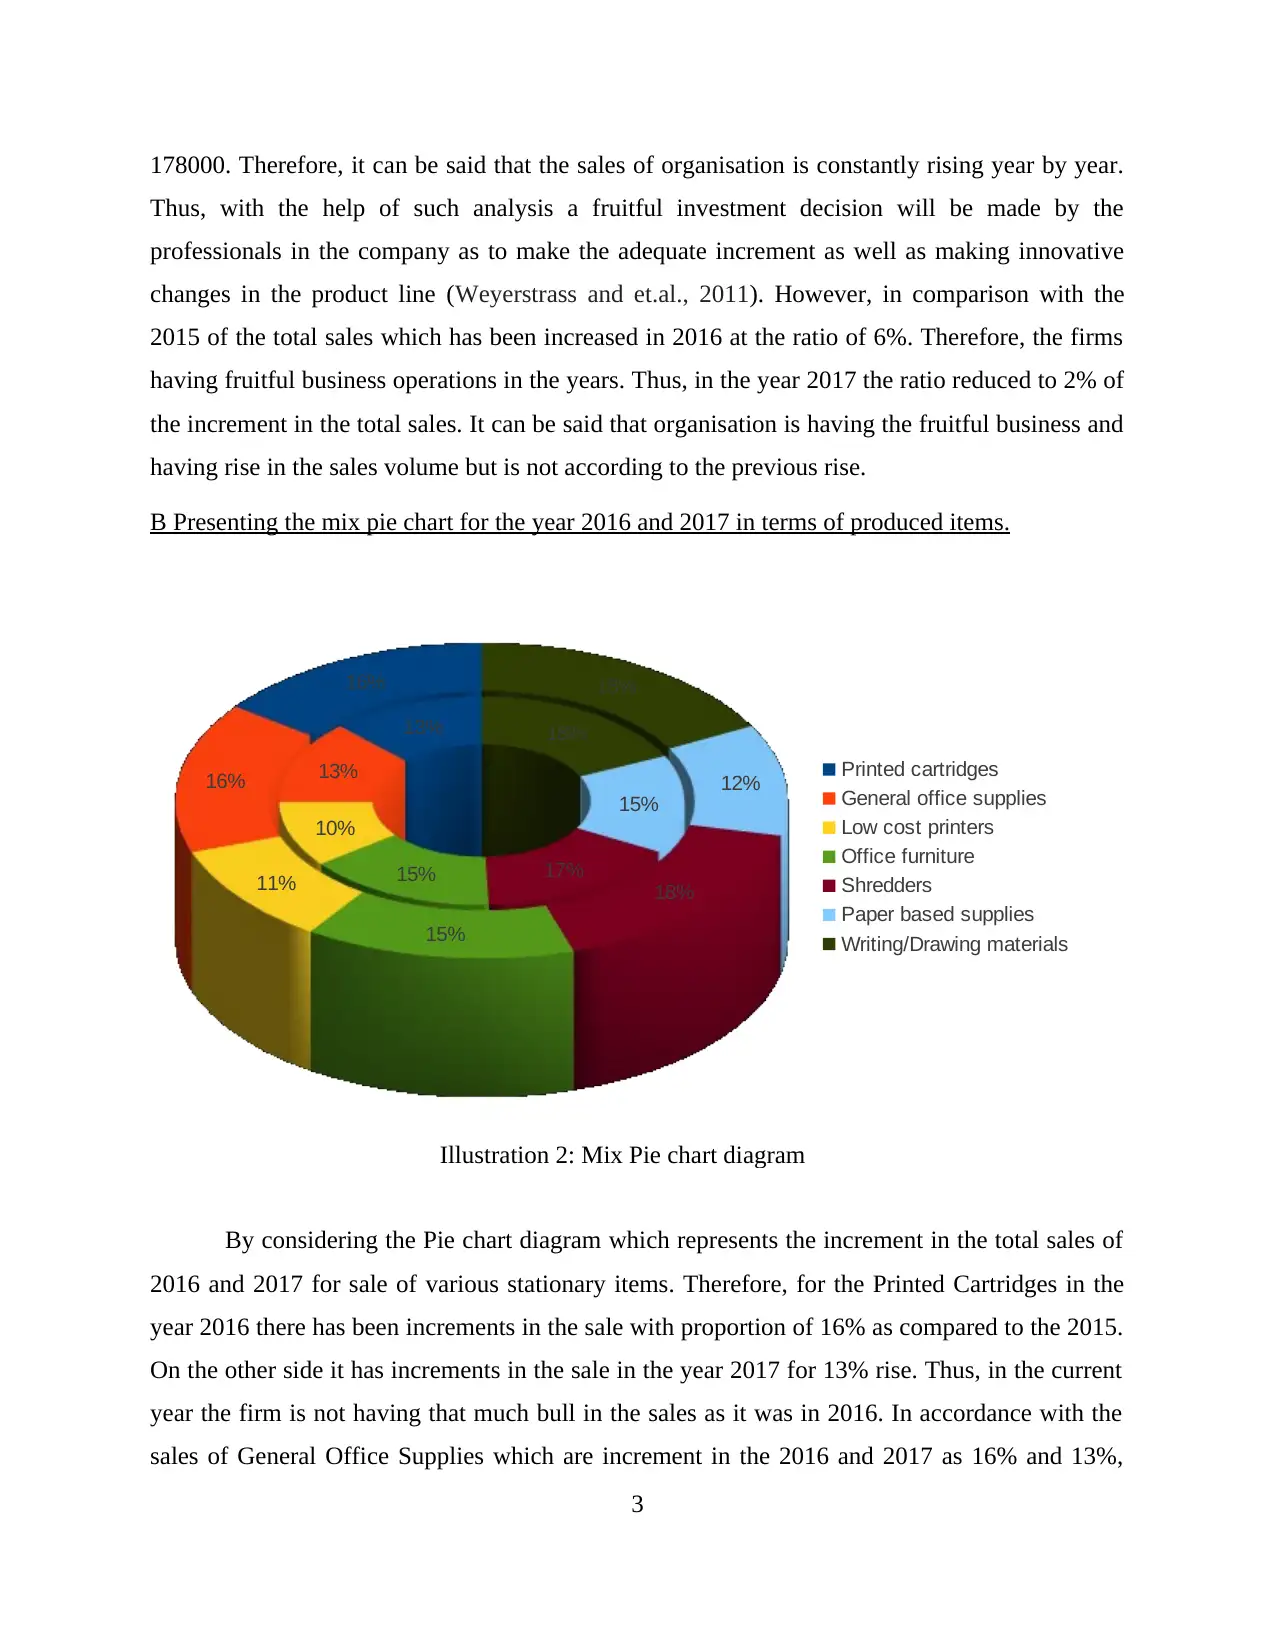
178000. Therefore, it can be said that the sales of organisation is constantly rising year by year.
Thus, with the help of such analysis a fruitful investment decision will be made by the
professionals in the company as to make the adequate increment as well as making innovative
changes in the product line (Weyerstrass and et.al., 2011). However, in comparison with the
2015 of the total sales which has been increased in 2016 at the ratio of 6%. Therefore, the firms
having fruitful business operations in the years. Thus, in the year 2017 the ratio reduced to 2% of
the increment in the total sales. It can be said that organisation is having the fruitful business and
having rise in the sales volume but is not according to the previous rise.
B Presenting the mix pie chart for the year 2016 and 2017 in terms of produced items.
16%
16%
11%
15%
18%
12%
18%
13%
13%
10%
15% 17%
15%
18%
Printed cartridges
General office supplies
Low cost printers
Office furniture
Shredders
Paper based supplies
Writing/Drawing materials
Illustration 2: Mix Pie chart diagram
By considering the Pie chart diagram which represents the increment in the total sales of
2016 and 2017 for sale of various stationary items. Therefore, for the Printed Cartridges in the
year 2016 there has been increments in the sale with proportion of 16% as compared to the 2015.
On the other side it has increments in the sale in the year 2017 for 13% rise. Thus, in the current
year the firm is not having that much bull in the sales as it was in 2016. In accordance with the
sales of General Office Supplies which are increment in the 2016 and 2017 as 16% and 13%,
3
Low Cost printers has 11% and 10% increments in sales for the same years. The Office Furniture
has the same proportional increment in both the years such as 15% in 2016 as well as in 2017.
Shredders has increment of 18% of sale in 2016 which has a percent decrease in 2017 as 17%.
Paper based supplies are increase in 2016 as 12% while in 2017 it has 3% more ratio such as
15%. The writing/Drawing material has the constant increment in both the years such as 18% in
2016 and in 2017.
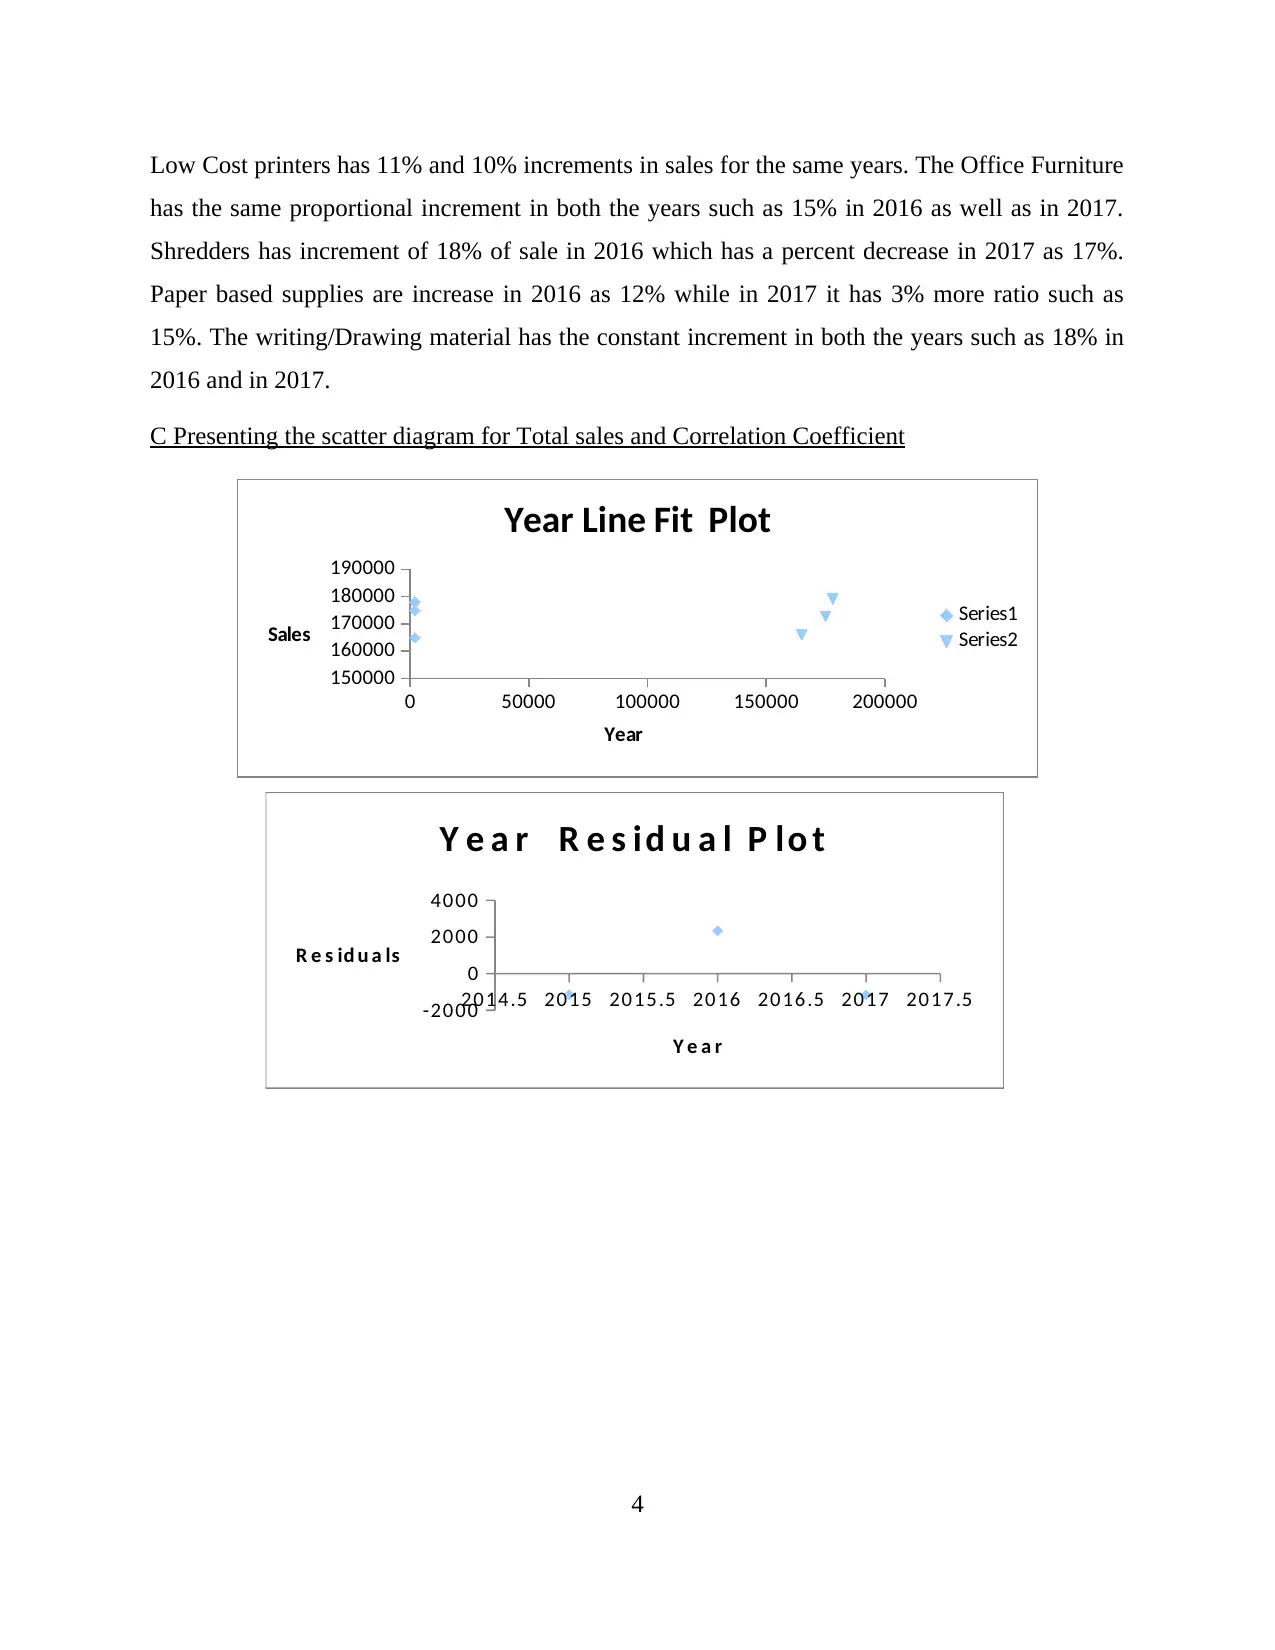
C Presenting the scatter diagram for Total sales and Correlation Coefficient
2014.5 2015 2015.5 2016 2016.5 2017 2017.5
-2000
0
2000
4000
Y e a r R e s id u a l P lo t
Y e a r
R e s id u a ls
4
0 50000 100000 150000 200000
150000
160000
170000
180000
190000
Year Line Fit Plot
Series1
Series2
Year
Sales
has the same proportional increment in both the years such as 15% in 2016 as well as in 2017.
Shredders has increment of 18% of sale in 2016 which has a percent decrease in 2017 as 17%.
Paper based supplies are increase in 2016 as 12% while in 2017 it has 3% more ratio such as
15%. The writing/Drawing material has the constant increment in both the years such as 18% in
2016 and in 2017.
C Presenting the scatter diagram for Total sales and Correlation Coefficient
2014.5 2015 2015.5 2016 2016.5 2017 2017.5
-2000
0
2000
4000
Y e a r R e s id u a l P lo t
Y e a r
R e s id u a ls
4
0 50000 100000 150000 200000
150000
160000
170000
180000
190000
Year Line Fit Plot
Series1
Series2
Year
Sales
⊘ This is a preview!⊘
Do you want full access?
Subscribe today to unlock all pages.
Trusted by 1+ million students worldwide
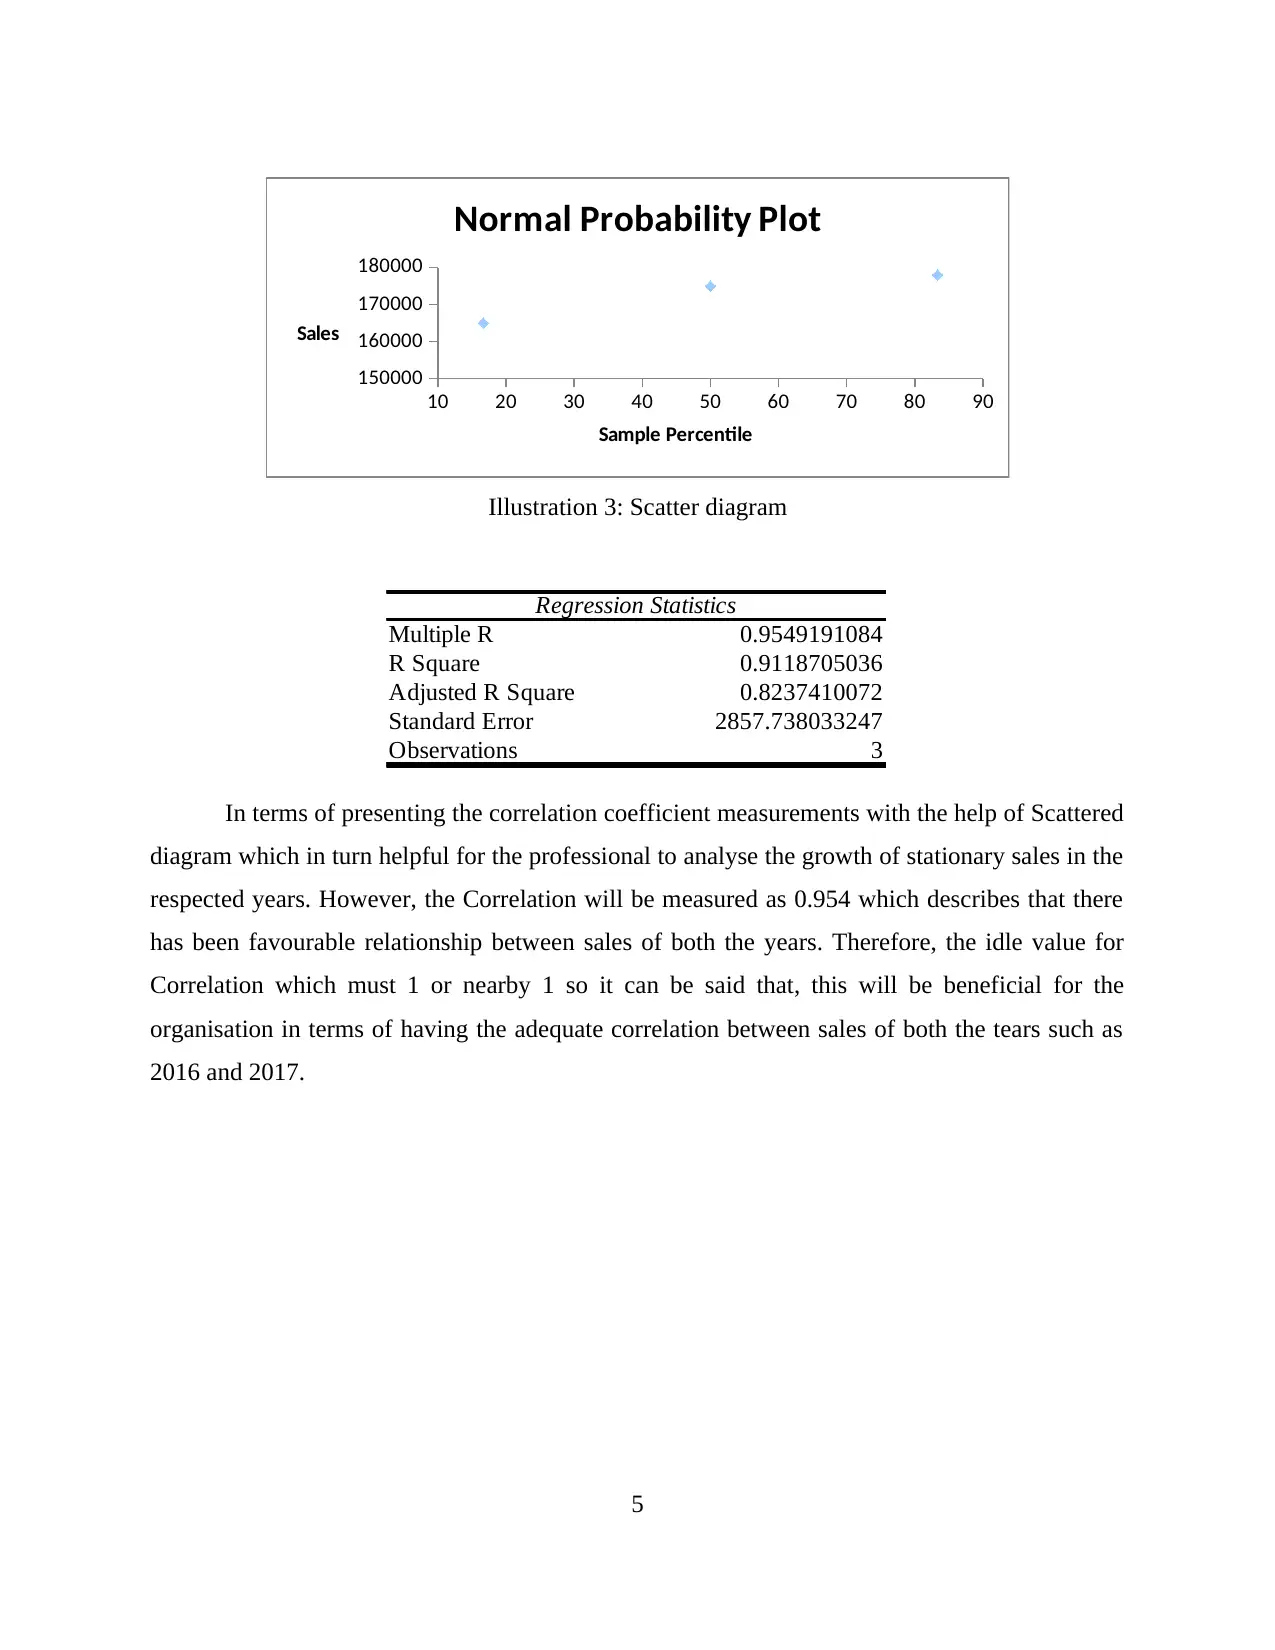
Regression Statistics
Multiple R 0.9549191084
R Square 0.9118705036
Adjusted R Square 0.8237410072
Standard Error 2857.738033247
Observations 3
In terms of presenting the correlation coefficient measurements with the help of Scattered
diagram which in turn helpful for the professional to analyse the growth of stationary sales in the
respected years. However, the Correlation will be measured as 0.954 which describes that there
has been favourable relationship between sales of both the years. Therefore, the idle value for
Correlation which must 1 or nearby 1 so it can be said that, this will be beneficial for the
organisation in terms of having the adequate correlation between sales of both the tears such as
2016 and 2017.
5
10 20 30 40 50 60 70 80 90
150000
160000
170000
180000
Normal Probability Plot
Sample Percentile
Sales
Illustration 3: Scatter diagram
Paraphrase This Document
Need a fresh take? Get an instant paraphrase of this document with our AI Paraphraser
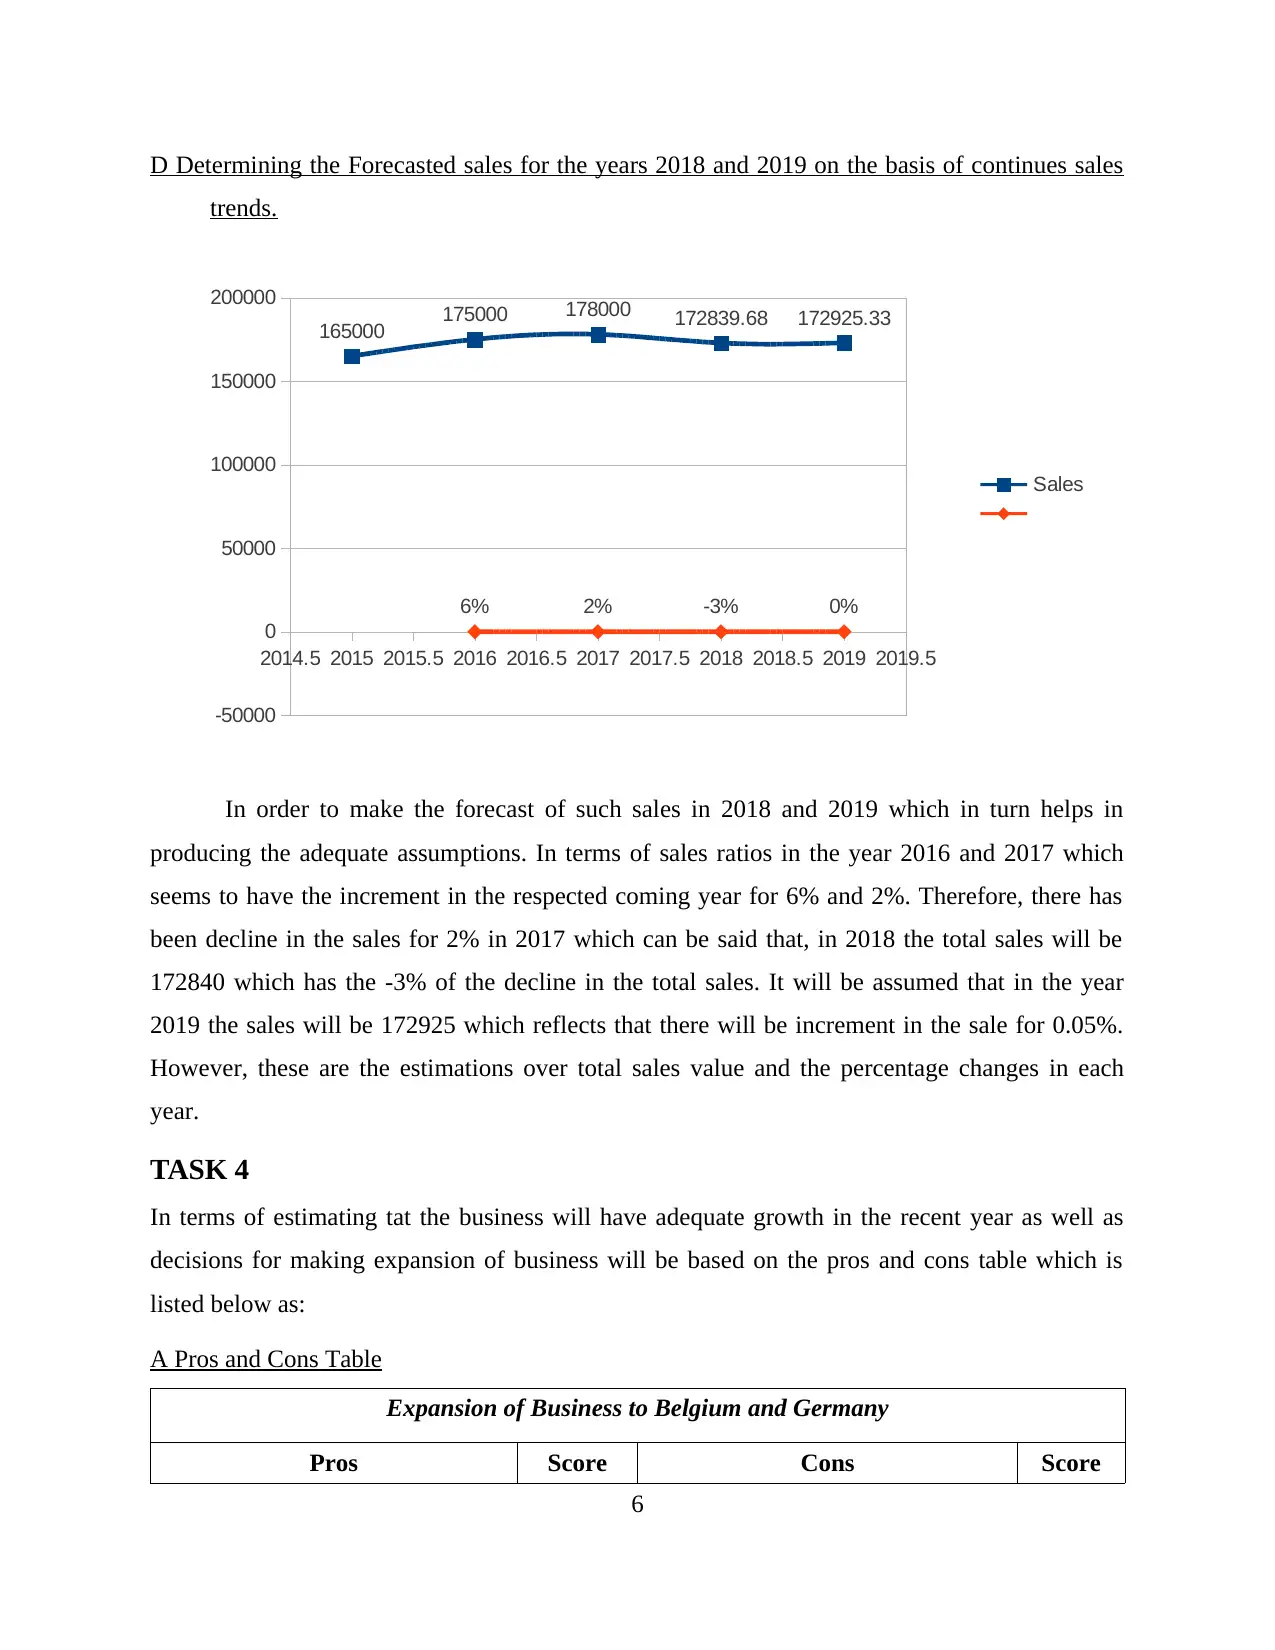
D Determining the Forecasted sales for the years 2018 and 2019 on the basis of continues sales
trends.
2014.5 2015 2015.5 2016 2016.5 2017 2017.5 2018 2018.5 2019 2019.5
-50000
0
50000
100000
150000
200000
165000 175000 178000 172839.68 172925.33
6% 2% -3% 0%
Sales
In order to make the forecast of such sales in 2018 and 2019 which in turn helps in
producing the adequate assumptions. In terms of sales ratios in the year 2016 and 2017 which
seems to have the increment in the respected coming year for 6% and 2%. Therefore, there has
been decline in the sales for 2% in 2017 which can be said that, in 2018 the total sales will be
172840 which has the -3% of the decline in the total sales. It will be assumed that in the year
2019 the sales will be 172925 which reflects that there will be increment in the sale for 0.05%.
However, these are the estimations over total sales value and the percentage changes in each
year.
TASK 4
In terms of estimating tat the business will have adequate growth in the recent year as well as
decisions for making expansion of business will be based on the pros and cons table which is
listed below as:
A Pros and Cons Table
Expansion of Business to Belgium and Germany
Pros Score Cons Score
6
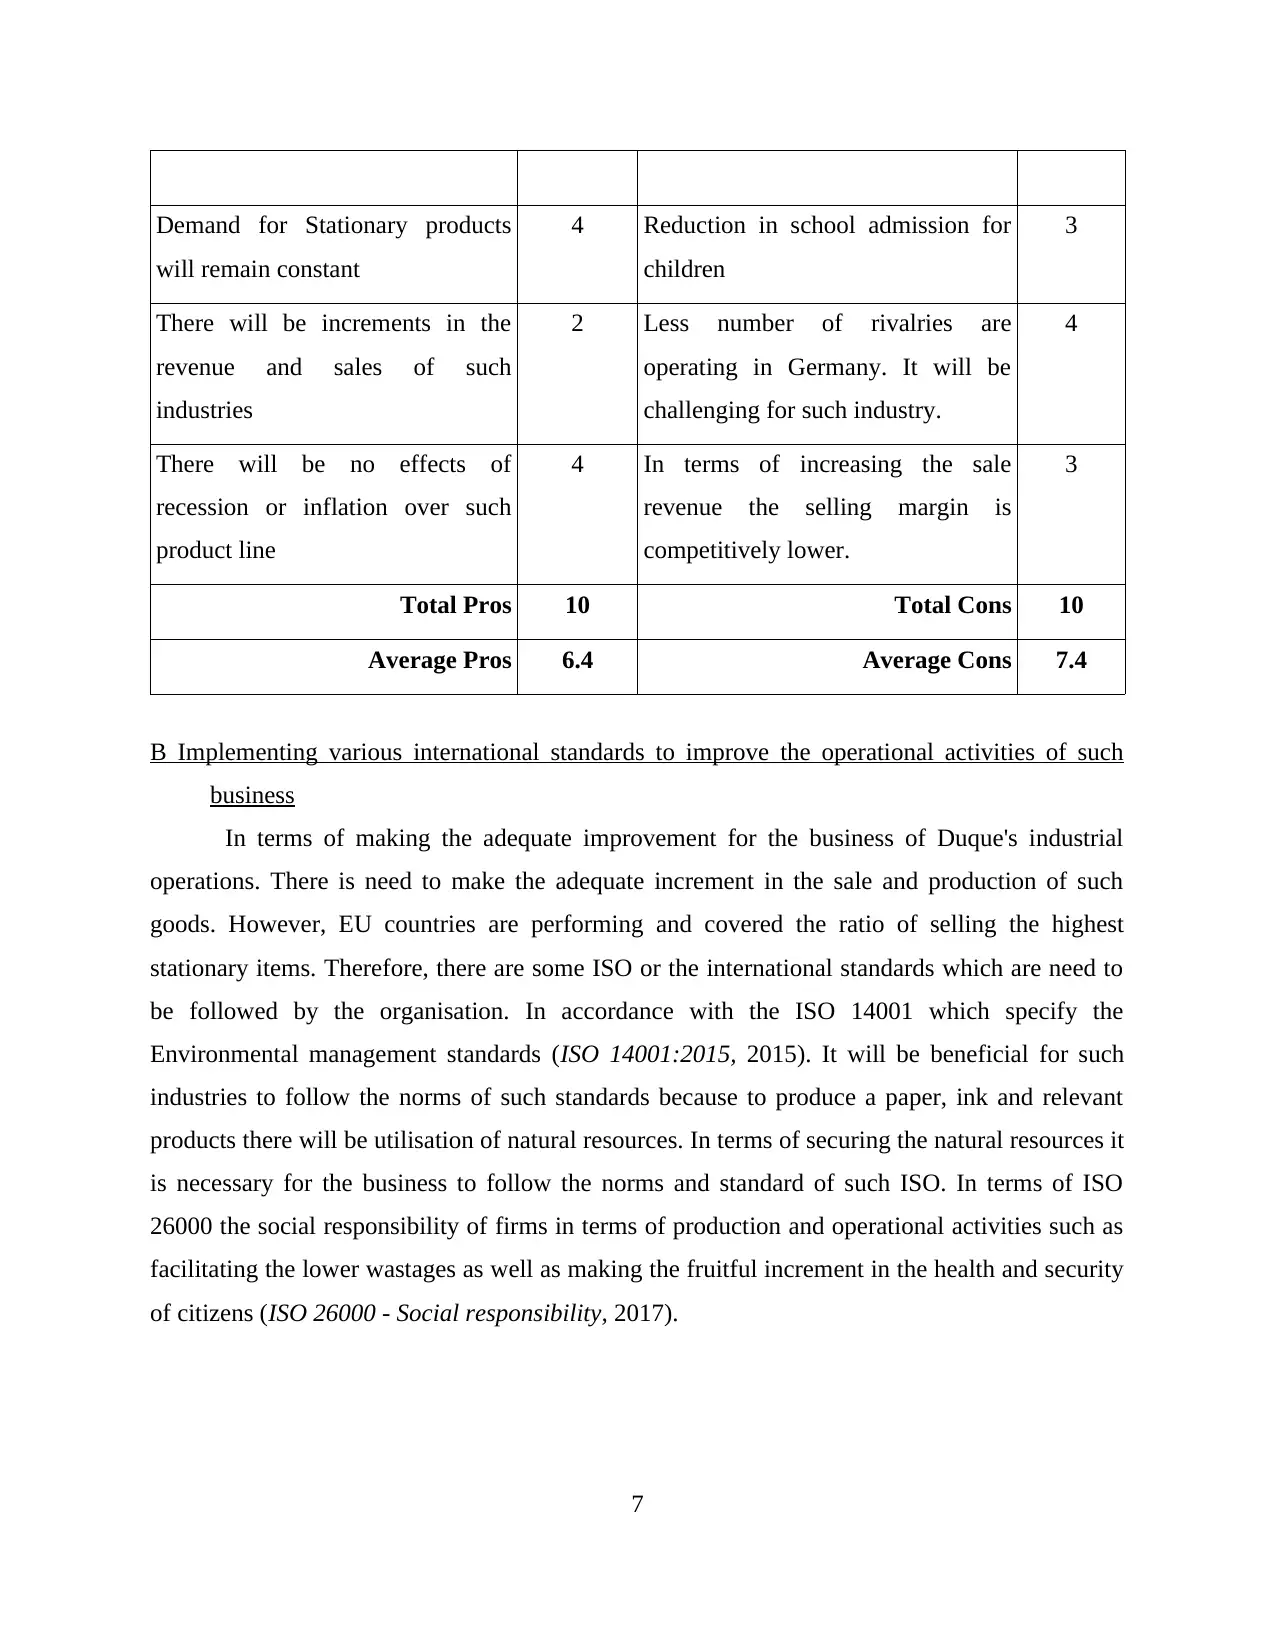
Demand for Stationary products
will remain constant
4 Reduction in school admission for
children
3
There will be increments in the
revenue and sales of such
industries
2 Less number of rivalries are
operating in Germany. It will be
challenging for such industry.
4
There will be no effects of
recession or inflation over such
product line
4 In terms of increasing the sale
revenue the selling margin is
competitively lower.
3
Total Pros 10 Total Cons 10
Average Pros 6.4 Average Cons 7.4
B Implementing various international standards to improve the operational activities of such
business
In terms of making the adequate improvement for the business of Duque's industrial
operations. There is need to make the adequate increment in the sale and production of such
goods. However, EU countries are performing and covered the ratio of selling the highest
stationary items. Therefore, there are some ISO or the international standards which are need to
be followed by the organisation. In accordance with the ISO 14001 which specify the
Environmental management standards (ISO 14001:2015, 2015). It will be beneficial for such
industries to follow the norms of such standards because to produce a paper, ink and relevant
products there will be utilisation of natural resources. In terms of securing the natural resources it
is necessary for the business to follow the norms and standard of such ISO. In terms of ISO
26000 the social responsibility of firms in terms of production and operational activities such as
facilitating the lower wastages as well as making the fruitful increment in the health and security
of citizens (ISO 26000 - Social responsibility, 2017).
7
⊘ This is a preview!⊘
Do you want full access?
Subscribe today to unlock all pages.
Trusted by 1+ million students worldwide
TASK 5
A Measuring the monthly costs of repayment
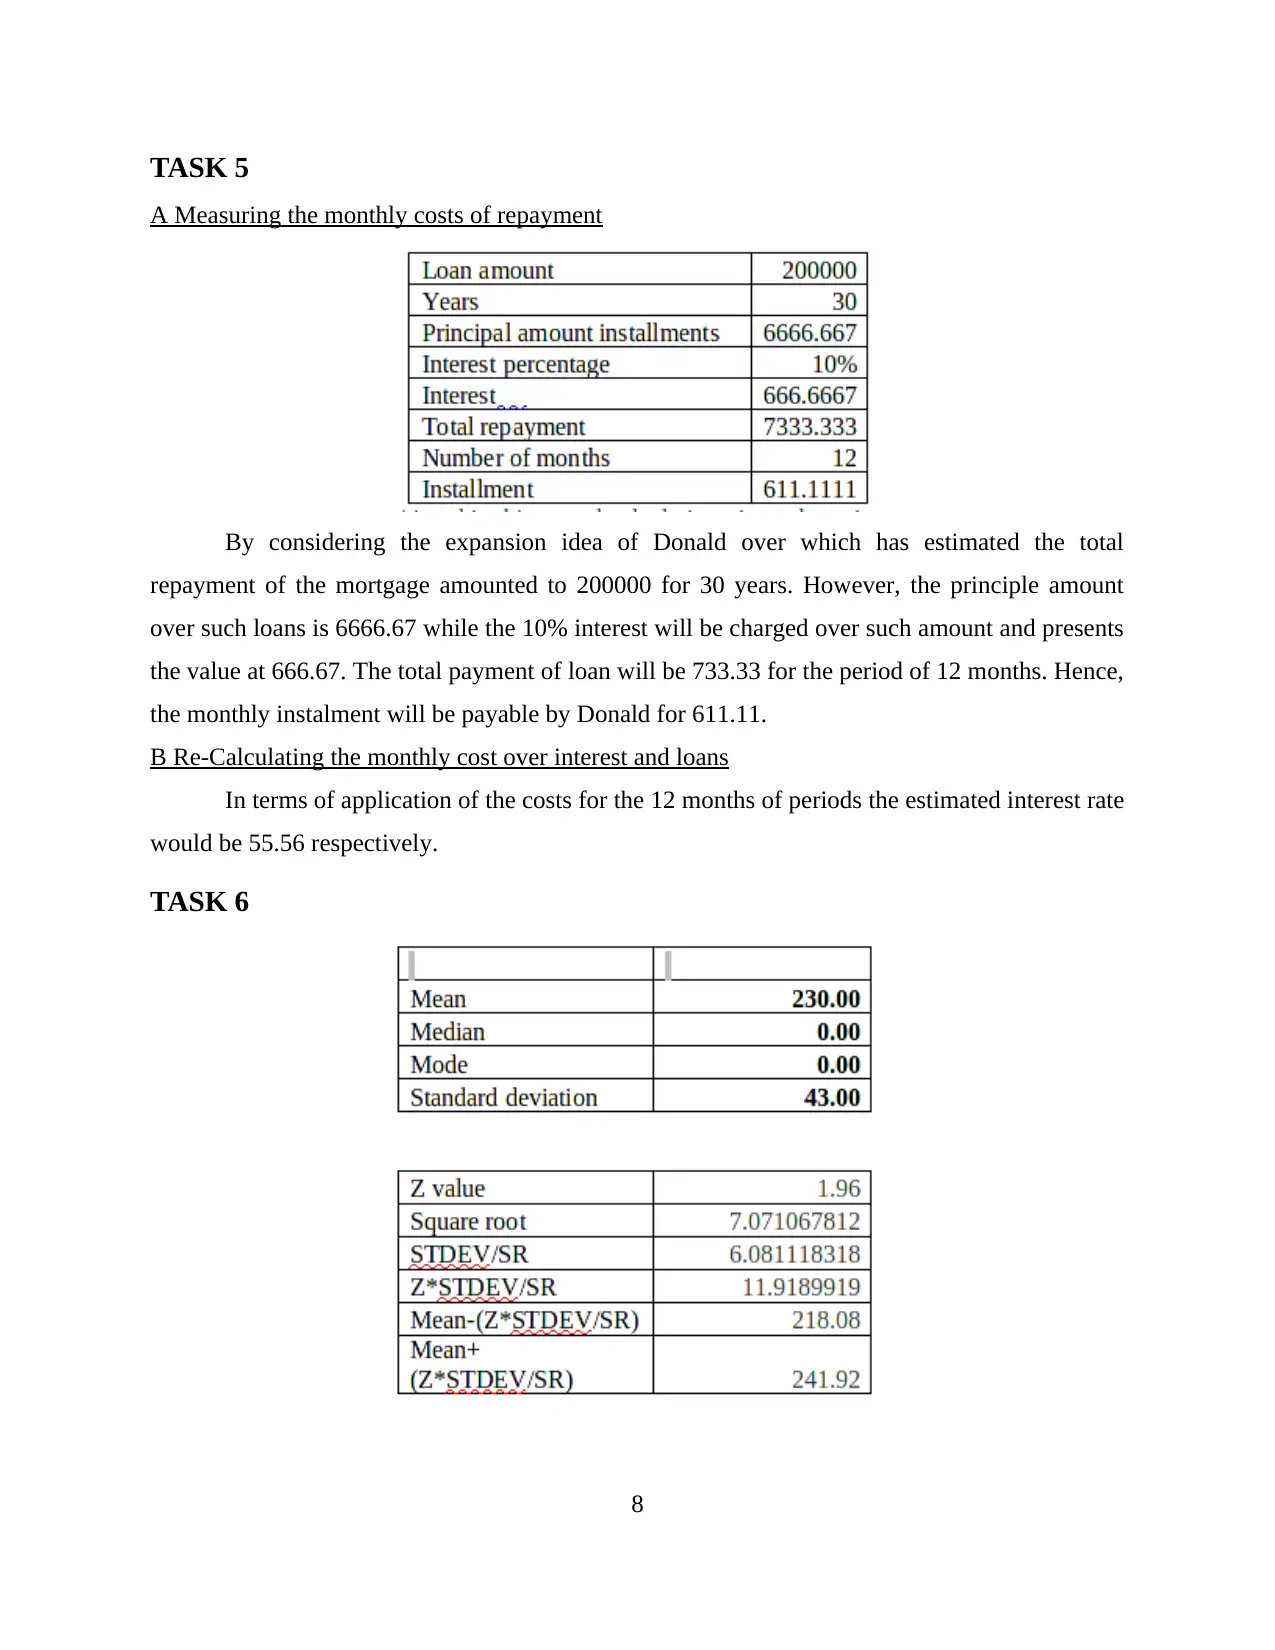
By considering the expansion idea of Donald over which has estimated the total
repayment of the mortgage amounted to 200000 for 30 years. However, the principle amount
over such loans is 6666.67 while the 10% interest will be charged over such amount and presents
the value at 666.67. The total payment of loan will be 733.33 for the period of 12 months. Hence,
the monthly instalment will be payable by Donald for 611.11.
B Re-Calculating the monthly cost over interest and loans
In terms of application of the costs for the 12 months of periods the estimated interest rate
would be 55.56 respectively.
TASK 6
8
A Measuring the monthly costs of repayment
By considering the expansion idea of Donald over which has estimated the total
repayment of the mortgage amounted to 200000 for 30 years. However, the principle amount
over such loans is 6666.67 while the 10% interest will be charged over such amount and presents
the value at 666.67. The total payment of loan will be 733.33 for the period of 12 months. Hence,
the monthly instalment will be payable by Donald for 611.11.
B Re-Calculating the monthly cost over interest and loans
In terms of application of the costs for the 12 months of periods the estimated interest rate
would be 55.56 respectively.
TASK 6
8
Paraphrase This Document
Need a fresh take? Get an instant paraphrase of this document with our AI Paraphraser
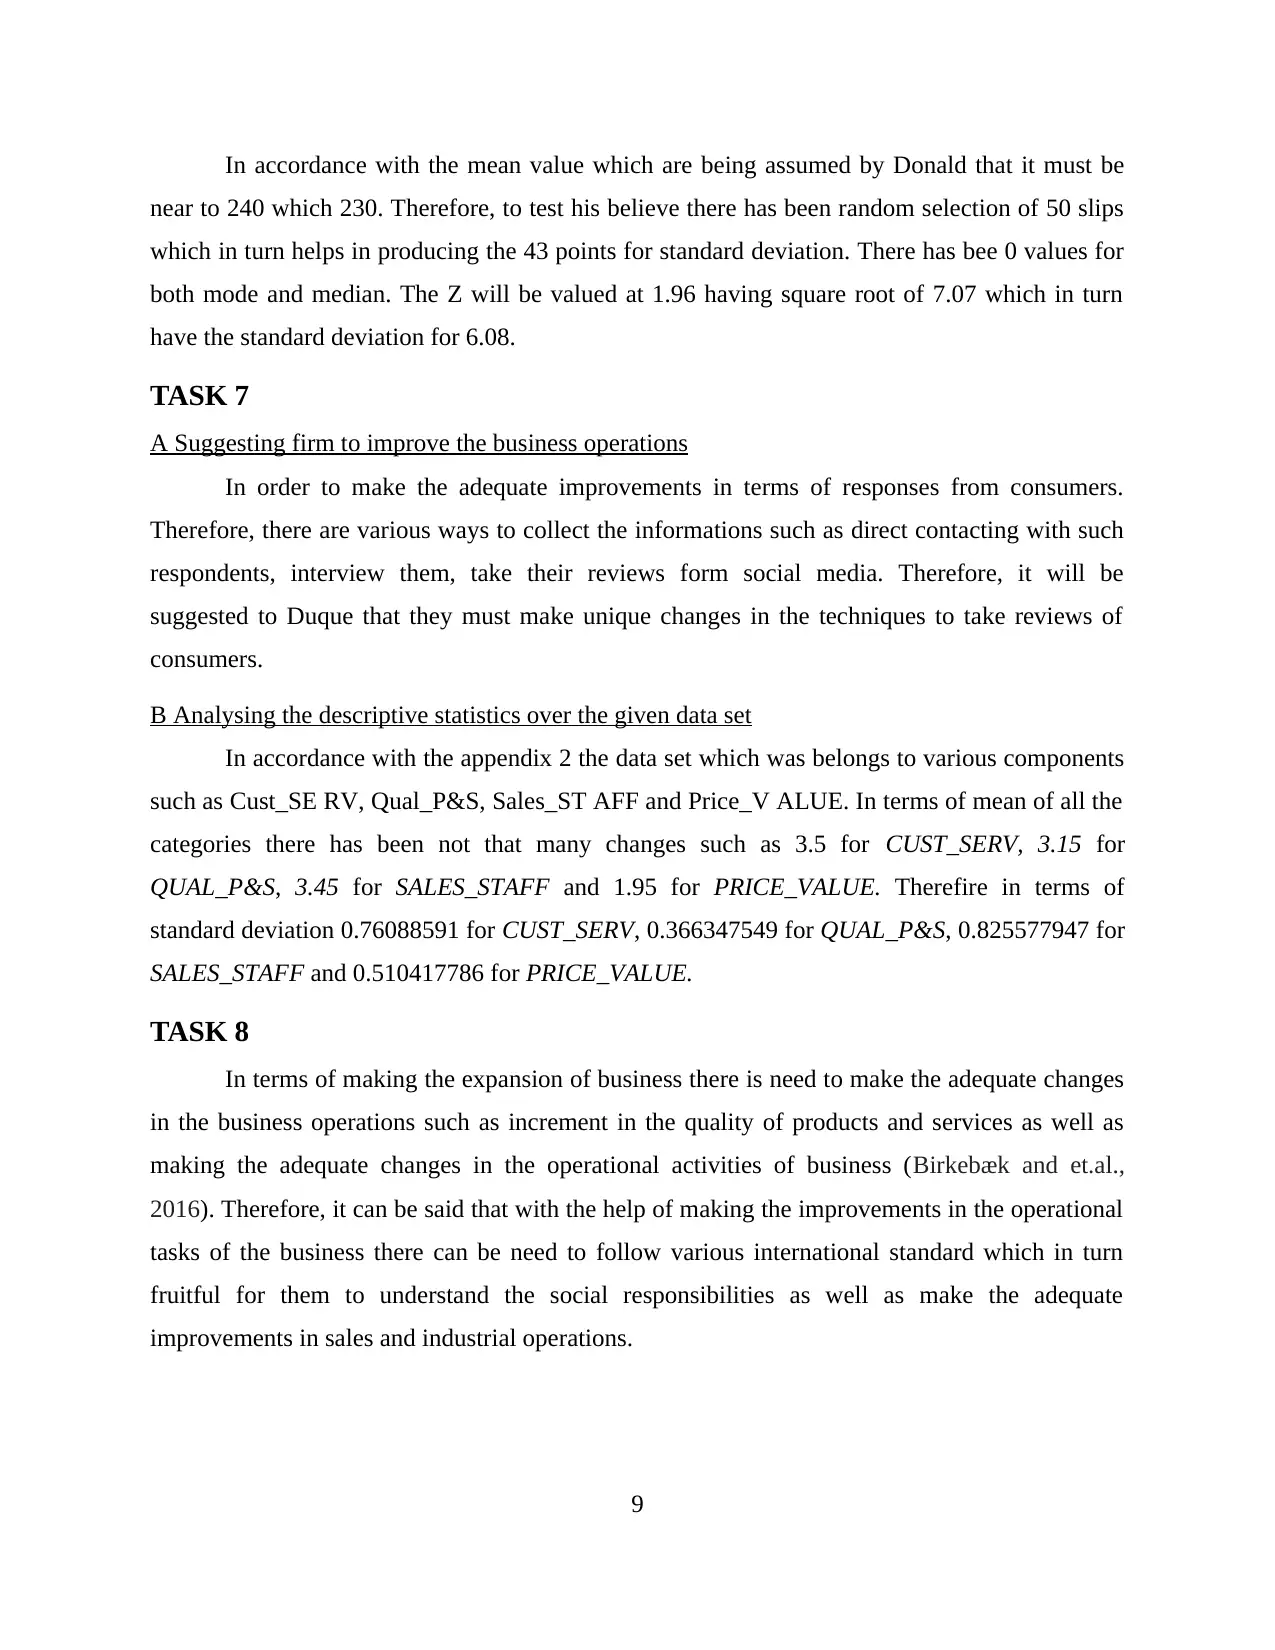
In accordance with the mean value which are being assumed by Donald that it must be
near to 240 which 230. Therefore, to test his believe there has been random selection of 50 slips
which in turn helps in producing the 43 points for standard deviation. There has bee 0 values for
both mode and median. The Z will be valued at 1.96 having square root of 7.07 which in turn
have the standard deviation for 6.08.
TASK 7
A Suggesting firm to improve the business operations
In order to make the adequate improvements in terms of responses from consumers.
Therefore, there are various ways to collect the informations such as direct contacting with such
respondents, interview them, take their reviews form social media. Therefore, it will be
suggested to Duque that they must make unique changes in the techniques to take reviews of
consumers.
B Analysing the descriptive statistics over the given data set
In accordance with the appendix 2 the data set which was belongs to various components
such as Cust_SE RV, Qual_P&S, Sales_ST AFF and Price_V ALUE. In terms of mean of all the
categories there has been not that many changes such as 3.5 for CUST_SERV, 3.15 for
QUAL_P&S, 3.45 for SALES_STAFF and 1.95 for PRICE_VALUE. Therefire in terms of
standard deviation 0.76088591 for CUST_SERV, 0.366347549 for QUAL_P&S, 0.825577947 for
SALES_STAFF and 0.510417786 for PRICE_VALUE.
TASK 8
In terms of making the expansion of business there is need to make the adequate changes
in the business operations such as increment in the quality of products and services as well as
making the adequate changes in the operational activities of business (Birkebæk and et.al.,
2016). Therefore, it can be said that with the help of making the improvements in the operational
tasks of the business there can be need to follow various international standard which in turn
fruitful for them to understand the social responsibilities as well as make the adequate
improvements in sales and industrial operations.
9

10
⊘ This is a preview!⊘
Do you want full access?
Subscribe today to unlock all pages.
Trusted by 1+ million students worldwide
1 out of 14
Related Documents


Your All-in-One AI-Powered Toolkit for Academic Success.
+13062052269
info@desklib.com
Available 24*7 on WhatsApp / Email
![[object Object]](/_next/static/media/star-bottom.7253800d.svg)
Unlock your academic potential
Copyright © 2020–2026 A2Z Services. All Rights Reserved. Developed and managed by ZUCOL.