Business Organization Report
VerifiedAdded on 2019/12/03
|16
|3852
|155
Report
AI Summary
This report analyzes the financial performance of Greggs Plc, a UK bakery chain, and compares it with its competitor, Whitbread Plc. It begins by explaining the purpose of financial statements and the different types prepared by various organizations (sole trader, partnership, public company). A detailed ratio analysis of Greggs Plc's financial statements (2012-2014) is presented, covering profitability, liquidity, efficiency, gearing, and investor ratios. The report interprets these ratios, assessing Greggs's financial health and operational efficiency. A competitor analysis compares Greggs Plc with Whitbread Plc, highlighting key differences in profitability, liquidity, and efficiency. The report concludes with an investment recommendation based on the comparative analysis, suggesting Whitbread Plc as a potentially better investment due to its higher profitability and return on equity. The report includes a table summarizing the key financial ratios for both companies and references the sources used.

Business organization
Paraphrase This Document
Need a fresh take? Get an instant paraphrase of this document with our AI Paraphraser
Table of Contents
INTRODUCTION......................................................................................................................1
TASK 3......................................................................................................................................1
Q. 1. Purpose of financial statements................................................................................1
Q. 2. Different type of organization and their financial statements..................................2
Q.3. Financial statements analysis of Greggs Plc.............................................................3
Q.4. Report........................................................................................................................6
Q. 5. Competitor analysis..................................................................................................7
Q. 6. Conclusion...............................................................................................................8
Q. 7. Presentation..............................................................................................................9
References................................................................................................................................10
INTRODUCTION
Every business prepares its financial accounts in order to identify their financial as
well as operational performance. Different organization prepares distinct type of financial
accounts. In this report we identify the type of financial accounts prepared by the
organizations with their purpose. Moreover, comparative financial statements are also
analysed in context to Greegs Plc. It is the largest bakery chain in the UK established in 1939.
Headquarter of the company is established in Jesmond, Newcastle upon Tyne, United
Kingdom. It produces sandwiches, Pies, pastries and another kind of baked foods for the
consumers. Furthermore, the report discusses the competitor analysis of Greggs Plc with
Whitbread Plc.
TASK 3
Q. 1. Purpose of financial statements
Financial statements: It is prepared to determine the operational and financial results
of every business organizations. It helps to identify the business changes over the years.
Moreover, comparative analysis helps to take effective business decision through mitigate the
negative business impacts.
Accounting terminology: Every transaction has two aspects debit and credit. Debit
transaction indicates the increase in assets and expenses or decrease in liability. However,
credit transaction indicates either increase in liability and income or decrease in assets.
Moreover, balance sheet includes two terminologies that are assets and liability (Taylor,
2010). Assets are such things that are used for future economic benefits to the organization.
However, liabilities are the company's obligation for which payment is required by the
company.
Prime Entry Books: Initially, every business transaction is recorded in books of prime
entry. It is also termed as books of original entry includes sales and purchase book, Return
books, Cash receipts and payment book, petty cash book, bank book and journal.
Accounts and ledgers: Accounts are prepared with debiting and crediting all the
income and expenditures that have taken place in the accounting period. However, ledger is
prepared for all the individual business transaction (Penman and Penman, 2007).
Trial balance: It is prepared to determine the mathematical or arithmetical accuracy
through combining all the ledger account balances. Moreover, it helps in preparing the
business final accounts.
1 | P a g e
⊘ This is a preview!⊘
Do you want full access?
Subscribe today to unlock all pages.
Trusted by 1+ million students worldwide
Final accounts: Two statements are prepared as the final accounts of the every
organization that are income statement and balance sheet.
Particulars Purpose
Income statements Trading Account - It is prepared to
determine the amount of gross profit or gross
loss from its trading operations. It is
calculated by subtracting cost of goods sold
from net sales.
Profit and loss Account – It is prepared to
determine the net results through deducting
the gross profit plus indirect incomes to total
indirect expenses.
Balance sheet It is prepared to determine the financial
position of the organization (Benninga,
2008). Business can identify their financial
strengths and weakness through this
statement.
Q. 2. Different type of organization and their financial statements
Greggs Plc: It is a public company hence prepares income statements and balance
sheet as final accounts so as to know their profits and financial status. Moreover, retained
earnings statements, cash flow statement and fund flow statements are also prepared by the
company in order to determine respective changes. It prepares its statements according to the
act requirement. Further, consolidated financial statements are also prepared by the company
through combining all the Subsidiary operations.
Sole trader: In this type of business only a single person establishes the business
organization. Therefore, all the money is invested by themselves and bear all the profits as
well as losses. It prepares its financial statements according to their own requirements. All
trading, profit and loss account and balance sheet is prepared by the entrepreneur (Schroeder,
Clark and Cathey, 2011). The statements help to determine their profits or loss situation.
Income statement: It includes trading and profit and loss account. Trading account is
prepared to ascertain the gross profit or loss. The amount of net profit or net loss is
ascertained through profit and loss account.
2 | P a g e
Paraphrase This Document
Need a fresh take? Get an instant paraphrase of this document with our AI Paraphraser
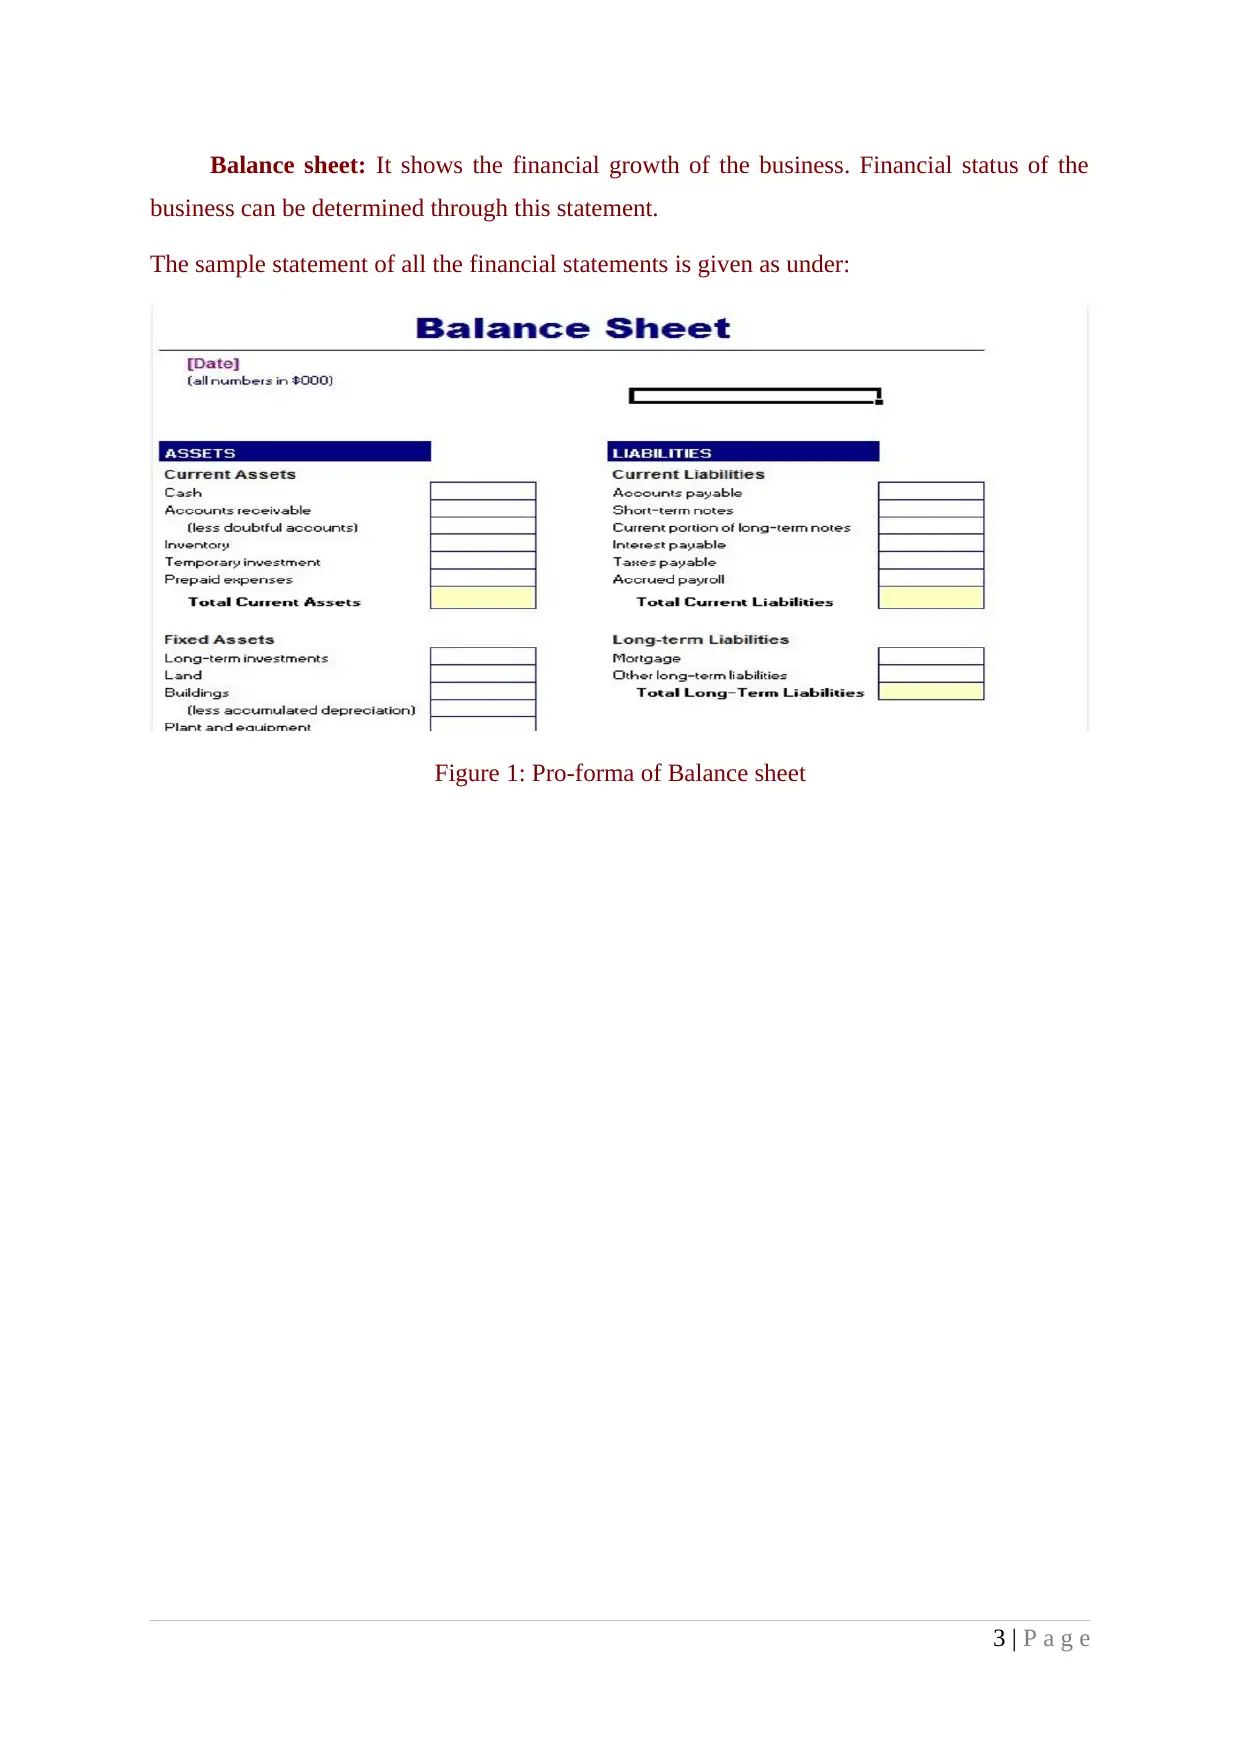
Balance sheet: It shows the financial growth of the business. Financial status of the
business can be determined through this statement.
The sample statement of all the financial statements is given as under:
Figure 1: Pro-forma of Balance sheet
3 | P a g e
business can be determined through this statement.
The sample statement of all the financial statements is given as under:
Figure 1: Pro-forma of Balance sheet
3 | P a g e
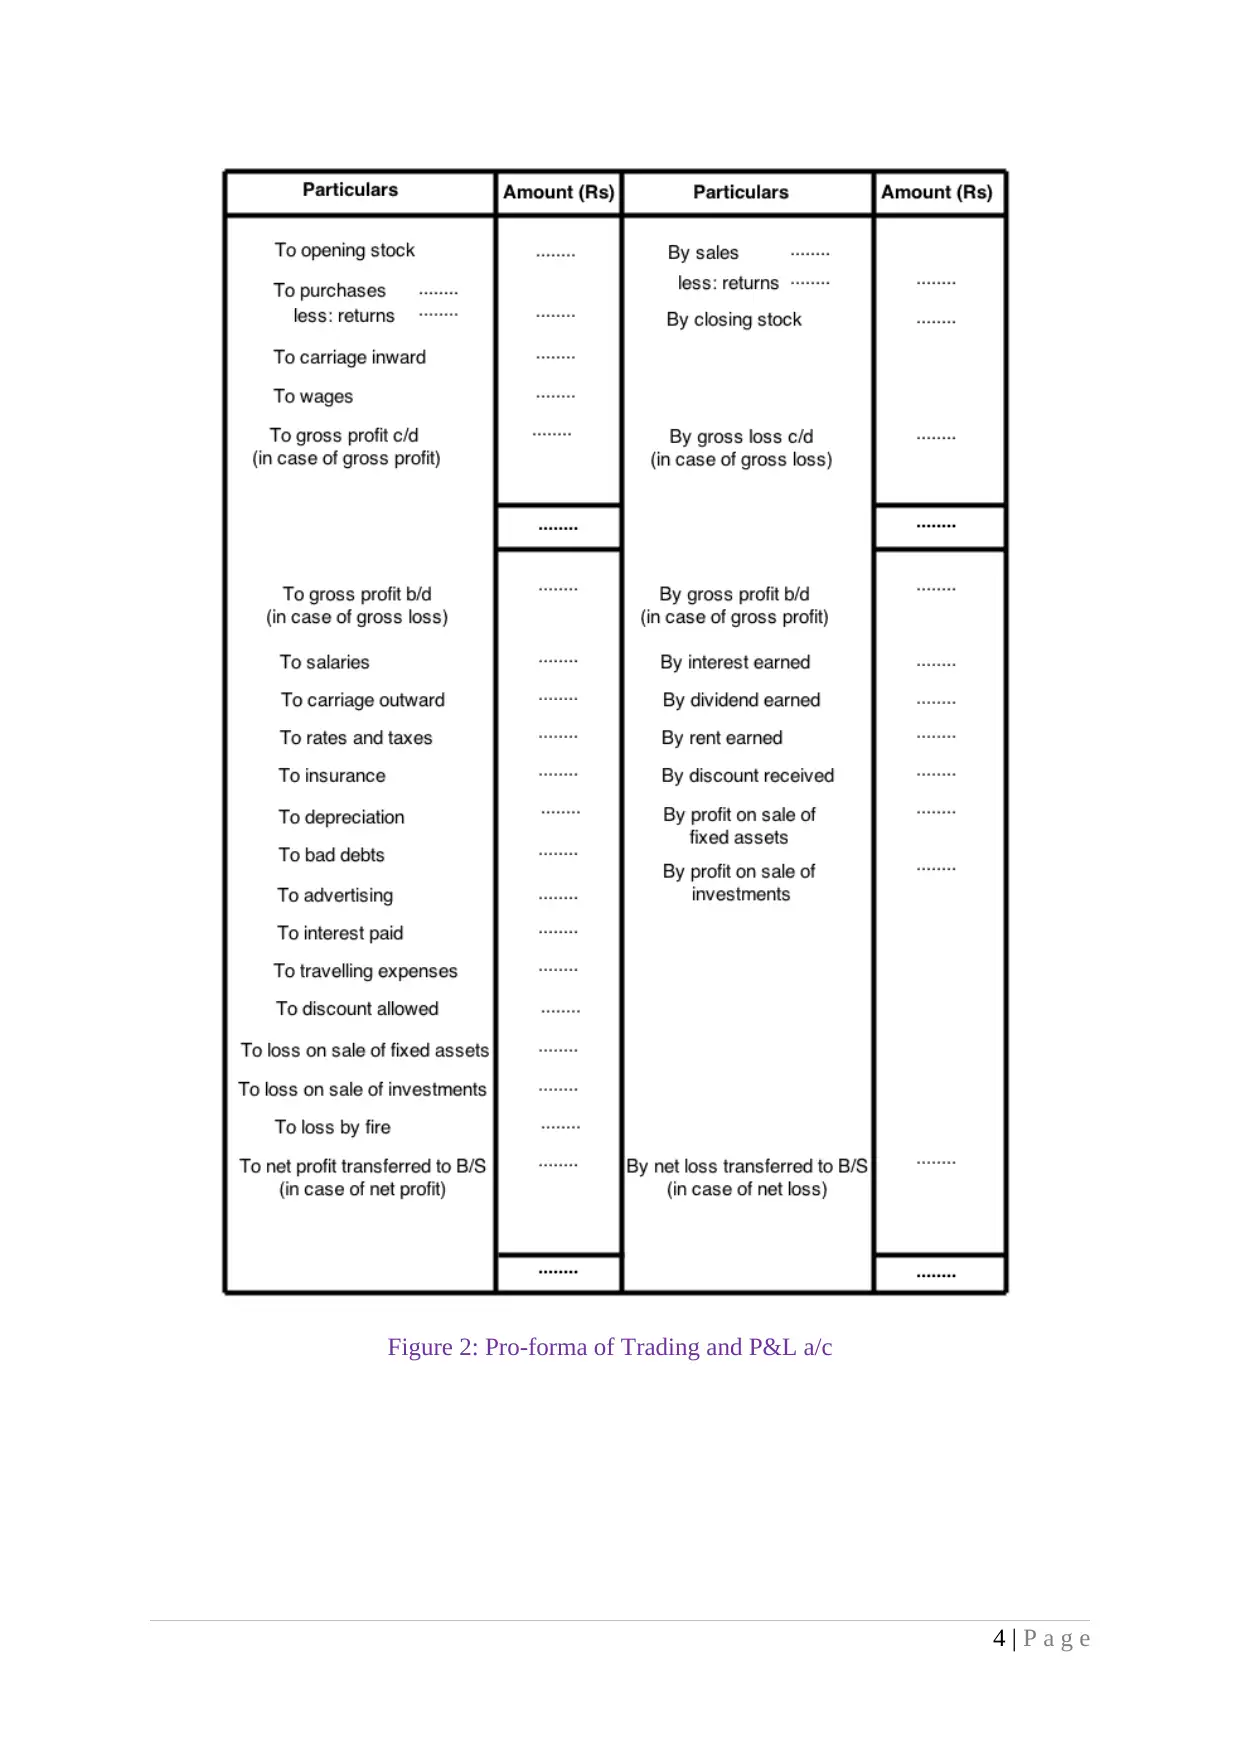
Figure 2: Pro-forma of Trading and P&L a/c
4 | P a g e
4 | P a g e
⊘ This is a preview!⊘
Do you want full access?
Subscribe today to unlock all pages.
Trusted by 1+ million students worldwide
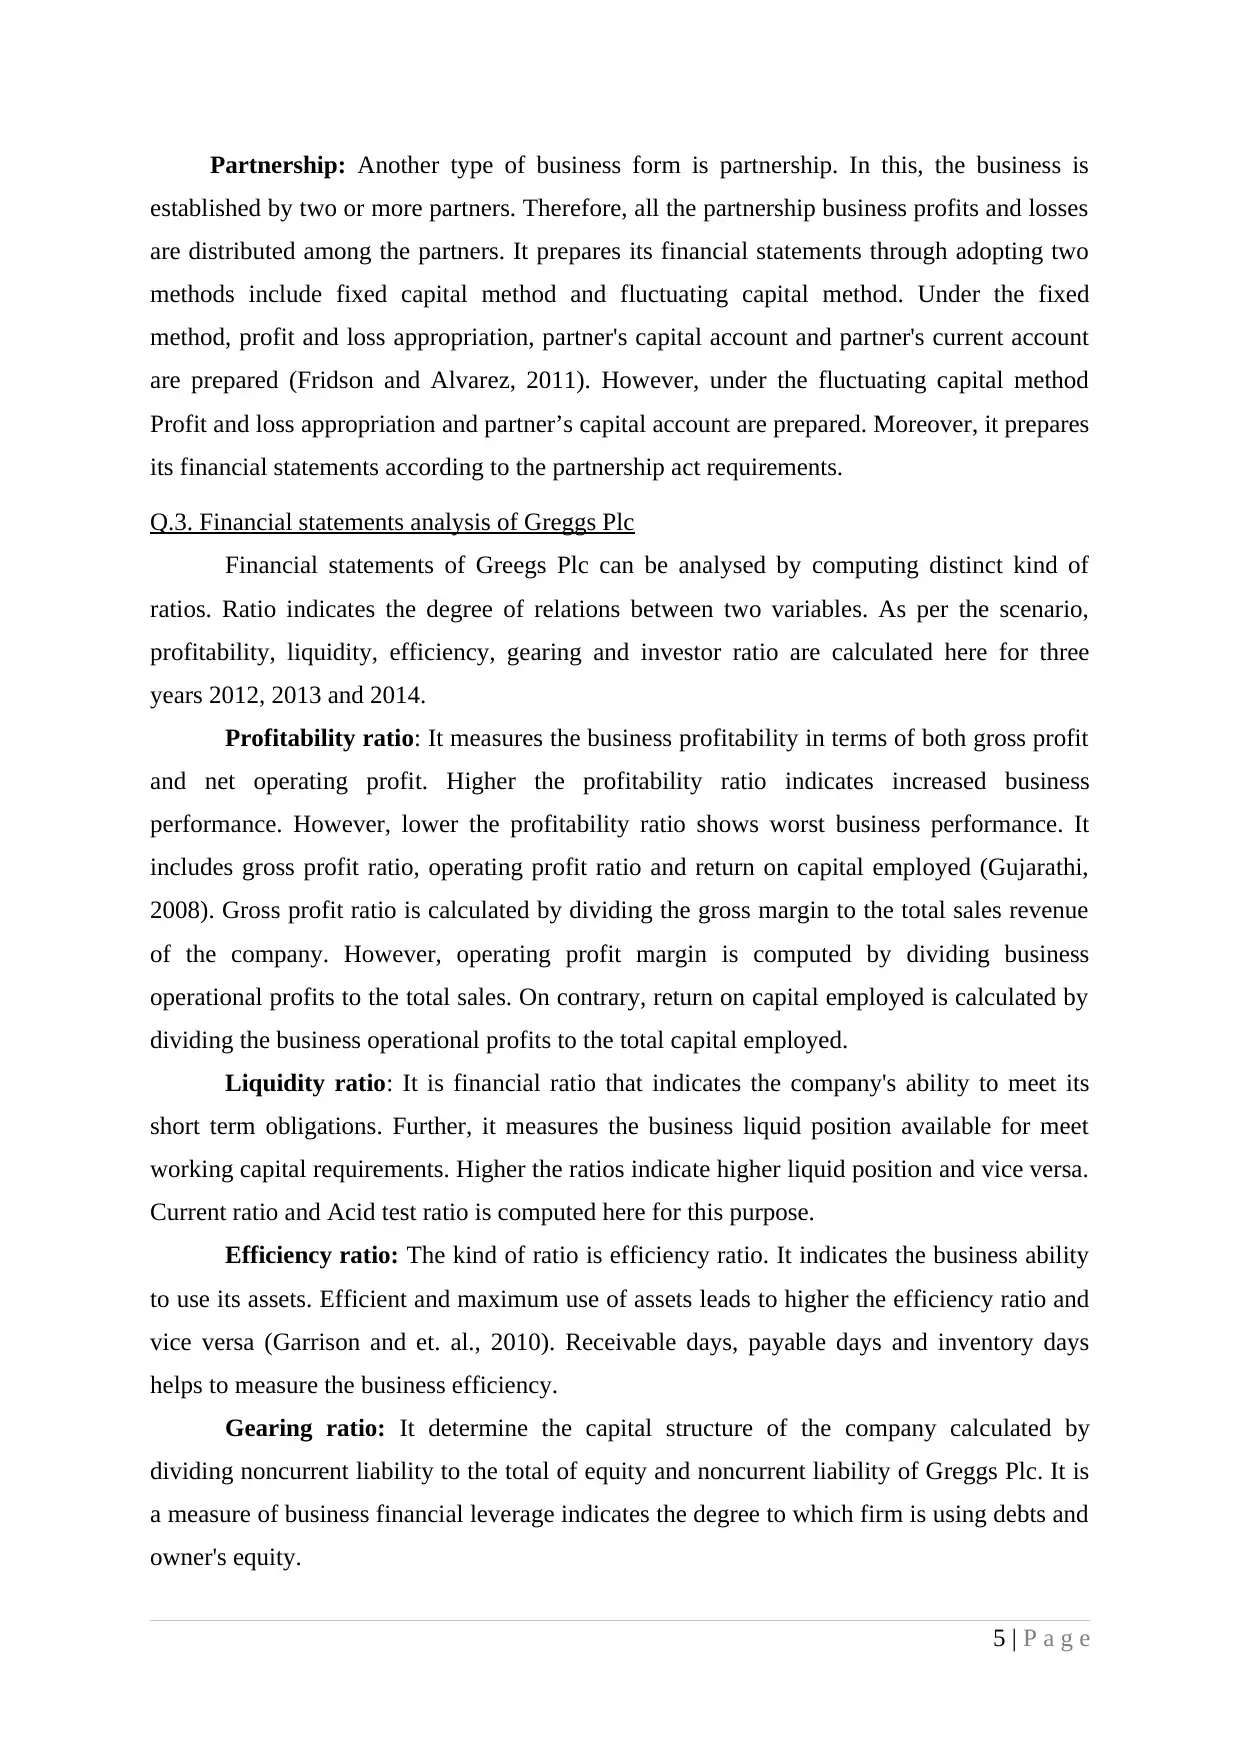
Partnership: Another type of business form is partnership. In this, the business is
established by two or more partners. Therefore, all the partnership business profits and losses
are distributed among the partners. It prepares its financial statements through adopting two
methods include fixed capital method and fluctuating capital method. Under the fixed
method, profit and loss appropriation, partner's capital account and partner's current account
are prepared (Fridson and Alvarez, 2011). However, under the fluctuating capital method
Profit and loss appropriation and partner’s capital account are prepared. Moreover, it prepares
its financial statements according to the partnership act requirements.
Q.3. Financial statements analysis of Greggs Plc
Financial statements of Greegs Plc can be analysed by computing distinct kind of
ratios. Ratio indicates the degree of relations between two variables. As per the scenario,
profitability, liquidity, efficiency, gearing and investor ratio are calculated here for three
years 2012, 2013 and 2014.
Profitability ratio: It measures the business profitability in terms of both gross profit
and net operating profit. Higher the profitability ratio indicates increased business
performance. However, lower the profitability ratio shows worst business performance. It
includes gross profit ratio, operating profit ratio and return on capital employed (Gujarathi,
2008). Gross profit ratio is calculated by dividing the gross margin to the total sales revenue
of the company. However, operating profit margin is computed by dividing business
operational profits to the total sales. On contrary, return on capital employed is calculated by
dividing the business operational profits to the total capital employed.
Liquidity ratio: It is financial ratio that indicates the company's ability to meet its
short term obligations. Further, it measures the business liquid position available for meet
working capital requirements. Higher the ratios indicate higher liquid position and vice versa.
Current ratio and Acid test ratio is computed here for this purpose.
Efficiency ratio: The kind of ratio is efficiency ratio. It indicates the business ability
to use its assets. Efficient and maximum use of assets leads to higher the efficiency ratio and
vice versa (Garrison and et. al., 2010). Receivable days, payable days and inventory days
helps to measure the business efficiency.
Gearing ratio: It determine the capital structure of the company calculated by
dividing noncurrent liability to the total of equity and noncurrent liability of Greggs Plc. It is
a measure of business financial leverage indicates the degree to which firm is using debts and
owner's equity.
5 | P a g e
Paraphrase This Document
Need a fresh take? Get an instant paraphrase of this document with our AI Paraphraser
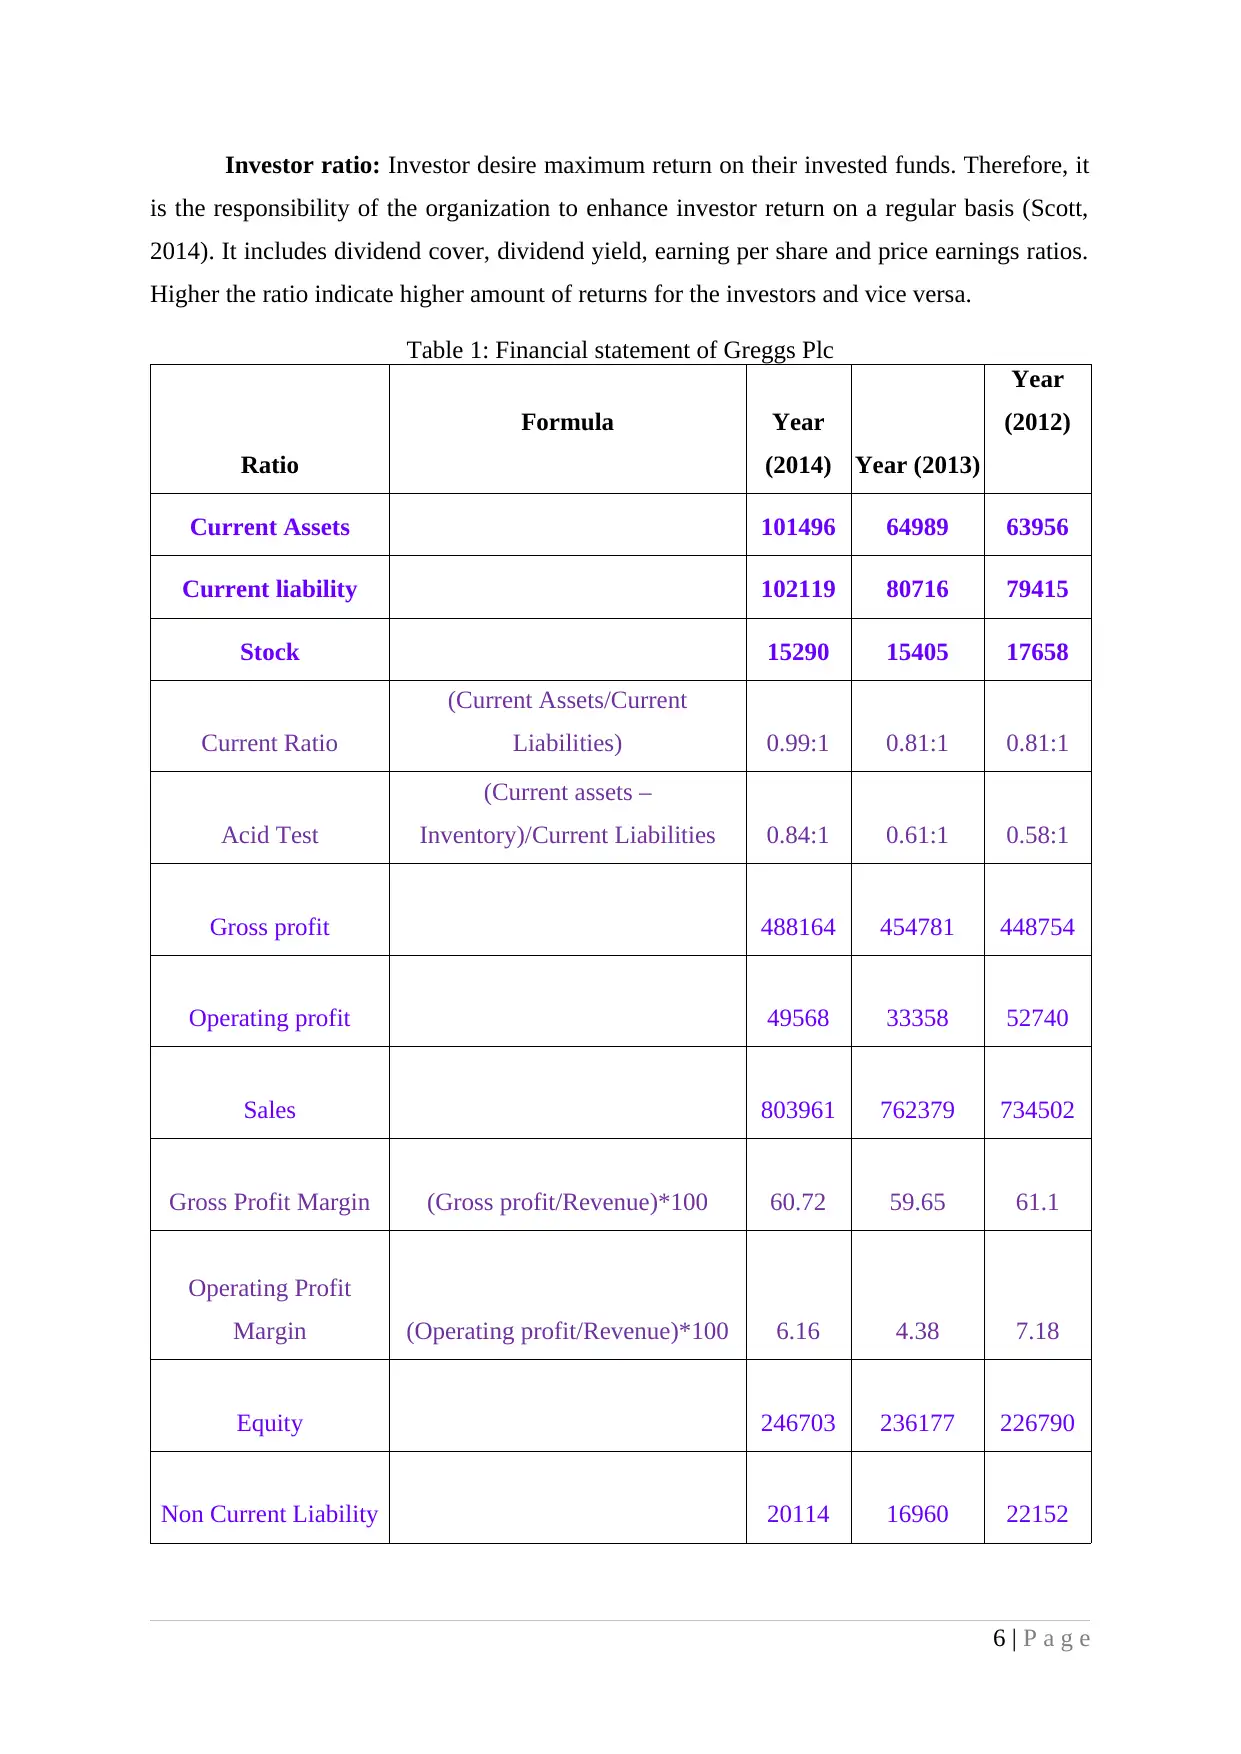
Investor ratio: Investor desire maximum return on their invested funds. Therefore, it
is the responsibility of the organization to enhance investor return on a regular basis (Scott,
2014). It includes dividend cover, dividend yield, earning per share and price earnings ratios.
Higher the ratio indicate higher amount of returns for the investors and vice versa.
Table 1: Financial statement of Greggs Plc
Ratio
Formula Year
(2014) Year (2013)
Year
(2012)
Current Assets 101496 64989 63956
Current liability 102119 80716 79415
Stock 15290 15405 17658
Current Ratio
(Current Assets/Current
Liabilities) 0.99:1 0.81:1 0.81:1
Acid Test
(Current assets –
Inventory)/Current Liabilities 0.84:1 0.61:1 0.58:1
Gross profit 488164 454781 448754
Operating profit 49568 33358 52740
Sales 803961 762379 734502
Gross Profit Margin (Gross profit/Revenue)*100 60.72 59.65 61.1
Operating Profit
Margin (Operating profit/Revenue)*100 6.16 4.38 7.18
Equity 246703 236177 226790
Non Current Liability 20114 16960 22152
6 | P a g e
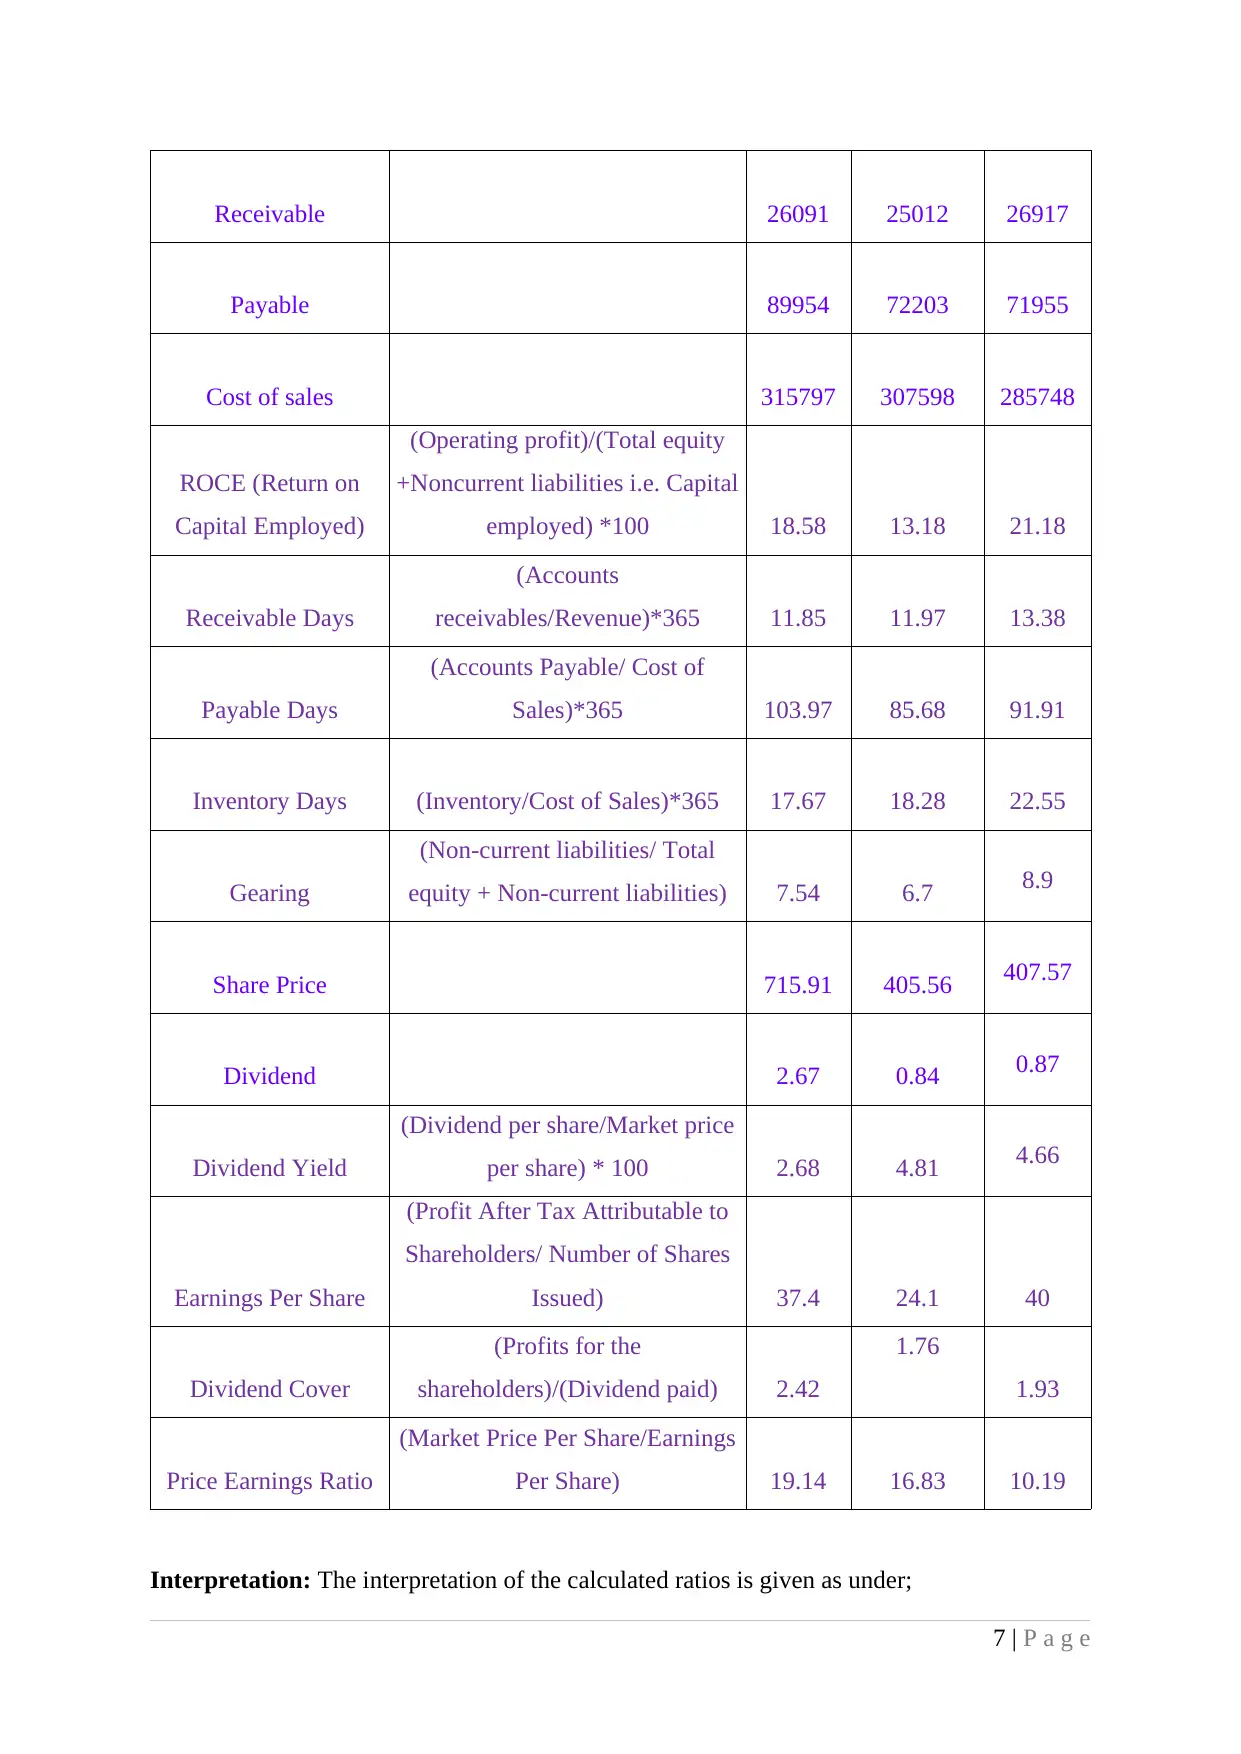
Receivable 26091 25012 26917
Payable 89954 72203 71955
Cost of sales 315797 307598 285748
ROCE (Return on
Capital Employed)
(Operating profit)/(Total equity
+Noncurrent liabilities i.e. Capital
employed) *100 18.58 13.18 21.18
Receivable Days
(Accounts
receivables/Revenue)*365 11.85 11.97 13.38
Payable Days
(Accounts Payable/ Cost of
Sales)*365 103.97 85.68 91.91
Inventory Days (Inventory/Cost of Sales)*365 17.67 18.28 22.55
Gearing
(Non-current liabilities/ Total
equity + Non-current liabilities) 7.54 6.7 8.9
Share Price 715.91 405.56 407.57
Dividend 2.67 0.84 0.87
Dividend Yield
(Dividend per share/Market price
per share) * 100 2.68 4.81 4.66
Earnings Per Share
(Profit After Tax Attributable to
Shareholders/ Number of Shares
Issued) 37.4 24.1 40
Dividend Cover
(Profits for the
shareholders)/(Dividend paid) 2.42
1.76
1.93
Price Earnings Ratio
(Market Price Per Share/Earnings
Per Share) 19.14 16.83 10.19
Interpretation: The interpretation of the calculated ratios is given as under;
7 | P a g e
⊘ This is a preview!⊘
Do you want full access?
Subscribe today to unlock all pages.
Trusted by 1+ million students worldwide
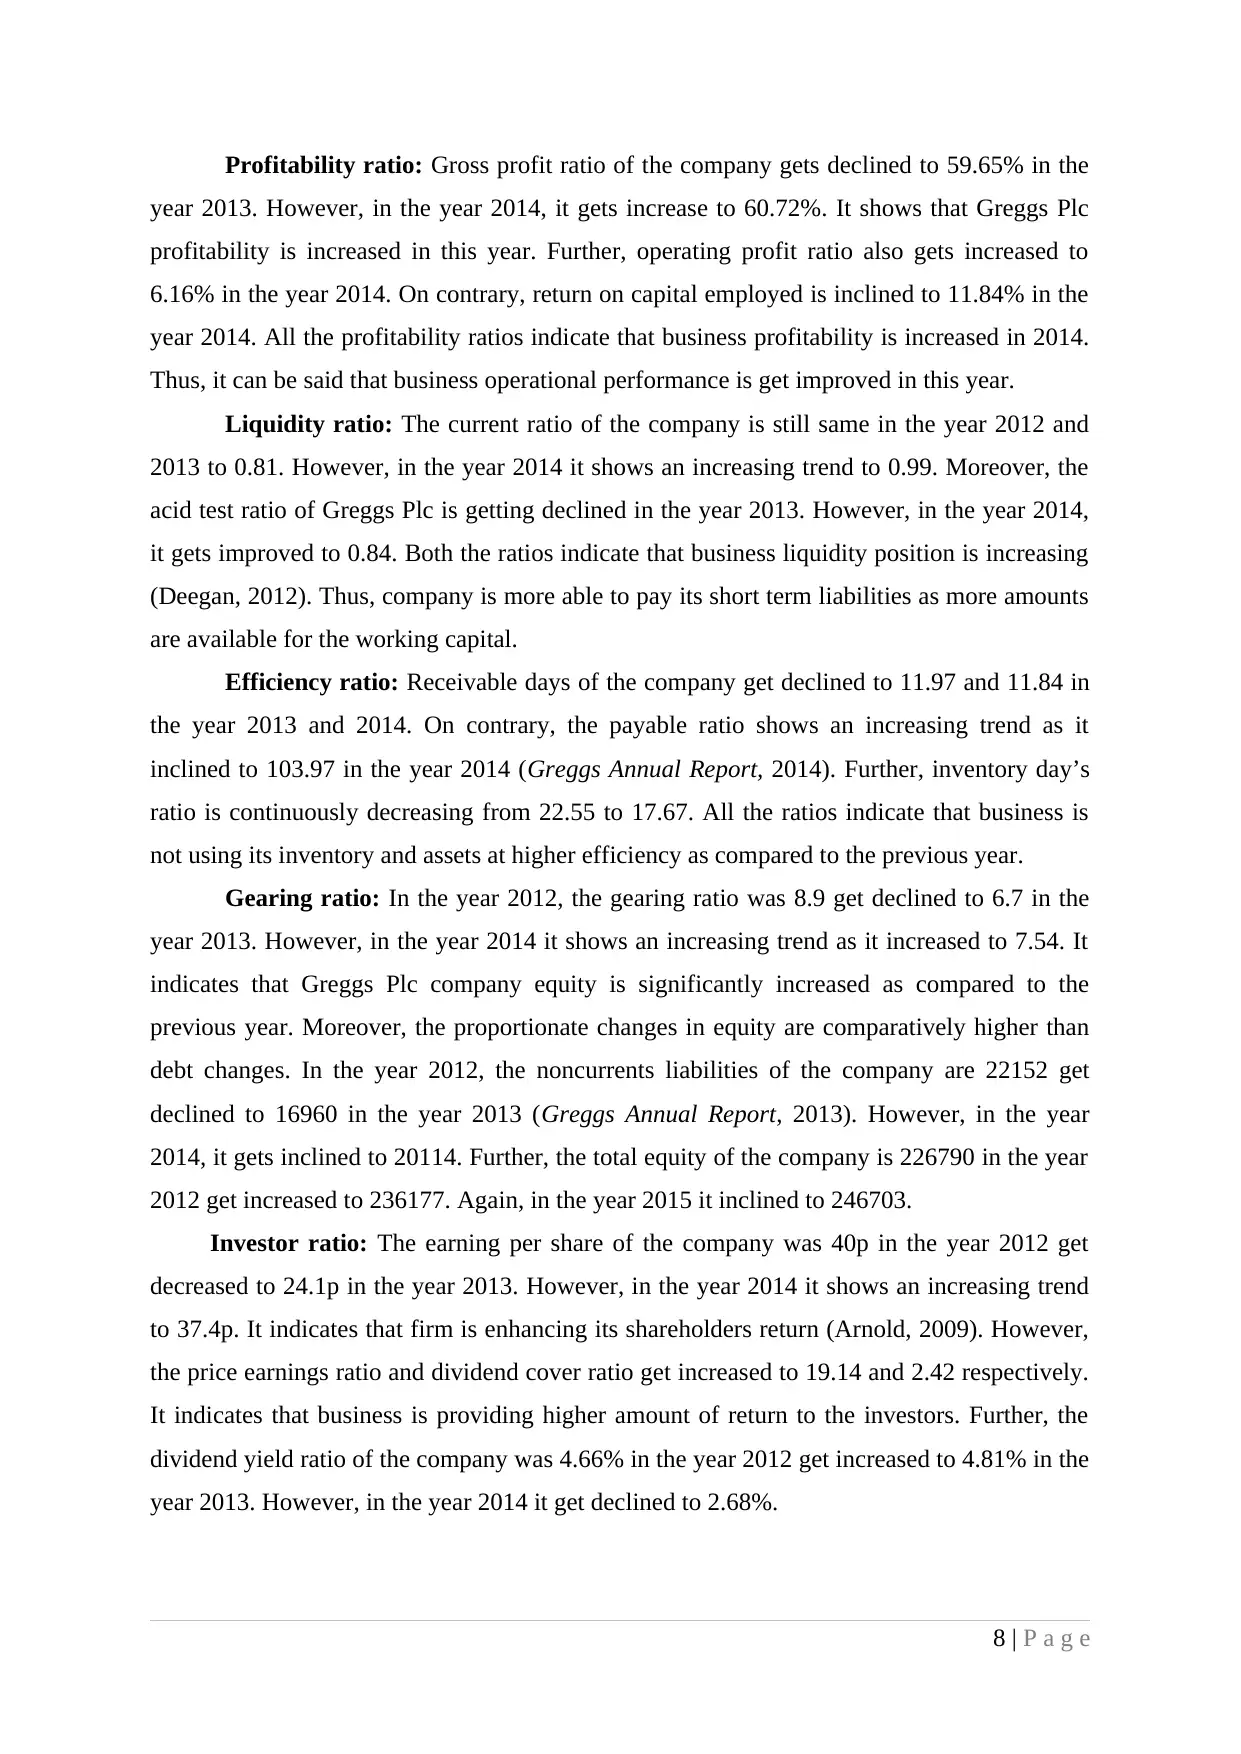
Profitability ratio: Gross profit ratio of the company gets declined to 59.65% in the
year 2013. However, in the year 2014, it gets increase to 60.72%. It shows that Greggs Plc
profitability is increased in this year. Further, operating profit ratio also gets increased to
6.16% in the year 2014. On contrary, return on capital employed is inclined to 11.84% in the
year 2014. All the profitability ratios indicate that business profitability is increased in 2014.
Thus, it can be said that business operational performance is get improved in this year.
Liquidity ratio: The current ratio of the company is still same in the year 2012 and
2013 to 0.81. However, in the year 2014 it shows an increasing trend to 0.99. Moreover, the
acid test ratio of Greggs Plc is getting declined in the year 2013. However, in the year 2014,
it gets improved to 0.84. Both the ratios indicate that business liquidity position is increasing
(Deegan, 2012). Thus, company is more able to pay its short term liabilities as more amounts
are available for the working capital.
Efficiency ratio: Receivable days of the company get declined to 11.97 and 11.84 in
the year 2013 and 2014. On contrary, the payable ratio shows an increasing trend as it
inclined to 103.97 in the year 2014 (Greggs Annual Report, 2014). Further, inventory day’s
ratio is continuously decreasing from 22.55 to 17.67. All the ratios indicate that business is
not using its inventory and assets at higher efficiency as compared to the previous year.
Gearing ratio: In the year 2012, the gearing ratio was 8.9 get declined to 6.7 in the
year 2013. However, in the year 2014 it shows an increasing trend as it increased to 7.54. It
indicates that Greggs Plc company equity is significantly increased as compared to the
previous year. Moreover, the proportionate changes in equity are comparatively higher than
debt changes. In the year 2012, the noncurrents liabilities of the company are 22152 get
declined to 16960 in the year 2013 (Greggs Annual Report, 2013). However, in the year
2014, it gets inclined to 20114. Further, the total equity of the company is 226790 in the year
2012 get increased to 236177. Again, in the year 2015 it inclined to 246703.
Investor ratio: The earning per share of the company was 40p in the year 2012 get
decreased to 24.1p in the year 2013. However, in the year 2014 it shows an increasing trend
to 37.4p. It indicates that firm is enhancing its shareholders return (Arnold, 2009). However,
the price earnings ratio and dividend cover ratio get increased to 19.14 and 2.42 respectively.
It indicates that business is providing higher amount of return to the investors. Further, the
dividend yield ratio of the company was 4.66% in the year 2012 get increased to 4.81% in the
year 2013. However, in the year 2014 it get declined to 2.68%.
8 | P a g e
Paraphrase This Document
Need a fresh take? Get an instant paraphrase of this document with our AI Paraphraser
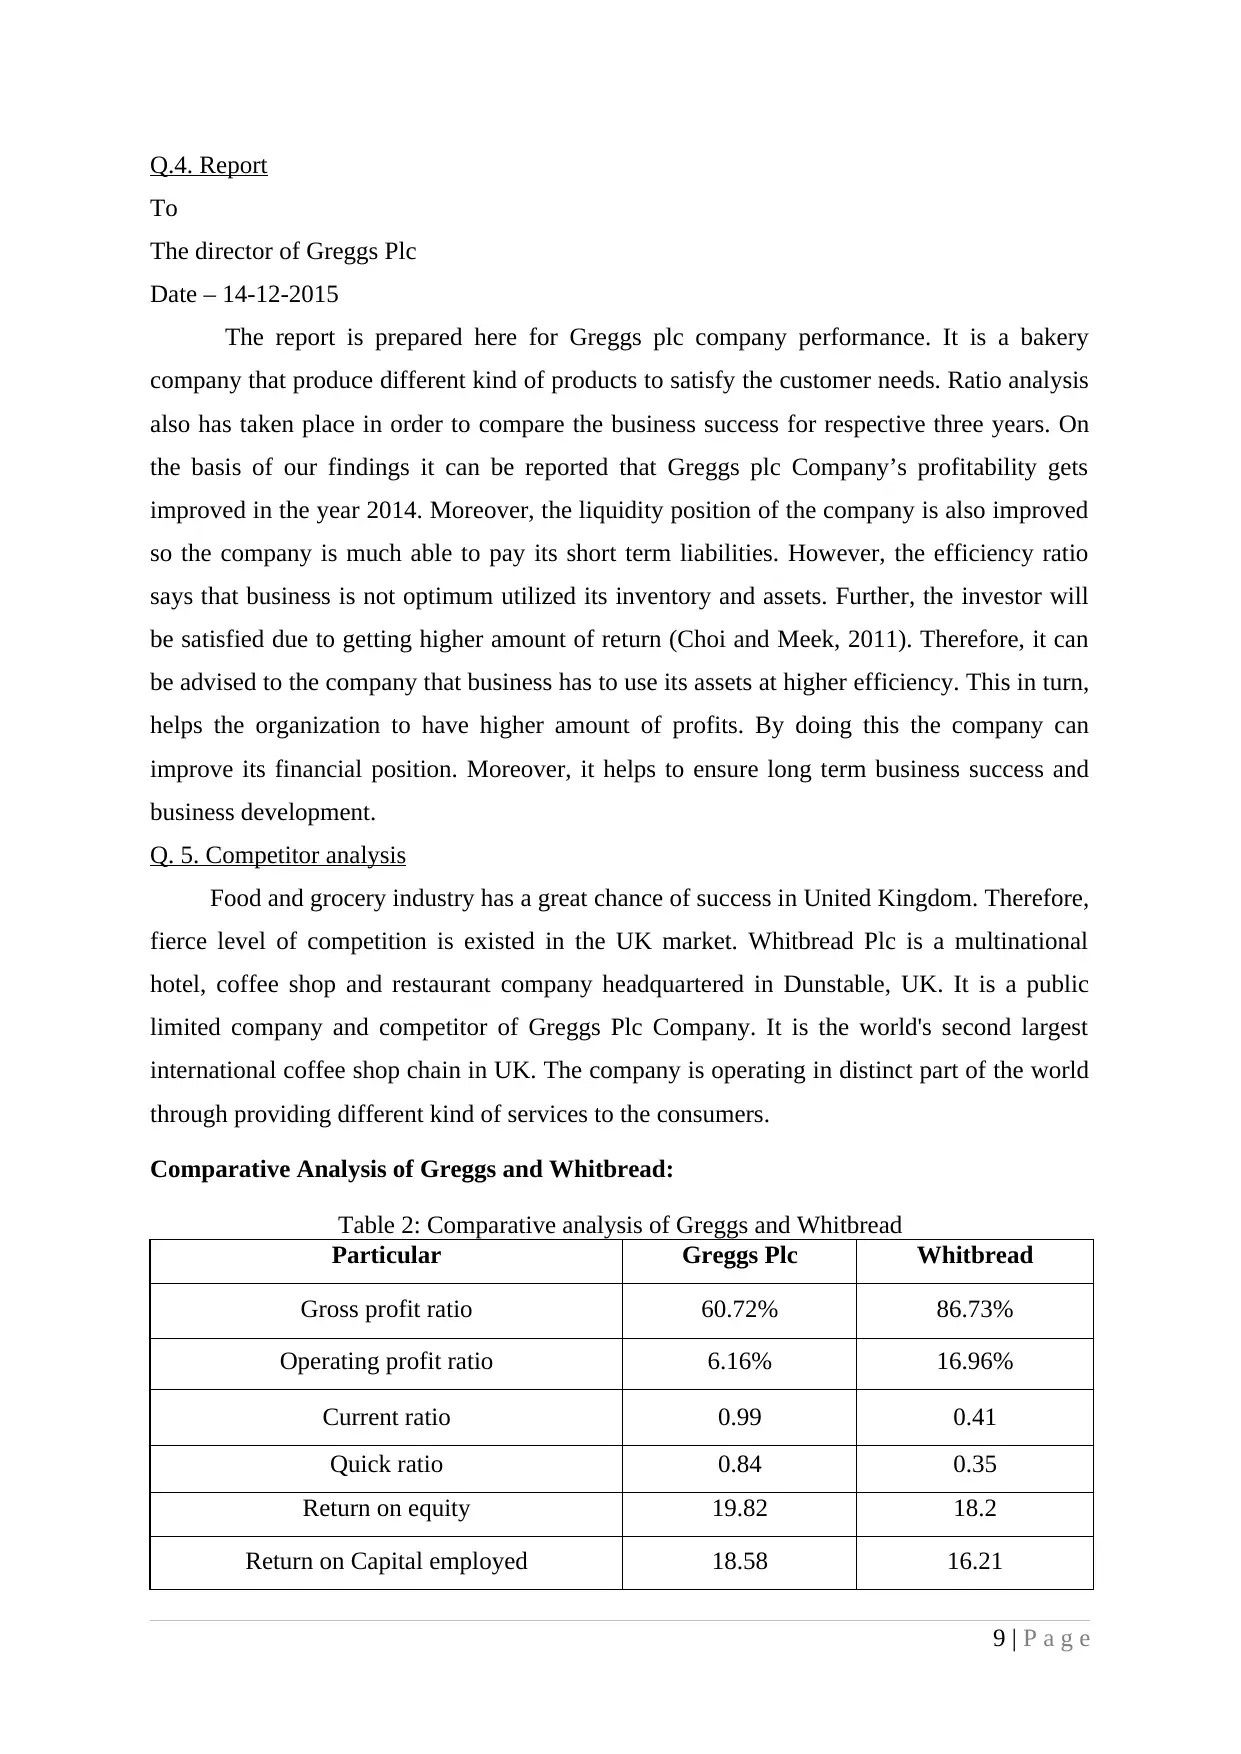
Q.4. Report
To
The director of Greggs Plc
Date – 14-12-2015
The report is prepared here for Greggs plc company performance. It is a bakery
company that produce different kind of products to satisfy the customer needs. Ratio analysis
also has taken place in order to compare the business success for respective three years. On
the basis of our findings it can be reported that Greggs plc Company’s profitability gets
improved in the year 2014. Moreover, the liquidity position of the company is also improved
so the company is much able to pay its short term liabilities. However, the efficiency ratio
says that business is not optimum utilized its inventory and assets. Further, the investor will
be satisfied due to getting higher amount of return (Choi and Meek, 2011). Therefore, it can
be advised to the company that business has to use its assets at higher efficiency. This in turn,
helps the organization to have higher amount of profits. By doing this the company can
improve its financial position. Moreover, it helps to ensure long term business success and
business development.
Q. 5. Competitor analysis
Food and grocery industry has a great chance of success in United Kingdom. Therefore,
fierce level of competition is existed in the UK market. Whitbread Plc is a multinational
hotel, coffee shop and restaurant company headquartered in Dunstable, UK. It is a public
limited company and competitor of Greggs Plc Company. It is the world's second largest
international coffee shop chain in UK. The company is operating in distinct part of the world
through providing different kind of services to the consumers.
Comparative Analysis of Greggs and Whitbread:
Table 2: Comparative analysis of Greggs and Whitbread
Particular Greggs Plc Whitbread
Gross profit ratio 60.72% 86.73%
Operating profit ratio 6.16% 16.96%
Current ratio 0.99 0.41
Quick ratio 0.84 0.35
Return on equity 19.82 18.2
Return on Capital employed 18.58 16.21
9 | P a g e
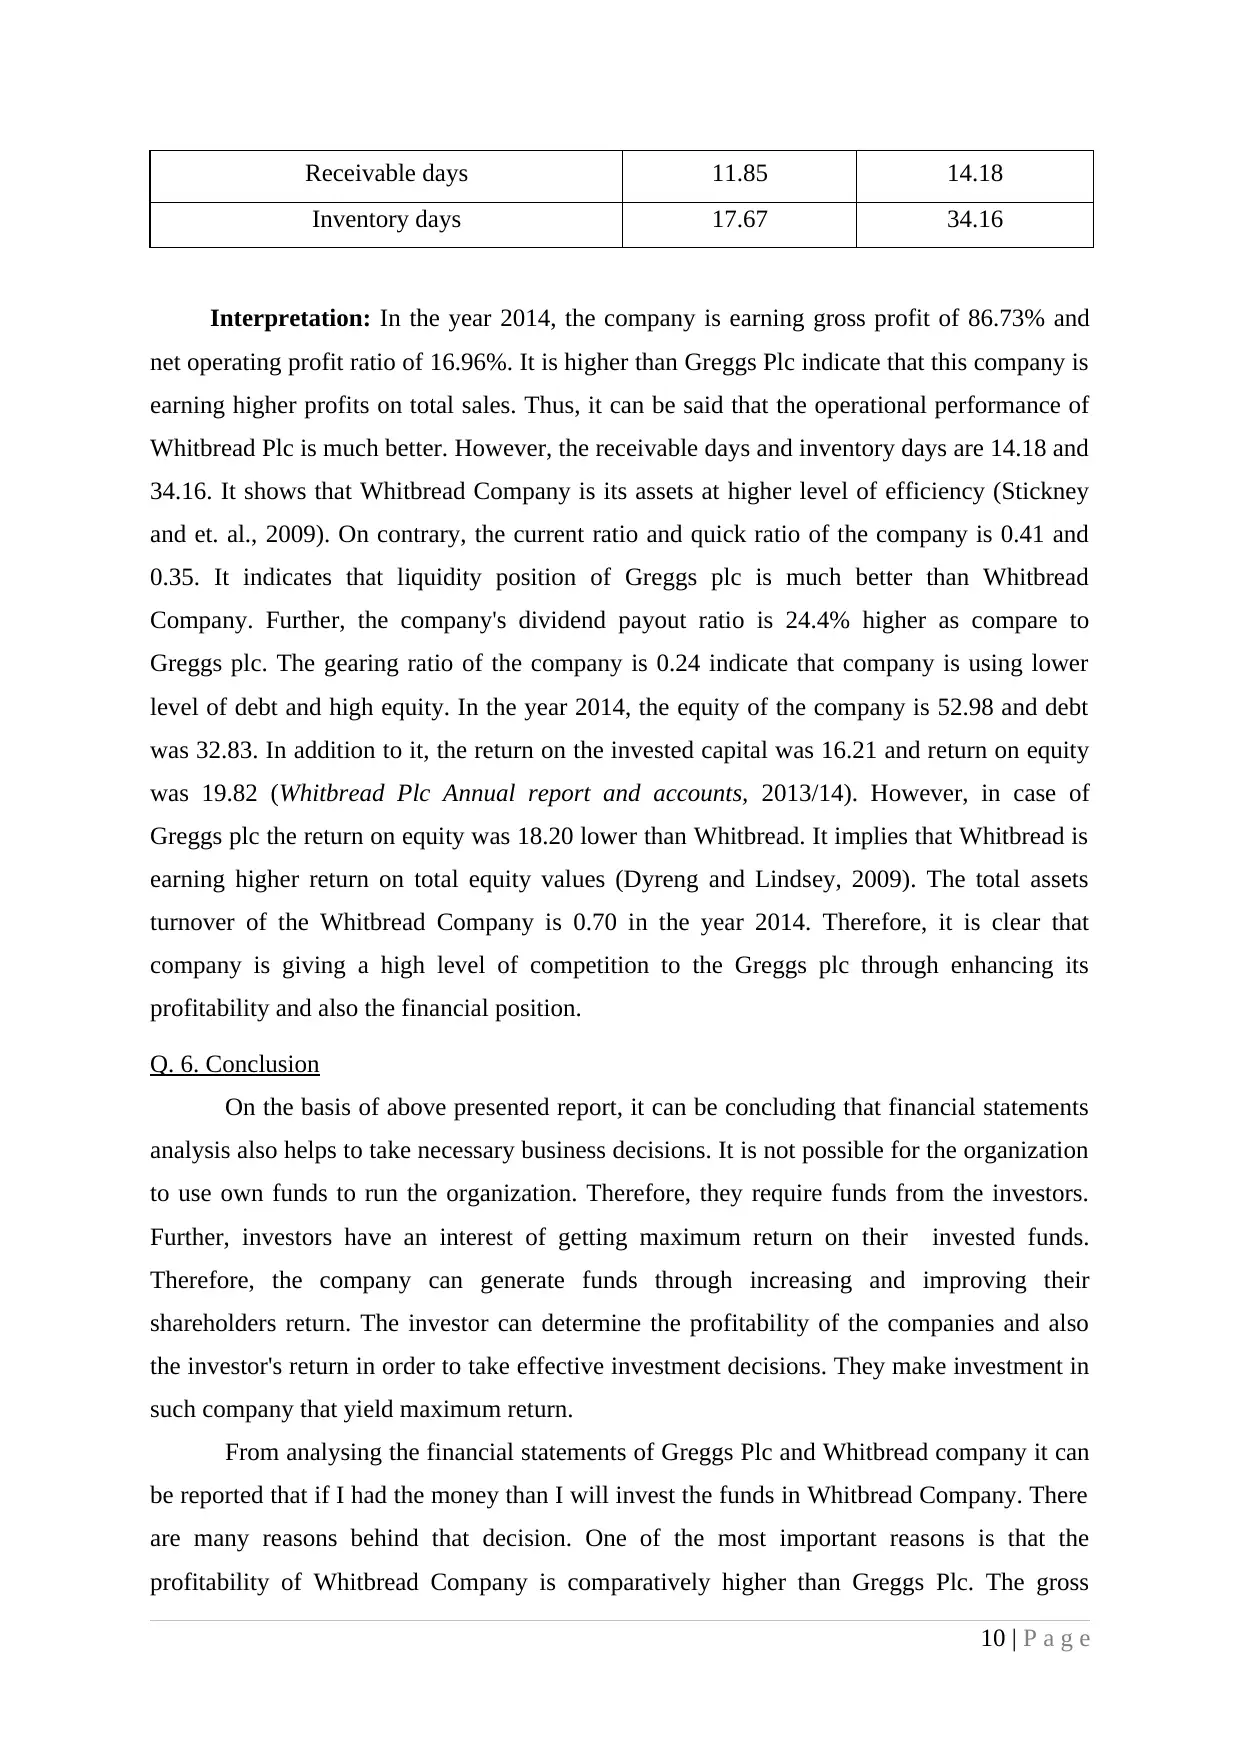
Receivable days 11.85 14.18
Inventory days 17.67 34.16
Interpretation: In the year 2014, the company is earning gross profit of 86.73% and
net operating profit ratio of 16.96%. It is higher than Greggs Plc indicate that this company is
earning higher profits on total sales. Thus, it can be said that the operational performance of
Whitbread Plc is much better. However, the receivable days and inventory days are 14.18 and
34.16. It shows that Whitbread Company is its assets at higher level of efficiency (Stickney
and et. al., 2009). On contrary, the current ratio and quick ratio of the company is 0.41 and
0.35. It indicates that liquidity position of Greggs plc is much better than Whitbread
Company. Further, the company's dividend payout ratio is 24.4% higher as compare to
Greggs plc. The gearing ratio of the company is 0.24 indicate that company is using lower
level of debt and high equity. In the year 2014, the equity of the company is 52.98 and debt
was 32.83. In addition to it, the return on the invested capital was 16.21 and return on equity
was 19.82 (Whitbread Plc Annual report and accounts, 2013/14). However, in case of
Greggs plc the return on equity was 18.20 lower than Whitbread. It implies that Whitbread is
earning higher return on total equity values (Dyreng and Lindsey, 2009). The total assets
turnover of the Whitbread Company is 0.70 in the year 2014. Therefore, it is clear that
company is giving a high level of competition to the Greggs plc through enhancing its
profitability and also the financial position.
Q. 6. Conclusion
On the basis of above presented report, it can be concluding that financial statements
analysis also helps to take necessary business decisions. It is not possible for the organization
to use own funds to run the organization. Therefore, they require funds from the investors.
Further, investors have an interest of getting maximum return on their invested funds.
Therefore, the company can generate funds through increasing and improving their
shareholders return. The investor can determine the profitability of the companies and also
the investor's return in order to take effective investment decisions. They make investment in
such company that yield maximum return.
From analysing the financial statements of Greggs Plc and Whitbread company it can
be reported that if I had the money than I will invest the funds in Whitbread Company. There
are many reasons behind that decision. One of the most important reasons is that the
profitability of Whitbread Company is comparatively higher than Greggs Plc. The gross
10 | P a g e
⊘ This is a preview!⊘
Do you want full access?
Subscribe today to unlock all pages.
Trusted by 1+ million students worldwide
1 out of 16
Related Documents


Your All-in-One AI-Powered Toolkit for Academic Success.
+13062052269
info@desklib.com
Available 24*7 on WhatsApp / Email
![[object Object]](/_next/static/media/star-bottom.7253800d.svg)
Unlock your academic potential
Copyright © 2020–2026 A2Z Services. All Rights Reserved. Developed and managed by ZUCOL.