BUS501: Performance Analysis of Good Harvest Organic Farm Report
VerifiedAdded on 2020/03/16
|14
|2525
|105
Report
AI Summary
This report analyzes the business performance of Good Harvest Organic Farm, focusing on sales and gross profits. The study investigates key questions, including the top and worst-selling products, differences in payment methods (cash vs. credit, Visa vs. MasterCard), the impact of product location within the shop, and the influence of months and seasons on sales and profits. The analysis uses descriptive statistics, t-tests, and ANOVA to identify trends and significant differences. Findings reveal the best and worst performing products, the impact of product location on sales, and the influence of the month on gross profits, while no significant seasonal impact was observed on sales revenue. The report offers valuable insights for the CEO to optimize business strategies and improve profitability.
BUS501 - Business Analytics and Statistics
Student Name:
Lecturer name:
7th October 2017
Student Name:
Lecturer name:
7th October 2017
Paraphrase This Document
Need a fresh take? Get an instant paraphrase of this document with our AI Paraphraser
Table of Contents
1. Introduction..............................................................................................................................3
2. Problem definition and business intelligence required.............................................................4
3. Selected analytics methods and technical analysis...................................................................4
4. Results and findings.................................................................................................................5
Analysis 1: What are the top/worst selling products in terms of sales?.......................................5
Analysis 2: Is there a difference in payments methods?..............................................................6
Hypothesis 1:............................................................................................................................7
Hypothesis 2:............................................................................................................................8
Hypothesis 4:............................................................................................................................9
Analysis 4: Is there a difference in sales and gross profits between different months of the
year?.............................................................................................................................................9
Hypothesis 5:..........................................................................................................................10
Analysis 5: Are there differences in sales performance between different seasons?.................11
Hypothesis 7:..........................................................................................................................11
Discussion of the results and recommendations............................................................................12
References......................................................................................................................................13
Table 1: Top 6 best-selling products...............................................................................................6
Table 2: Top 5 worst-selling products.............................................................................................6
Table 3: t-Test: Two-Sample Assuming Equal Variances..............................................................7
Table 4: t-Test: Two-Sample Assuming Equal Variances..............................................................8
Table 5: Analysis of variance (ANOVA) for the total sales versus product location.....................9
⊘ This is a preview!⊘
Do you want full access?
Subscribe today to unlock all pages.
Trusted by 1+ million students worldwide
1. Introduction
This report concerns the Good Harvest Organic Farm and Markets. The enterprise grows a
range of quality fresh organic produce and sells direct to the local community through its
home delivery service. They strive to bring to their clients the greatest selection of the
freshest, healthiest, natural & organic grocery products on the market today.
Organic products are those products that are grown under some set standards for the Organic
Food Production Act and they are strictly regulated to ensure a chemical-free product
(Markandya & Setboonsarng, 2008). Organic food handlers, for instance the Good Harvest
Market, are mainly committed to ensure that integrity in the label is maintained.
Good Harvest Organic Farm has just been in the market for barely two years. The CEO is
interested in utilizing data to understand how the firm has been performing in terms of sales.
This study therefore aimed at understanding how the firm has been performing in the last 2
years and probably advice on the best practises that the company can undertake in order to
ensure they remain ahead when it comes to their performance in terms of sales revenues.
2. Problem definition and business intelligence required
Managers as well as the board of directors of companies are normally faced by myriad of
challenges. They burn the midnight oil trying to come up with ways in which they can ensure
their company remains in the market for the next several years to come. This is not an
exception to the CEO of Good Harvest Organic Farm. The company is apparently young and
as such a lot of learnings need to be documented and most likely the best practices be used
while doing away with bad practices that can make the company not prosper. We are
presented with the following questions that needs to be answered;
Paraphrase This Document
Need a fresh take? Get an instant paraphrase of this document with our AI Paraphraser
a) What are the top/worst selling products in terms of sales?
b) Is there a difference in payments methods?
c) Are the differences in sales performance based on where the product is located in the
shop? How does this effect both profits and revenue?
d) Is there a difference in sales and gross profits between different months of the year?
e) Are their differences in sales performance between different seasons?
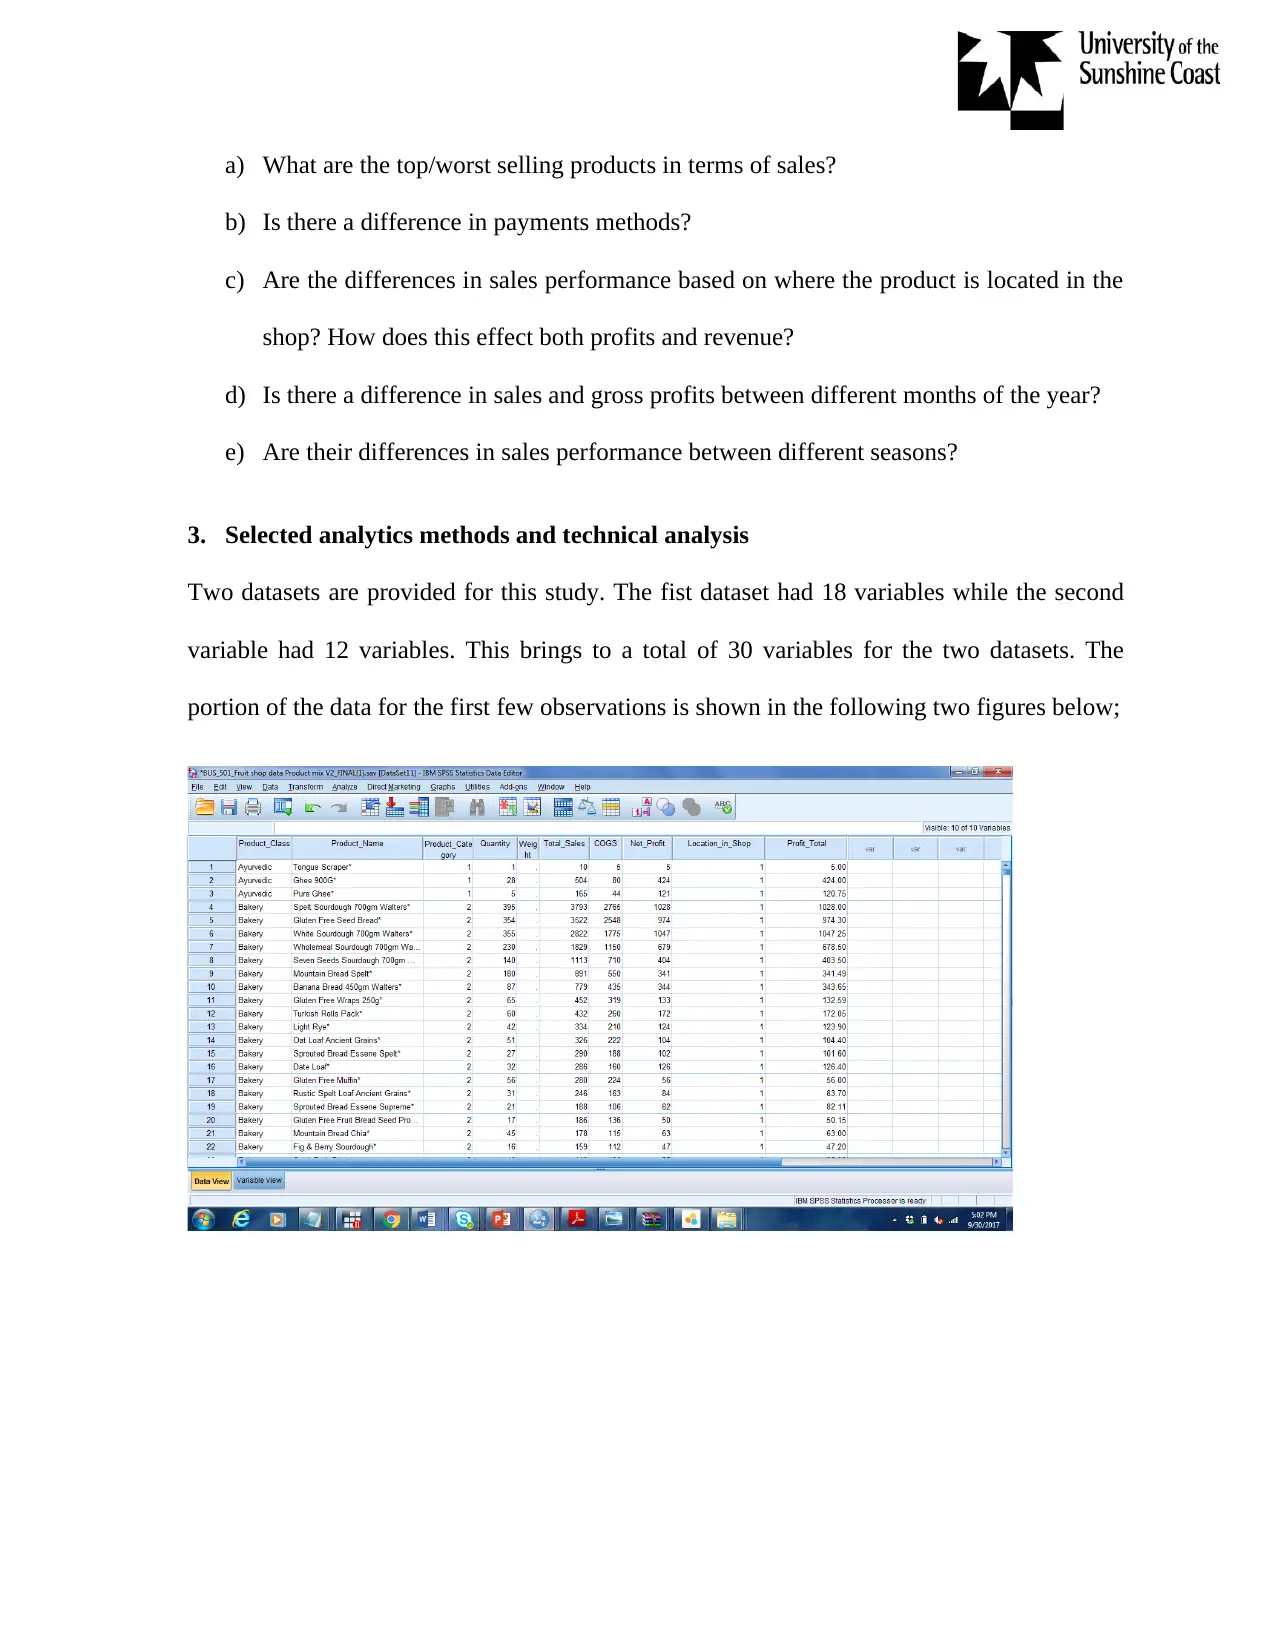
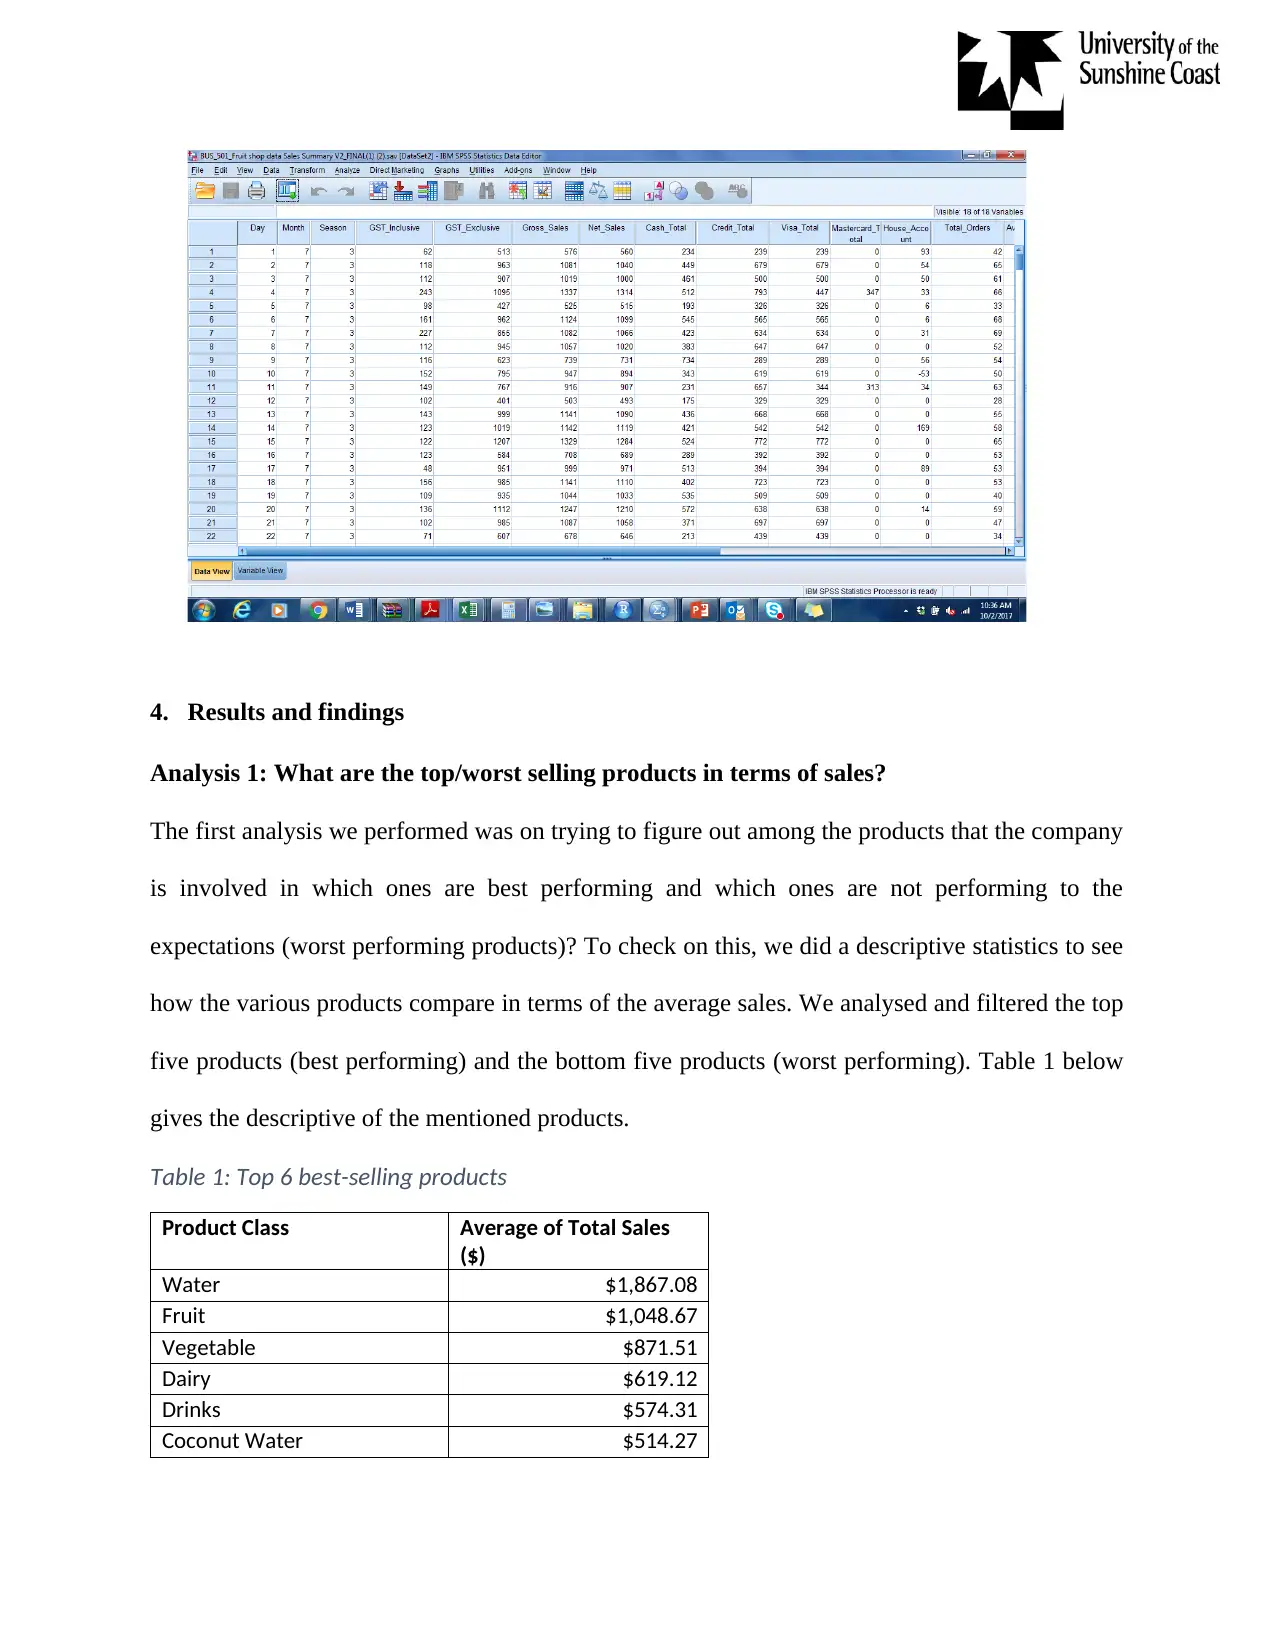
3. Selected analytics methods and technical analysis
Two datasets are provided for this study. The fist dataset had 18 variables while the second
variable had 12 variables. This brings to a total of 30 variables for the two datasets. The
portion of the data for the first few observations is shown in the following two figures below;
b) Is there a difference in payments methods?
c) Are the differences in sales performance based on where the product is located in the
shop? How does this effect both profits and revenue?
d) Is there a difference in sales and gross profits between different months of the year?
e) Are their differences in sales performance between different seasons?
3. Selected analytics methods and technical analysis
Two datasets are provided for this study. The fist dataset had 18 variables while the second
variable had 12 variables. This brings to a total of 30 variables for the two datasets. The
portion of the data for the first few observations is shown in the following two figures below;
4. Results and findings
Analysis 1: What are the top/worst selling products in terms of sales?
The first analysis we performed was on trying to figure out among the products that the company
is involved in which ones are best performing and which ones are not performing to the
expectations (worst performing products)? To check on this, we did a descriptive statistics to see
how the various products compare in terms of the average sales. We analysed and filtered the top
five products (best performing) and the bottom five products (worst performing). Table 1 below
gives the descriptive of the mentioned products.
Table 1: Top 6 best-selling products
Product Class Average of Total Sales
($)
Water $1,867.08
Fruit $1,048.67
Vegetable $871.51
Dairy $619.12
Drinks $574.31
Coconut Water $514.27
⊘ This is a preview!⊘
Do you want full access?
Subscribe today to unlock all pages.
Trusted by 1+ million students worldwide
Table 2: Top 5 worst-selling products
Product Class Average of Total Sales
($)
Salad Greens $25.00
Snacks $20.50
Spices $19.07
Herbal Teas $18.00
Juicing $5.00
Tables 1 and 2 present the average total sales for the worst performing and best performing
products. Best 5 performing products have sales amounting to an average greater than $500. Six
products fall in this category and they are; water, fruit, vegetable, dairy, drinks and coconut
water. The worst performing products have sales averaging to less than $30. The products in this
category include; salad greens, herbal teas, juicing, spices and snacks.
Analysis 2: Is there a difference in payments methods?
Another important analysis conducted that applies the inferential statistics is one testing whether
there are differences in payment methods. Two hypothesis are performed; the first one tests the
difference in total cash received for the credit and cash payment methods.
Hypothesis 1:
In the first hypothesis we check whether there is significant difference in total cash received
from the cash and credit payment methods. The following hypothesis was answered;
H0 :There is no significant difference in the total cash received for the credit and cash payment
methods
H A :There is significant difference in the total cash received for the credit and cash payment
methods
Paraphrase This Document
Need a fresh take? Get an instant paraphrase of this document with our AI Paraphraser
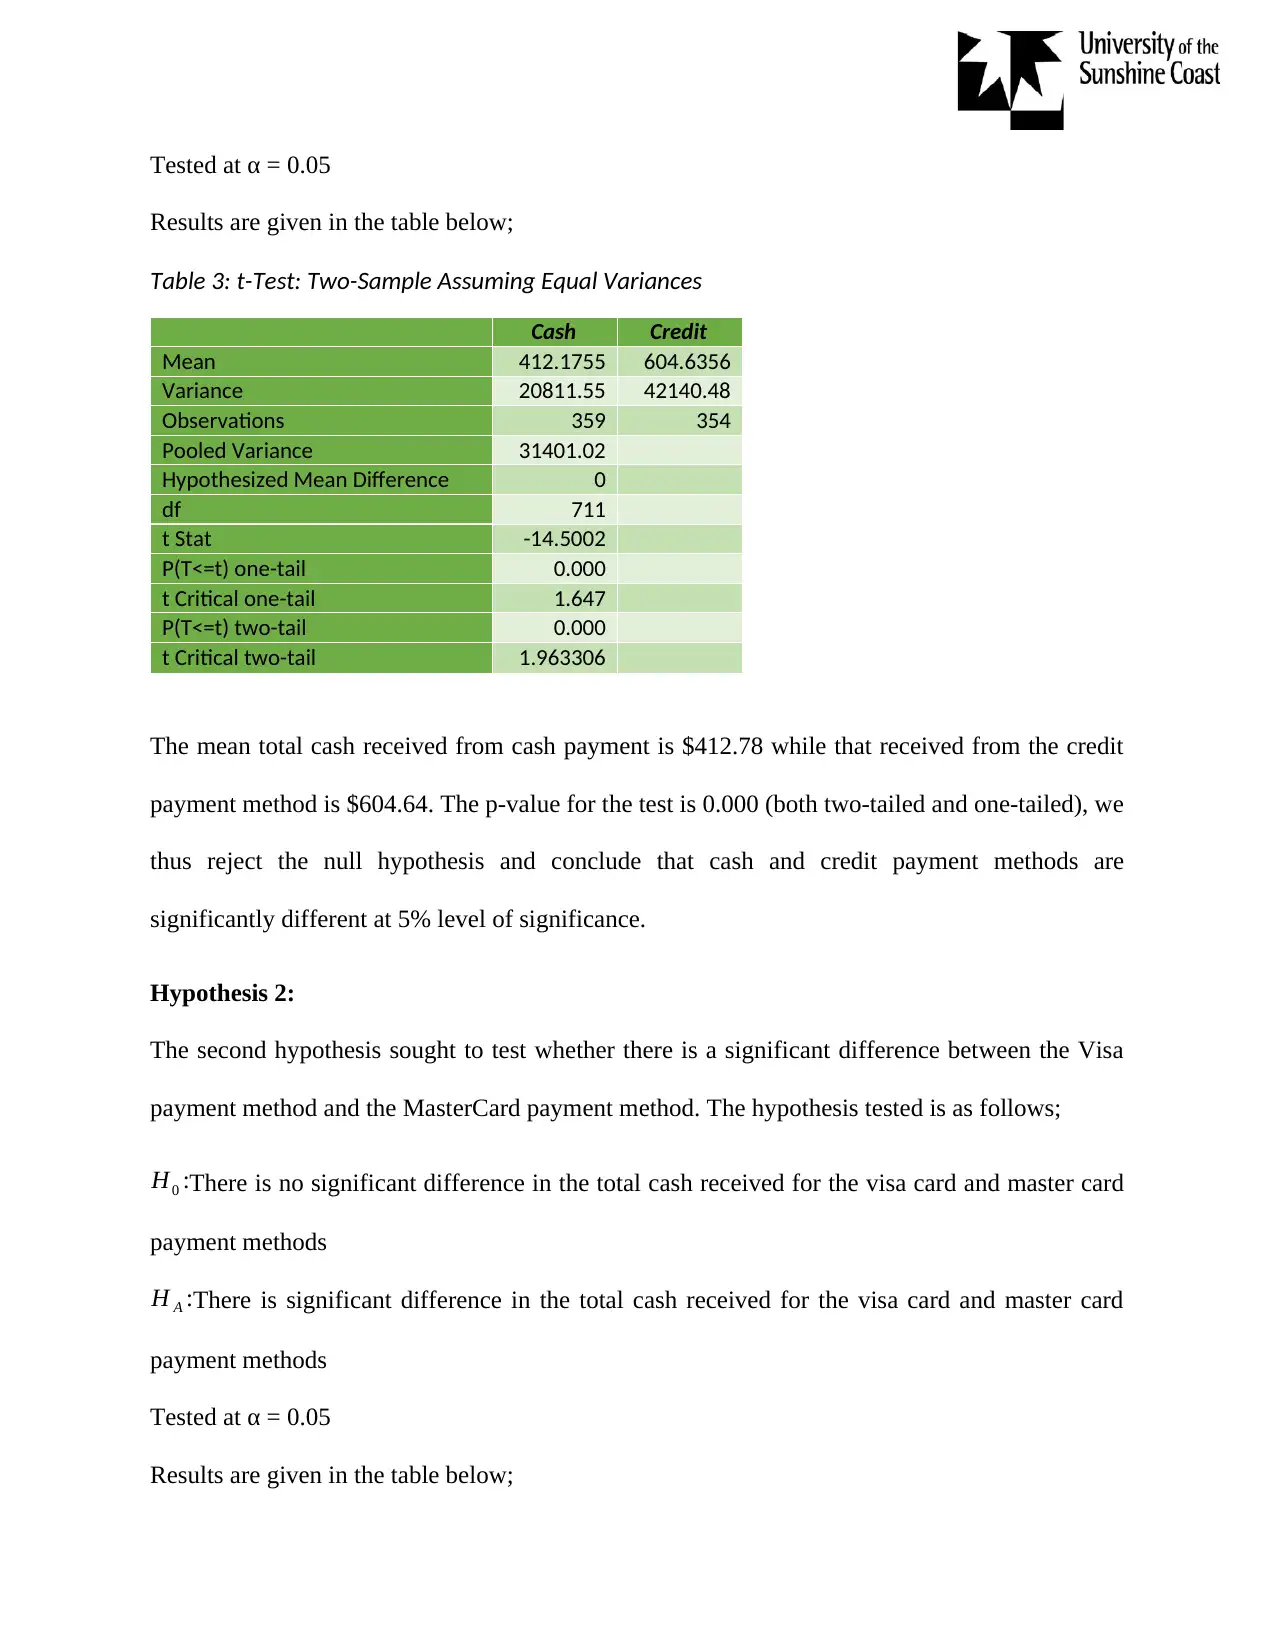
Tested at α = 0.05
Results are given in the table below;
Table 3: t-Test: Two-Sample Assuming Equal Variances
Cash Credit
Mean 412.1755 604.6356
Variance 20811.55 42140.48
Observations 359 354
Pooled Variance 31401.02
Hypothesized Mean Difference 0
df 711
t Stat -14.5002
P(T<=t) one-tail 0.000
t Critical one-tail 1.647
P(T<=t) two-tail 0.000
t Critical two-tail 1.963306
The mean total cash received from cash payment is $412.78 while that received from the credit
payment method is $604.64. The p-value for the test is 0.000 (both two-tailed and one-tailed), we
thus reject the null hypothesis and conclude that cash and credit payment methods are
significantly different at 5% level of significance.
Hypothesis 2:
The second hypothesis sought to test whether there is a significant difference between the Visa
payment method and the MasterCard payment method. The hypothesis tested is as follows;
H0 :There is no significant difference in the total cash received for the visa card and master card
payment methods
H A :There is significant difference in the total cash received for the visa card and master card
payment methods
Tested at α = 0.05
Results are given in the table below;
Results are given in the table below;
Table 3: t-Test: Two-Sample Assuming Equal Variances
Cash Credit
Mean 412.1755 604.6356
Variance 20811.55 42140.48
Observations 359 354
Pooled Variance 31401.02
Hypothesized Mean Difference 0
df 711
t Stat -14.5002
P(T<=t) one-tail 0.000
t Critical one-tail 1.647
P(T<=t) two-tail 0.000
t Critical two-tail 1.963306
The mean total cash received from cash payment is $412.78 while that received from the credit
payment method is $604.64. The p-value for the test is 0.000 (both two-tailed and one-tailed), we
thus reject the null hypothesis and conclude that cash and credit payment methods are
significantly different at 5% level of significance.
Hypothesis 2:
The second hypothesis sought to test whether there is a significant difference between the Visa
payment method and the MasterCard payment method. The hypothesis tested is as follows;
H0 :There is no significant difference in the total cash received for the visa card and master card
payment methods
H A :There is significant difference in the total cash received for the visa card and master card
payment methods
Tested at α = 0.05
Results are given in the table below;
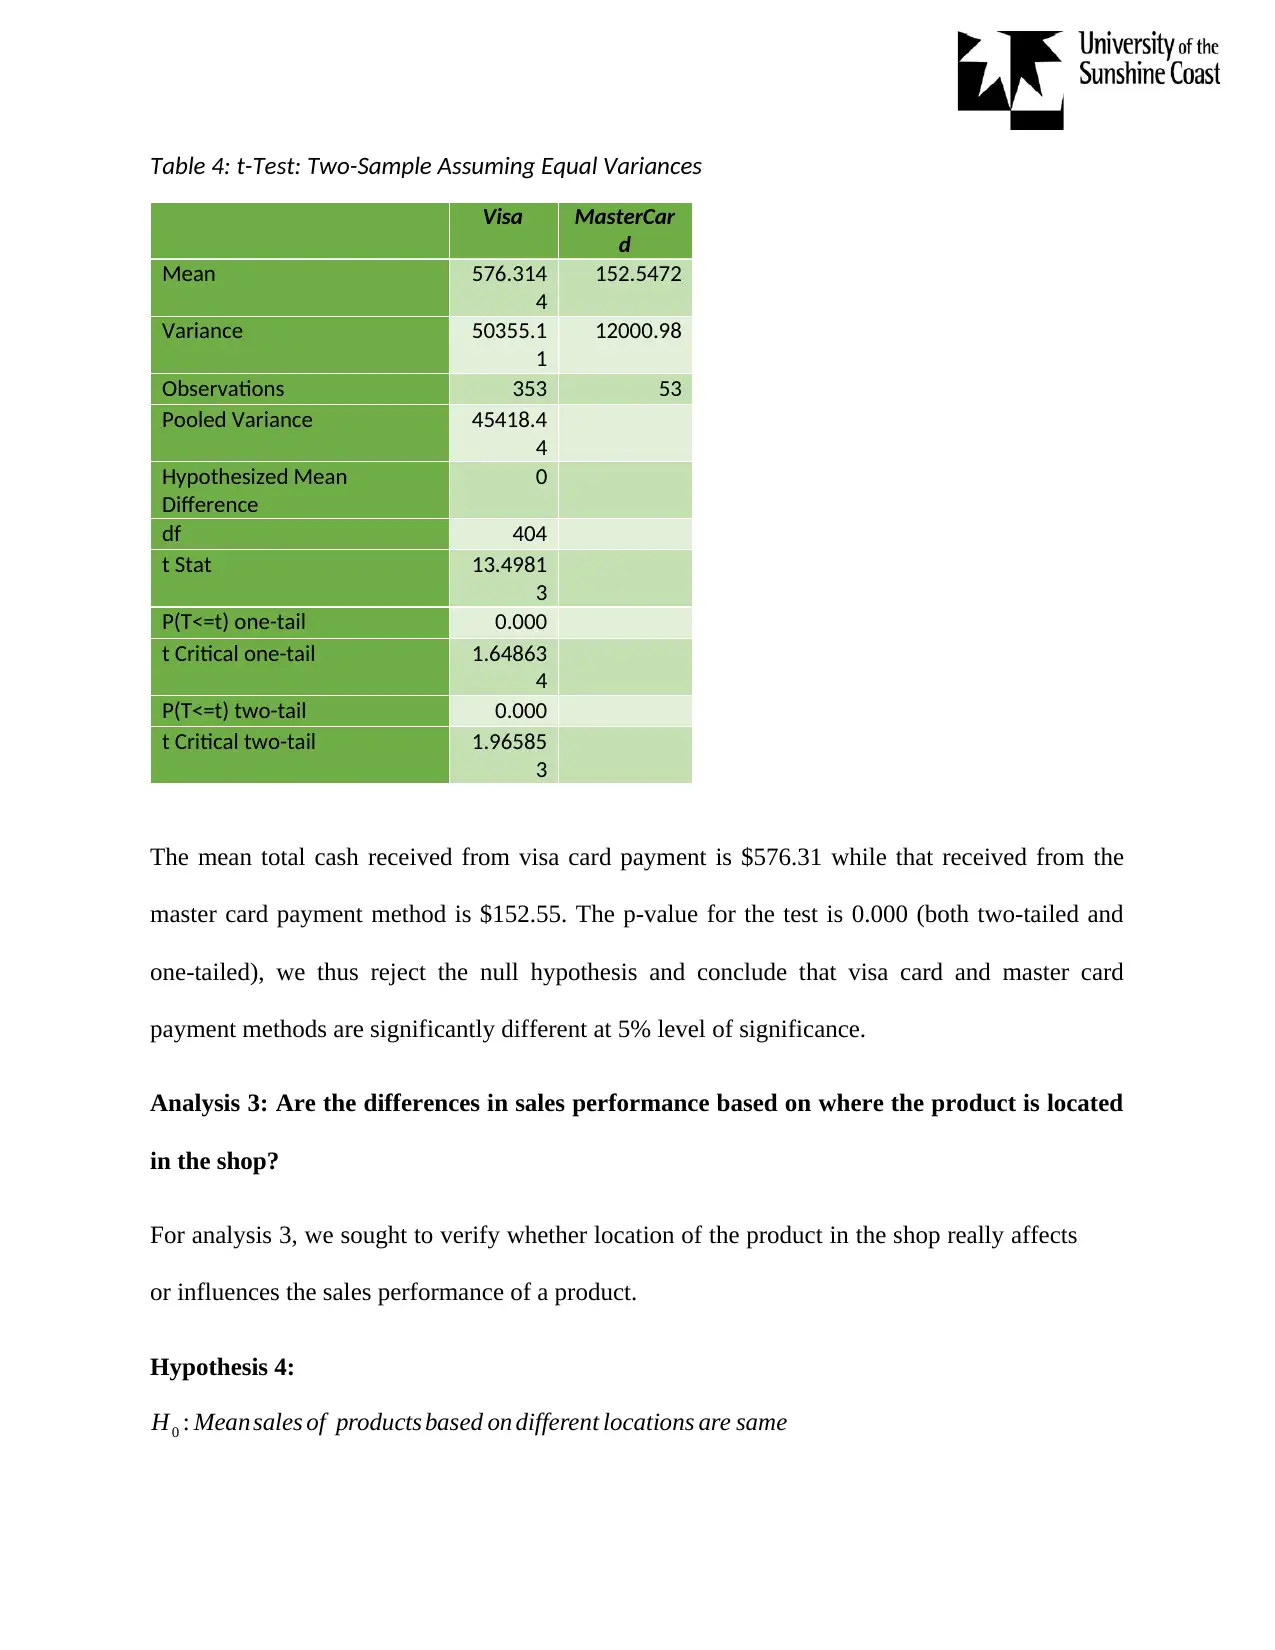
Table 4: t-Test: Two-Sample Assuming Equal Variances
Visa MasterCar
d
Mean 576.314
4
152.5472
Variance 50355.1
1
12000.98
Observations 353 53
Pooled Variance 45418.4
4
Hypothesized Mean
Difference
0
df 404
t Stat 13.4981
3
P(T<=t) one-tail 0.000
t Critical one-tail 1.64863
4
P(T<=t) two-tail 0.000
t Critical two-tail 1.96585
3
The mean total cash received from visa card payment is $576.31 while that received from the
master card payment method is $152.55. The p-value for the test is 0.000 (both two-tailed and
one-tailed), we thus reject the null hypothesis and conclude that visa card and master card
payment methods are significantly different at 5% level of significance.
Analysis 3: Are the differences in sales performance based on where the product is located
in the shop?
For analysis 3, we sought to verify whether location of the product in the shop really affects
or influences the sales performance of a product.
Hypothesis 4:
H0 : Mean sales of products based on different locations are same
⊘ This is a preview!⊘
Do you want full access?
Subscribe today to unlock all pages.
Trusted by 1+ million students worldwide
H A : At least one of the meansis different
Tested at α = 0.05
Table 5: Analysis of variance (ANOVA) for the total sales versus product location
Total Sales ($)
Sum of Squares df Mean Square F Sig.
Between Groups 134299725.02 4 33574931.26 37.176 .000
Within Groups 929333380.82 1029 903142.26
Total 1063633105.84 1033
ANOVA test was performed to test whether there is difference in the means for the different
product locations within the shop. The p-value is 0.000 (a value less than 5% significance level),
we therefore reject the null hypothesis and come to a conclusion that at least one of the means is
significantly different.
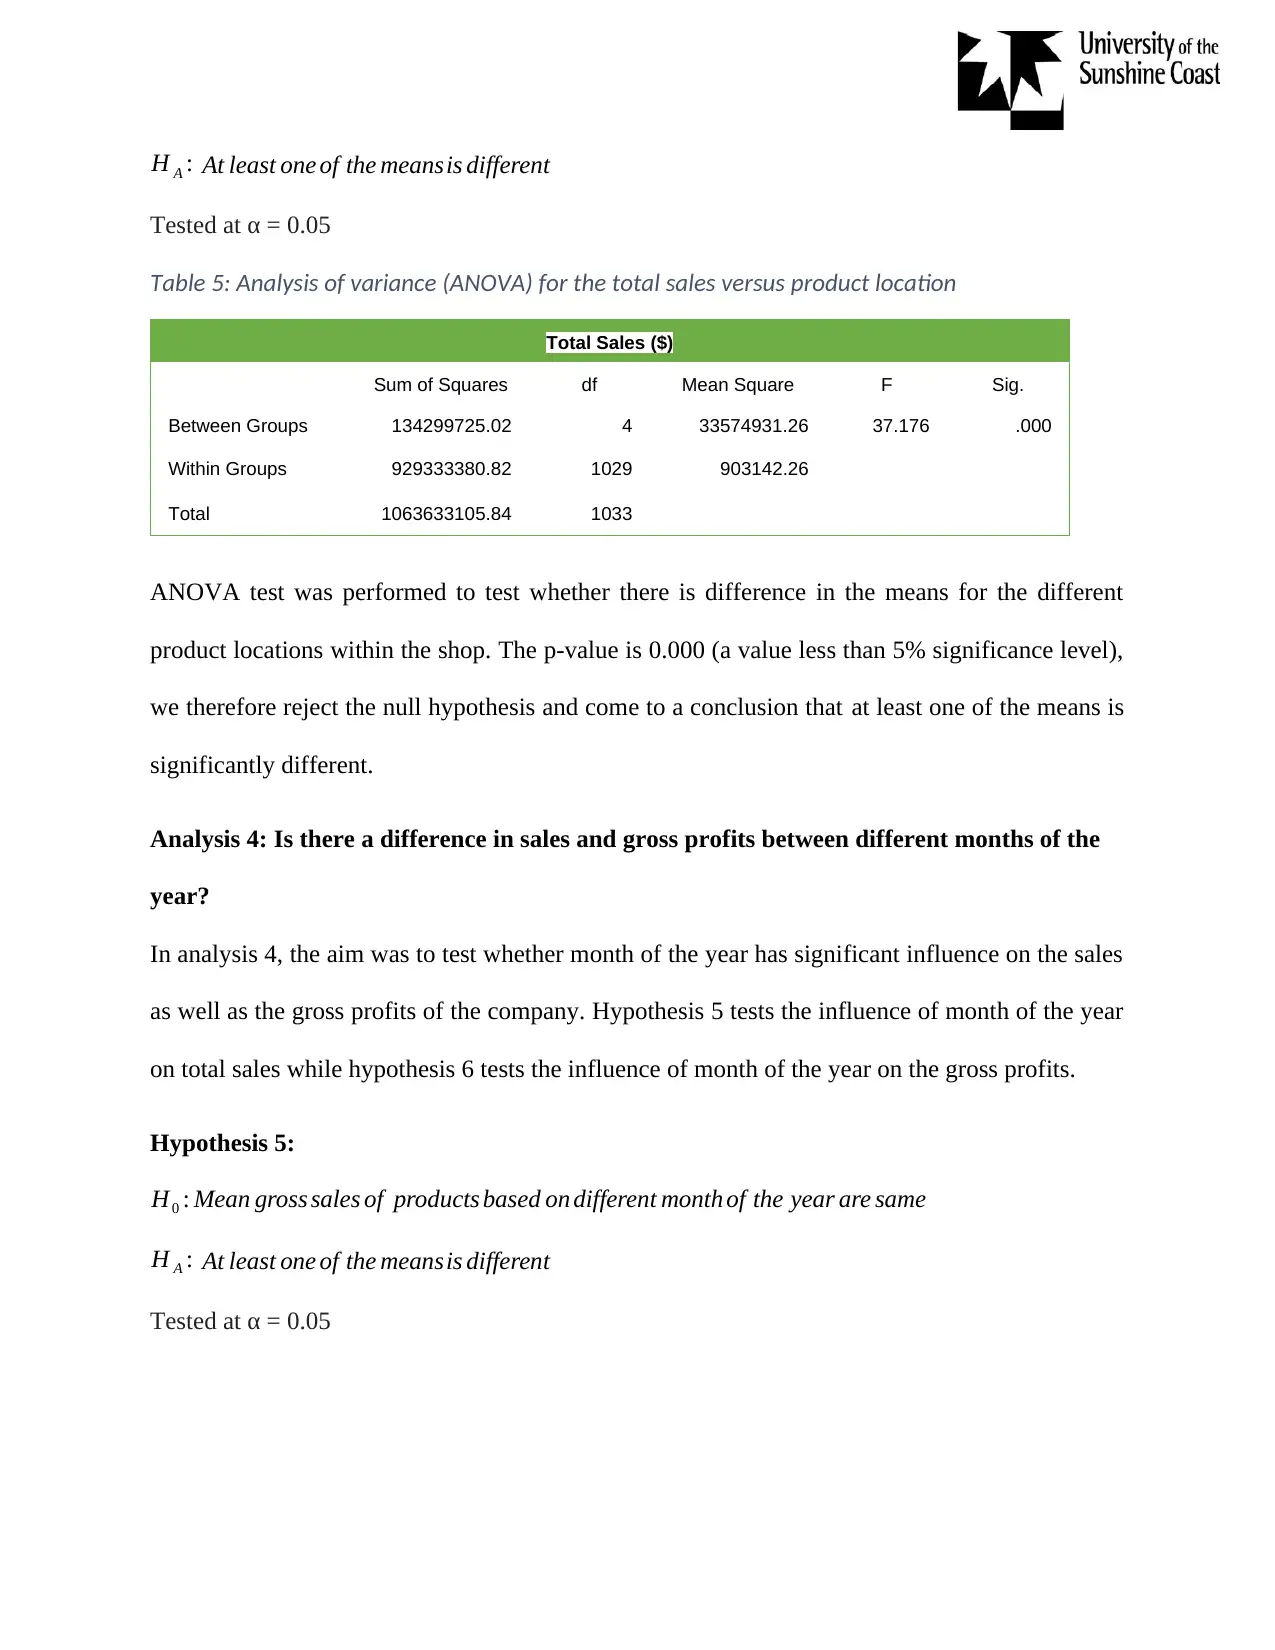
Analysis 4: Is there a difference in sales and gross profits between different months of the
year?
In analysis 4, the aim was to test whether month of the year has significant influence on the sales
as well as the gross profits of the company. Hypothesis 5 tests the influence of month of the year
on total sales while hypothesis 6 tests the influence of month of the year on the gross profits.
Hypothesis 5:
H0 : Mean gross sales of products based on different month of the year are same
H A : At least one of the meansis different
Tested at α = 0.05
Tested at α = 0.05
Table 5: Analysis of variance (ANOVA) for the total sales versus product location
Total Sales ($)
Sum of Squares df Mean Square F Sig.
Between Groups 134299725.02 4 33574931.26 37.176 .000
Within Groups 929333380.82 1029 903142.26
Total 1063633105.84 1033
ANOVA test was performed to test whether there is difference in the means for the different
product locations within the shop. The p-value is 0.000 (a value less than 5% significance level),
we therefore reject the null hypothesis and come to a conclusion that at least one of the means is
significantly different.
Analysis 4: Is there a difference in sales and gross profits between different months of the
year?
In analysis 4, the aim was to test whether month of the year has significant influence on the sales
as well as the gross profits of the company. Hypothesis 5 tests the influence of month of the year
on total sales while hypothesis 6 tests the influence of month of the year on the gross profits.
Hypothesis 5:
H0 : Mean gross sales of products based on different month of the year are same
H A : At least one of the meansis different
Tested at α = 0.05
Paraphrase This Document
Need a fresh take? Get an instant paraphrase of this document with our AI Paraphraser
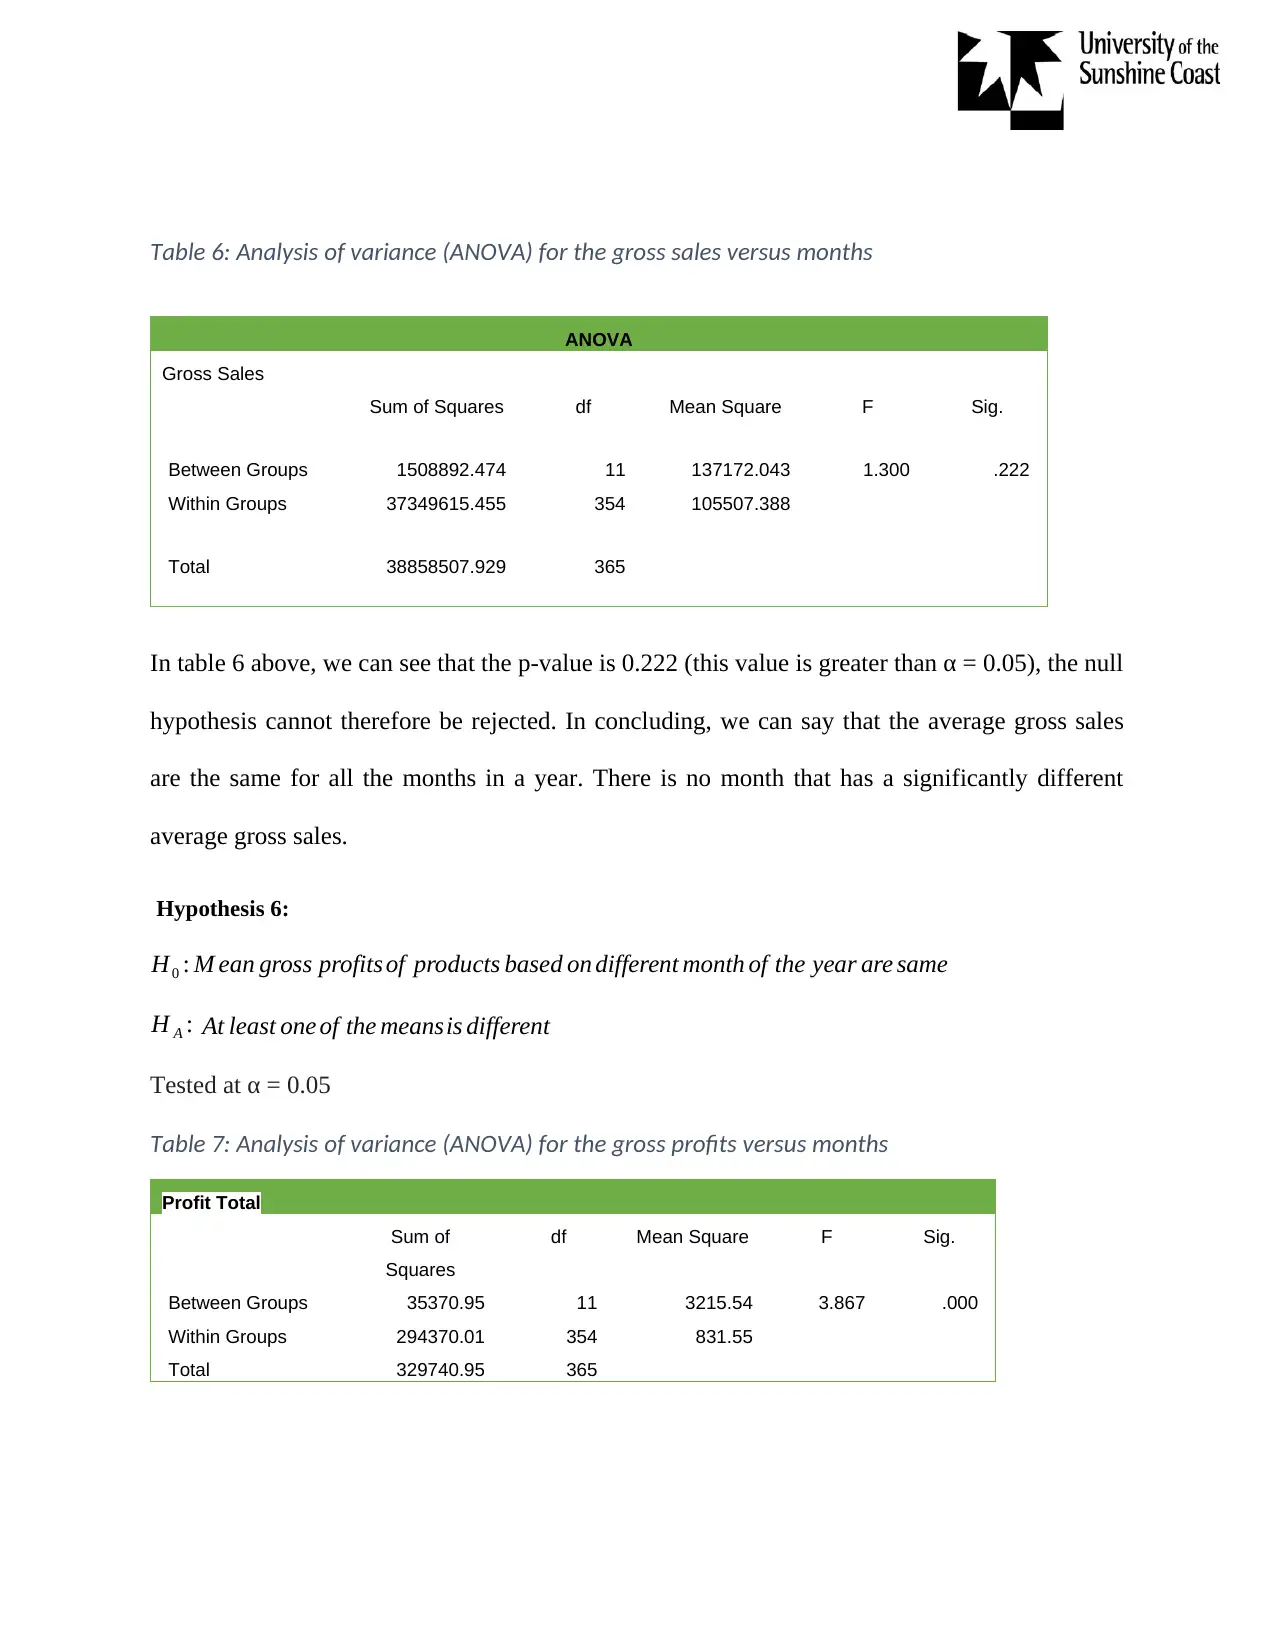
Table 6: Analysis of variance (ANOVA) for the gross sales versus months
ANOVA
Gross Sales
Sum of Squares df Mean Square F Sig.
Between Groups 1508892.474 11 137172.043 1.300 .222
Within Groups 37349615.455 354 105507.388
Total 38858507.929 365
In table 6 above, we can see that the p-value is 0.222 (this value is greater than α = 0.05), the null
hypothesis cannot therefore be rejected. In concluding, we can say that the average gross sales
are the same for all the months in a year. There is no month that has a significantly different
average gross sales.
Hypothesis 6:
H0 : M ean gross profits of products based on different month of the year are same
H A : At least one of the meansis different
Tested at α = 0.05
Table 7: Analysis of variance (ANOVA) for the gross profits versus months
Profit Total
Sum of
Squares
df Mean Square F Sig.
Between Groups 35370.95 11 3215.54 3.867 .000
Within Groups 294370.01 354 831.55
Total 329740.95 365
In table 8 above, we can see that the p-value is 0.000 (this value is less than α = 0.05), the null
hypothesis is therefore rejected. In rejecting the null hypothesis, we conclude that the average
gross profit are at least significantly different for one of the months of the year. .
Analysis 5: Are there differences in sales performance between different seasons?
For the case of analysis 5, the aim was to verify whether the sales performance is different
between the four seasons. Does it appear that some seasons make more sales than the others? To
test this, we used analysis of variance (ANOVA) test. The hypothesis tested is given below;
Hypothesis 7:
H0 : Mean gross sales of products based on different seasons are same
H A : At least one of the meansis different
Tested at α = 0.05
Table 8: Analysis of variance (ANOVA) for the net sales versus seasons
ANOVA
Gross Sales
Sum of Squares df Mean Square F Sig.
Between Groups 560240.410 3 186746.803 1.765 .153
Within Groups 38298267.520 362 105796.319
Total 38858507.929 365
In table 8 above, we can see that the p-value is 0.000 (this value is greater than α = 0.05), the null
hypothesis is not rejected. In not rejecting the null hypothesis, we conclude that the average
gross profit are the same for the different seasons.
⊘ This is a preview!⊘
Do you want full access?
Subscribe today to unlock all pages.
Trusted by 1+ million students worldwide
1 out of 14
Related Documents


Your All-in-One AI-Powered Toolkit for Academic Success.
+13062052269
info@desklib.com
Available 24*7 on WhatsApp / Email
![[object Object]](/_next/static/media/star-bottom.7253800d.svg)
Unlock your academic potential
Copyright © 2020–2026 A2Z Services. All Rights Reserved. Developed and managed by ZUCOL.