Business Problem Analysis and Decision Making Report for Ann's College
VerifiedAdded on 2020/06/05
|18
|3088
|62
Report
AI Summary
This report addresses the business problem of Ann's College, a UK-based educational institute facing declining student enrollment and revenue, along with poor student performance. It outlines a research methodology involving primary and secondary data collection, including questionnaires and survey methodologies. The report uses measures of dispersion, quartiles, percentiles, and correlation analysis to interpret data and draw conclusions about the business context. It presents findings through graphs, trend lines, and scatter diagrams, culminating in a business presentation and the application of information processing and financial tools. A project plan, including a network diagram and Gantt chart, is utilized to determine critical paths and overall project duration, offering insights for future decision-making and problem-solving.
Business Decision Making
Paraphrase This Document
Need a fresh take? Get an instant paraphrase of this document with our AI Paraphraser
TABLE OF CONTENTS
INTRODUCTION...........................................................................................................................1
TASK 1............................................................................................................................................1
1.1 Brief description of organisation and its business problem..................................................1
1.2 Creating plan for collection of primary and secondary data.................................................1
1.3 Questionnaire for the business problem................................................................................2
1.4 Survey methodology and sample frame................................................................................4
2.1 Application of measures of dispersion..................................................................................4
2.2 Conclusions on business context...........................................................................................6
2.3 Calculation od quartiles, percentiles and correlation of coefficient......................................6
TASK 2............................................................................................................................................7
3.1 Conclusions based on graphs................................................................................................8
3.2 Presentation of trend lines and scatter diagram.....................................................................9
3.3 Business presentation............................................................................................................9
TASK 3..........................................................................................................................................10
4.1 Using of information processing tools................................................................................10
4.2 Project plan and determination of critical path...................................................................11
4.3 Using of financial tools for decision making......................................................................12
4.4 Formal business report........................................................................................................13
CONCLUSION:.............................................................................................................................14
REFERENCES..............................................................................................................................15
INTRODUCTION
Every organisation whether from any industry face few problems. The report is based on
the business problem that is being faced by Ann's college. The problem is continuous decline in
the performance of students and it revenue. Present report provides methodology of research that
will enable the management in making future economic decisions. It includes methods of
collecting relevant data that will enable the researcher in identifying reasons behind the business
problem along financial performance analysis.
TASK 1
1.1 Brief description of organisation and its business problem
The research report focuses on the business problem of an educational institute that is
Ann's College which is based in UK. The main problem that college is facing is decline in the
number of students and overall revenue of the college. Another major problem of the
organisation is poor performance of the students due to which overall performance of the college
is also declining and management is not able to attract more students. There may be any reasons
behind this situation that is lack of high professional tutors, lack of proper study material, bad
environment of the college, etc. (Beach and Lipshitz, 2017) The concerned organisation is keen
to know about the reasons behind their this business problem.
1.2 Creating plan for collection of primary and secondary data
In order to conduct research on any business problem, collection of relevant data is
necessary. Therefore, in case of Ann's college problem, researcher would require relevant data
for conducting his research and identifying the actual reasons behind the decline in performance
of college. For this purpose data can be collected through primary sources or secondary sources.
Primary sources for collection of data can be:
Data that has been collected for the very first time in context with the business problem is
primary data.
Direct interview of old students and present students of college (Bennun and et.al., 2017).
Analysing trends of admission of students into college.
1
⊘ This is a preview!⊘
Do you want full access?
Subscribe today to unlock all pages.
Trusted by 1+ million students worldwide
By observations and referring case studies.
Secondary sources for collection of data:
Data that has been already collected for any purpose whether the similar business
problem or not, is referred to secondary data.
Information available on internet or books.
Newspaper.
Already collected feedbacks of students and professors (Calabrese and et.al., 2017).
These are the choices available to the researcher for collecting relevant data in order to
conduct his research.
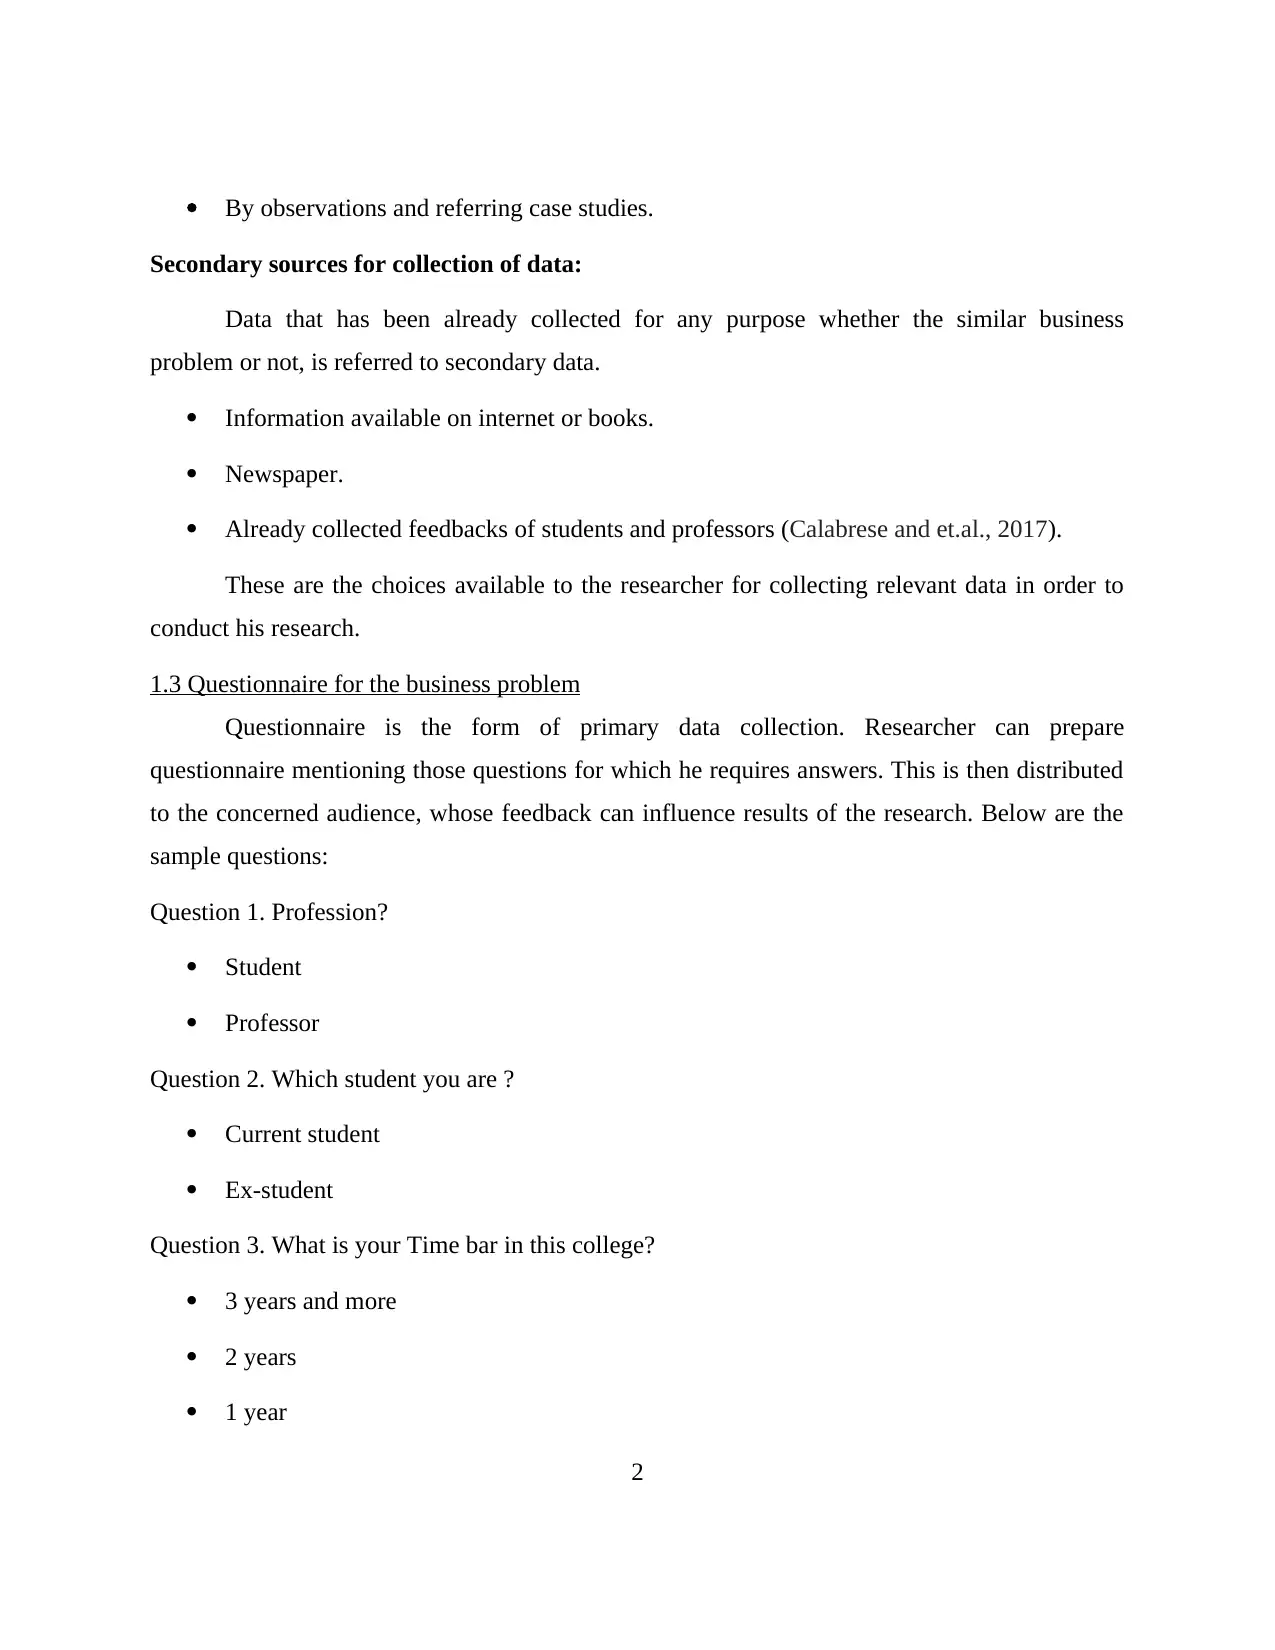
1.3 Questionnaire for the business problem
Questionnaire is the form of primary data collection. Researcher can prepare
questionnaire mentioning those questions for which he requires answers. This is then distributed
to the concerned audience, whose feedback can influence results of the research. Below are the
sample questions:
Question 1. Profession?
Student
Professor
Question 2. Which student you are ?
Current student
Ex-student
Question 3. What is your Time bar in this college?
3 years and more
2 years
1 year
2
Secondary sources for collection of data:
Data that has been already collected for any purpose whether the similar business
problem or not, is referred to secondary data.
Information available on internet or books.
Newspaper.
Already collected feedbacks of students and professors (Calabrese and et.al., 2017).
These are the choices available to the researcher for collecting relevant data in order to
conduct his research.
1.3 Questionnaire for the business problem
Questionnaire is the form of primary data collection. Researcher can prepare
questionnaire mentioning those questions for which he requires answers. This is then distributed
to the concerned audience, whose feedback can influence results of the research. Below are the
sample questions:
Question 1. Profession?
Student
Professor
Question 2. Which student you are ?
Current student
Ex-student
Question 3. What is your Time bar in this college?
3 years and more
2 years
1 year
2
Paraphrase This Document
Need a fresh take? Get an instant paraphrase of this document with our AI Paraphraser
Just joined
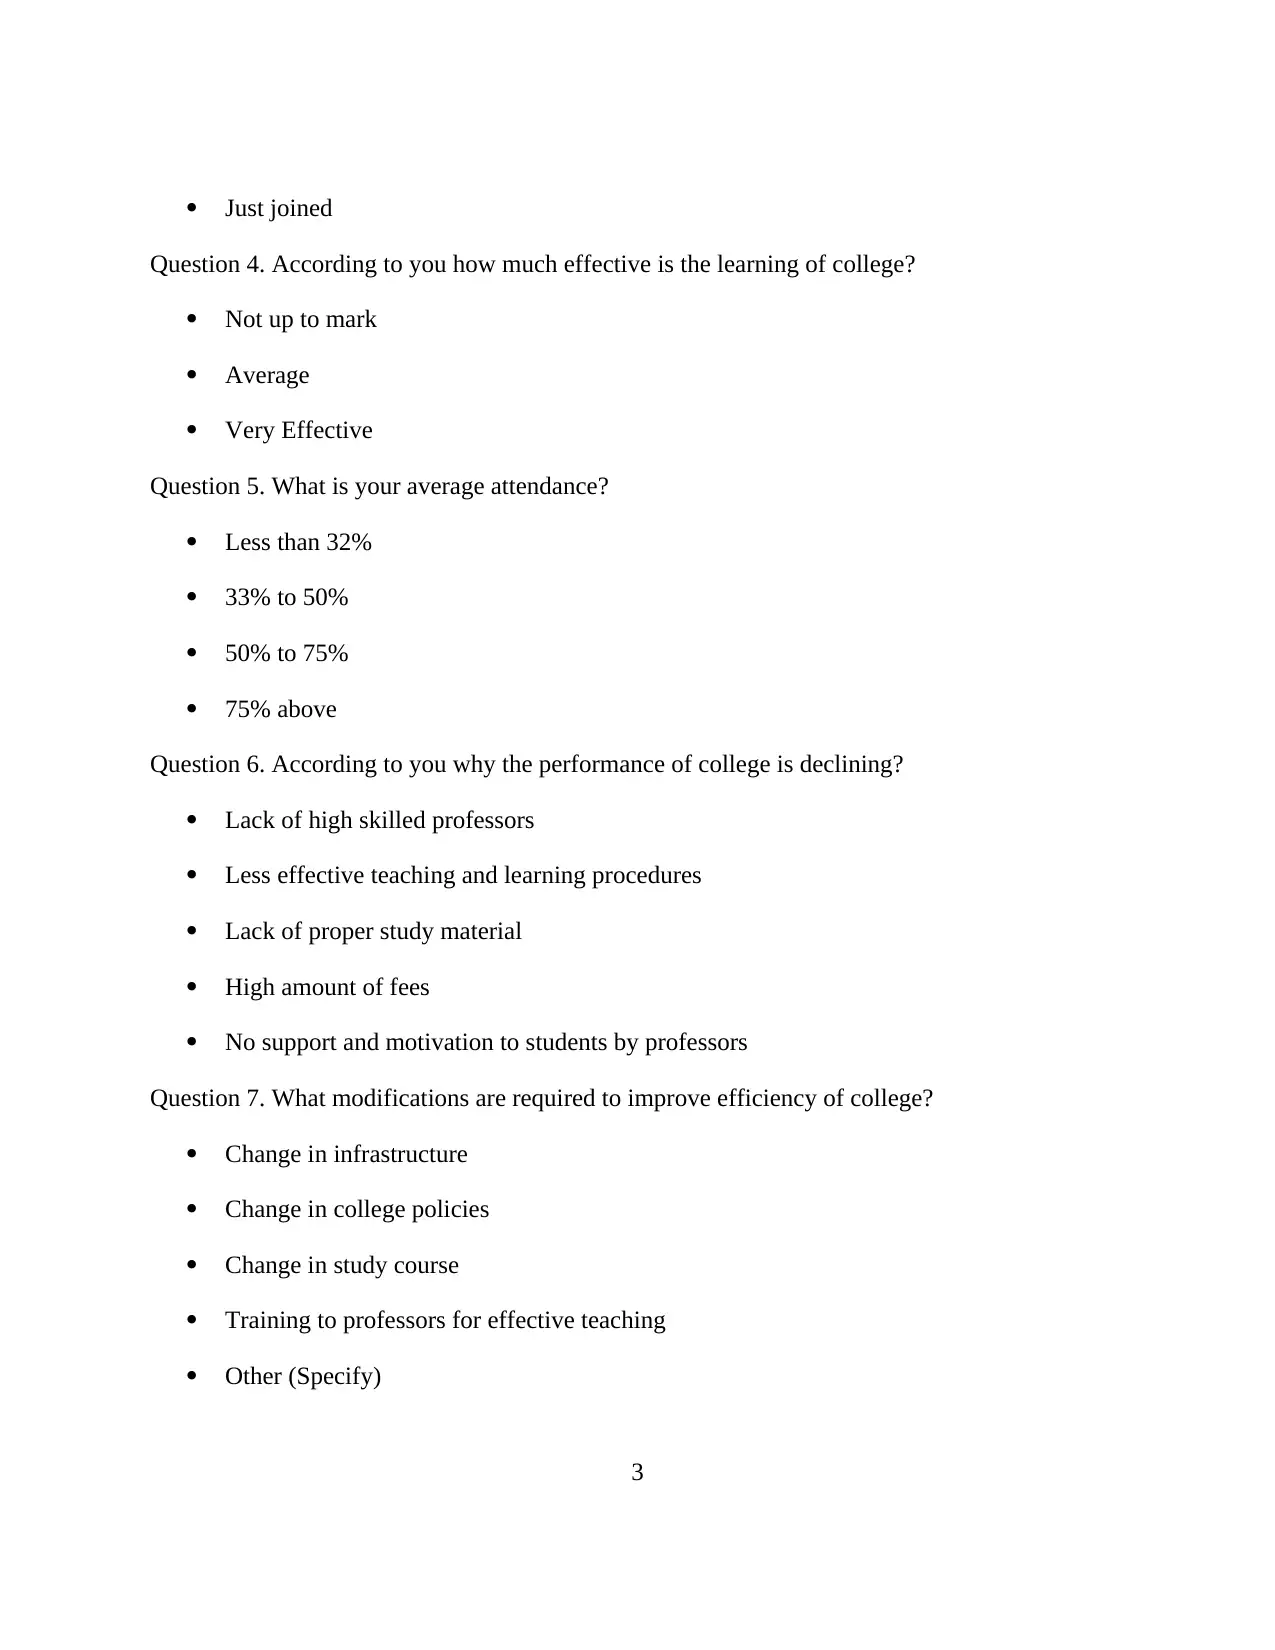
Question 4. According to you how much effective is the learning of college?
Not up to mark
Average
Very Effective
Question 5. What is your average attendance?
Less than 32%
33% to 50%
50% to 75%
75% above
Question 6. According to you why the performance of college is declining?
Lack of high skilled professors
Less effective teaching and learning procedures
Lack of proper study material
High amount of fees
No support and motivation to students by professors
Question 7. What modifications are required to improve efficiency of college?
Change in infrastructure
Change in college policies
Change in study course
Training to professors for effective teaching
Other (Specify)
3
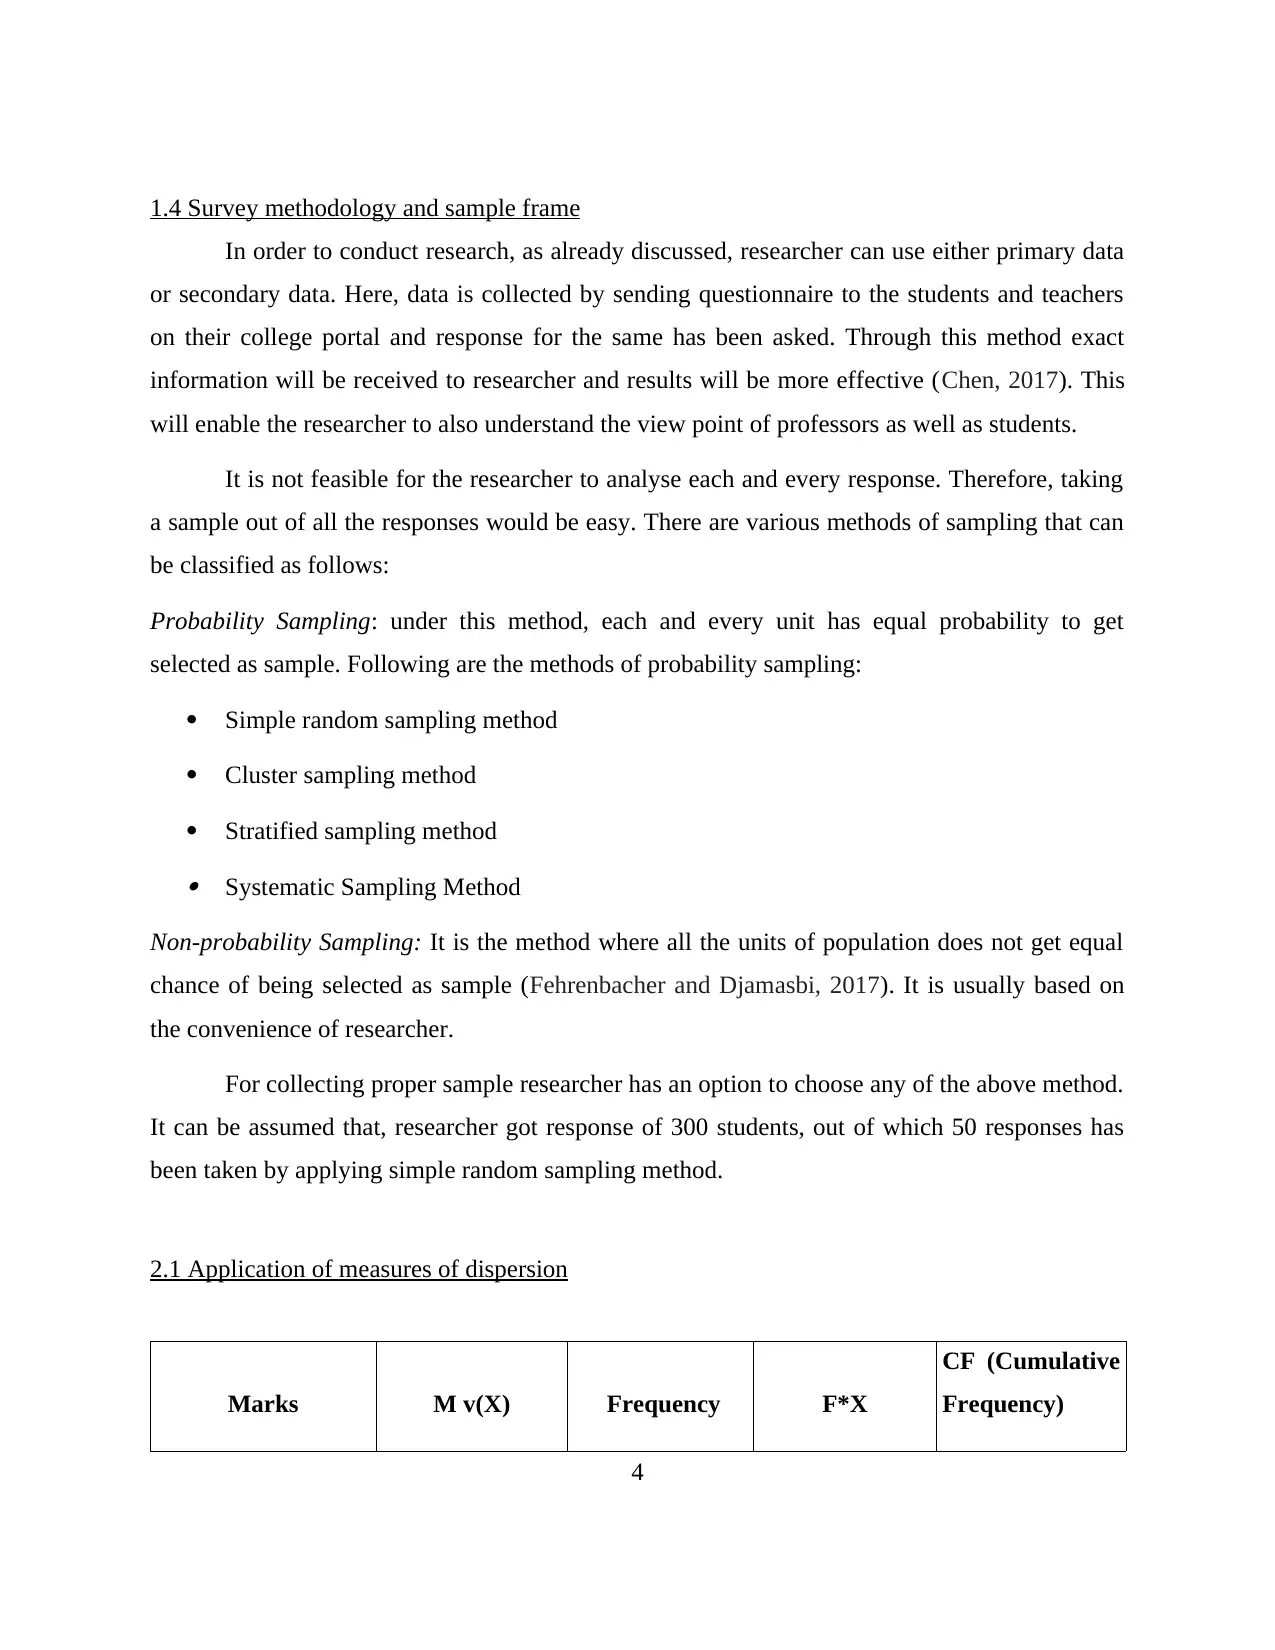
1.4 Survey methodology and sample frame
In order to conduct research, as already discussed, researcher can use either primary data
or secondary data. Here, data is collected by sending questionnaire to the students and teachers
on their college portal and response for the same has been asked. Through this method exact
information will be received to researcher and results will be more effective (Chen, 2017). This
will enable the researcher to also understand the view point of professors as well as students.
It is not feasible for the researcher to analyse each and every response. Therefore, taking
a sample out of all the responses would be easy. There are various methods of sampling that can
be classified as follows:
Probability Sampling: under this method, each and every unit has equal probability to get
selected as sample. Following are the methods of probability sampling:
Simple random sampling method
Cluster sampling method
Stratified sampling method Systematic Sampling Method
Non-probability Sampling: It is the method where all the units of population does not get equal
chance of being selected as sample (Fehrenbacher and Djamasbi, 2017). It is usually based on
the convenience of researcher.
For collecting proper sample researcher has an option to choose any of the above method.
It can be assumed that, researcher got response of 300 students, out of which 50 responses has
been taken by applying simple random sampling method.
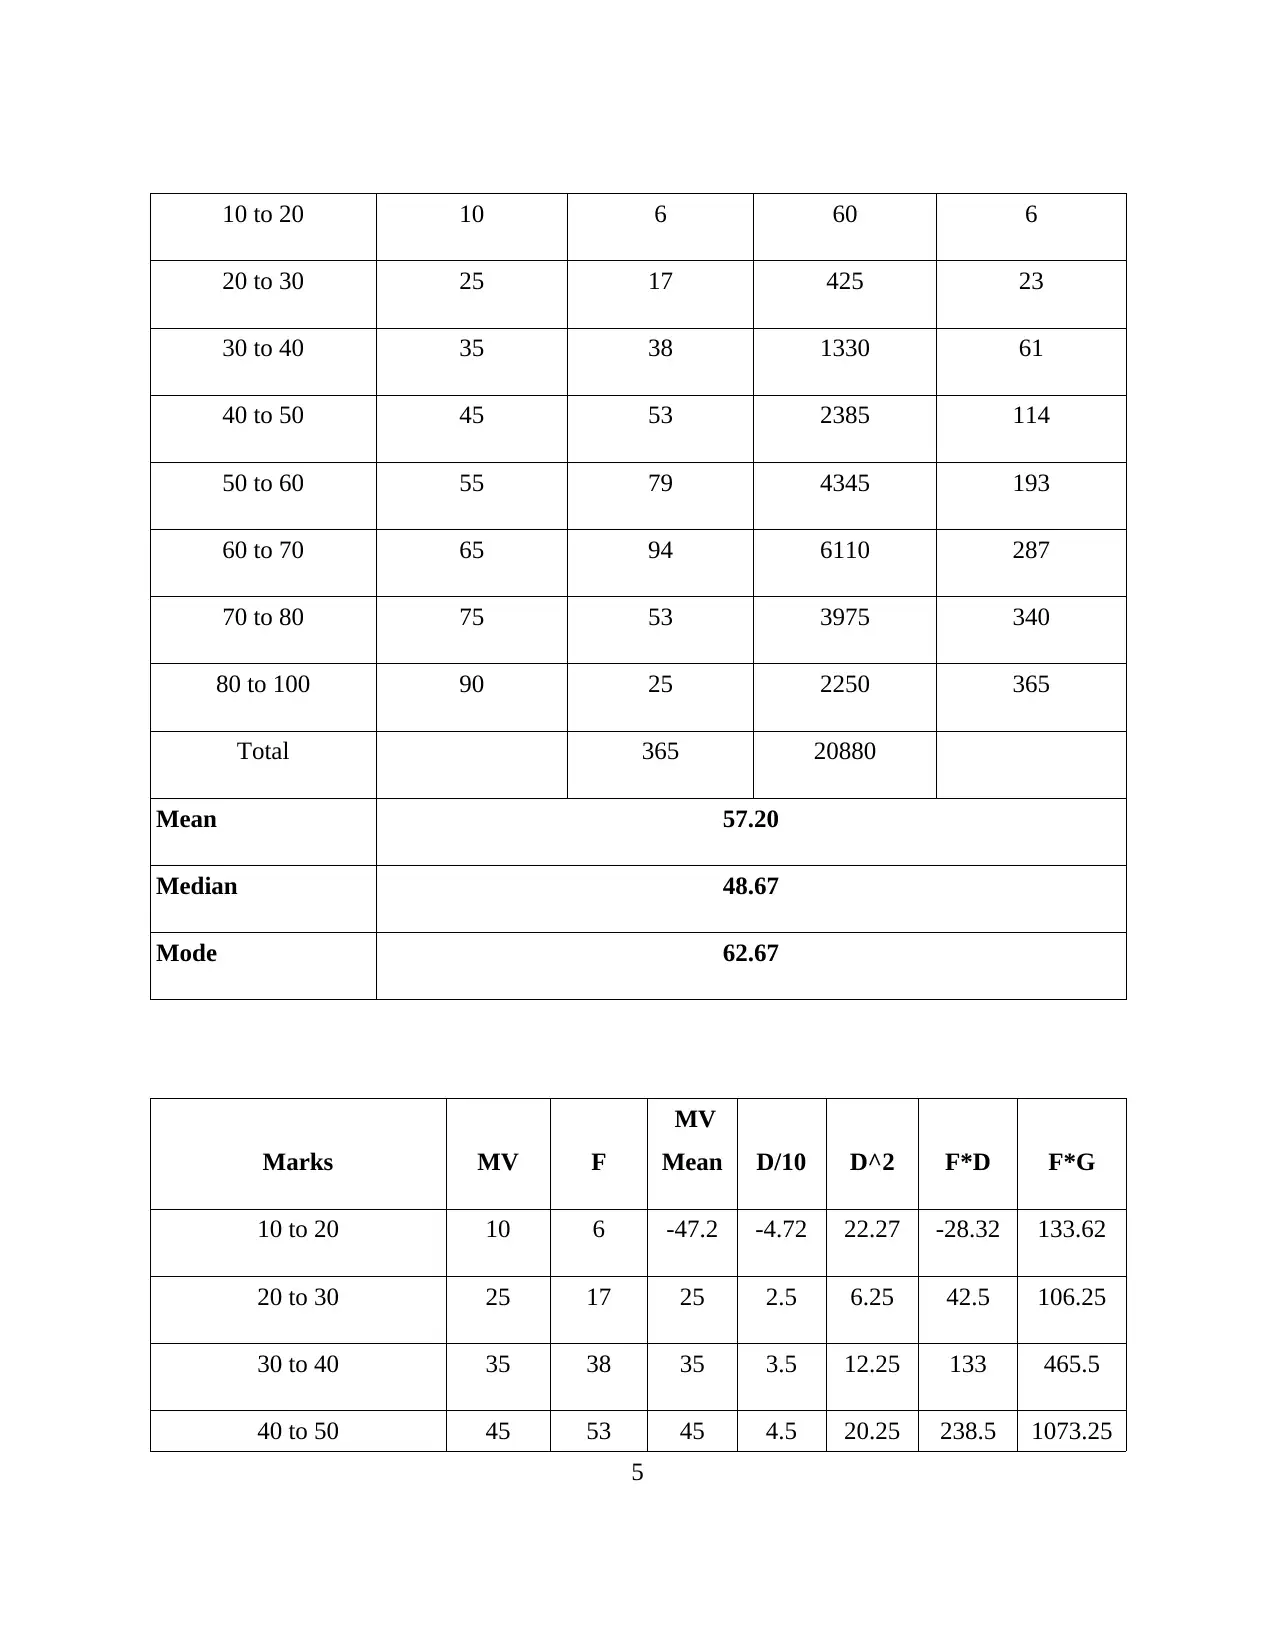
2.1 Application of measures of dispersion
Marks M v(X) Frequency F*X
CF (Cumulative
Frequency)
4
In order to conduct research, as already discussed, researcher can use either primary data
or secondary data. Here, data is collected by sending questionnaire to the students and teachers
on their college portal and response for the same has been asked. Through this method exact
information will be received to researcher and results will be more effective (Chen, 2017). This
will enable the researcher to also understand the view point of professors as well as students.
It is not feasible for the researcher to analyse each and every response. Therefore, taking
a sample out of all the responses would be easy. There are various methods of sampling that can
be classified as follows:
Probability Sampling: under this method, each and every unit has equal probability to get
selected as sample. Following are the methods of probability sampling:
Simple random sampling method
Cluster sampling method
Stratified sampling method Systematic Sampling Method
Non-probability Sampling: It is the method where all the units of population does not get equal
chance of being selected as sample (Fehrenbacher and Djamasbi, 2017). It is usually based on
the convenience of researcher.
For collecting proper sample researcher has an option to choose any of the above method.
It can be assumed that, researcher got response of 300 students, out of which 50 responses has
been taken by applying simple random sampling method.
2.1 Application of measures of dispersion
Marks M v(X) Frequency F*X
CF (Cumulative
Frequency)
4
⊘ This is a preview!⊘
Do you want full access?
Subscribe today to unlock all pages.
Trusted by 1+ million students worldwide
10 to 20 10 6 60 6
20 to 30 25 17 425 23
30 to 40 35 38 1330 61
40 to 50 45 53 2385 114
50 to 60 55 79 4345 193
60 to 70 65 94 6110 287
70 to 80 75 53 3975 340
80 to 100 90 25 2250 365
Total 365 20880
Mean 57.20
Median 48.67
Mode 62.67
Marks MV F
MV
Mean D/10 D^2 F*D F*G
10 to 20 10 6 -47.2 -4.72 22.27 -28.32 133.62
20 to 30 25 17 25 2.5 6.25 42.5 106.25
30 to 40 35 38 35 3.5 12.25 133 465.5
40 to 50 45 53 45 4.5 20.25 238.5 1073.25
5
Paraphrase This Document
Need a fresh take? Get an instant paraphrase of this document with our AI Paraphraser
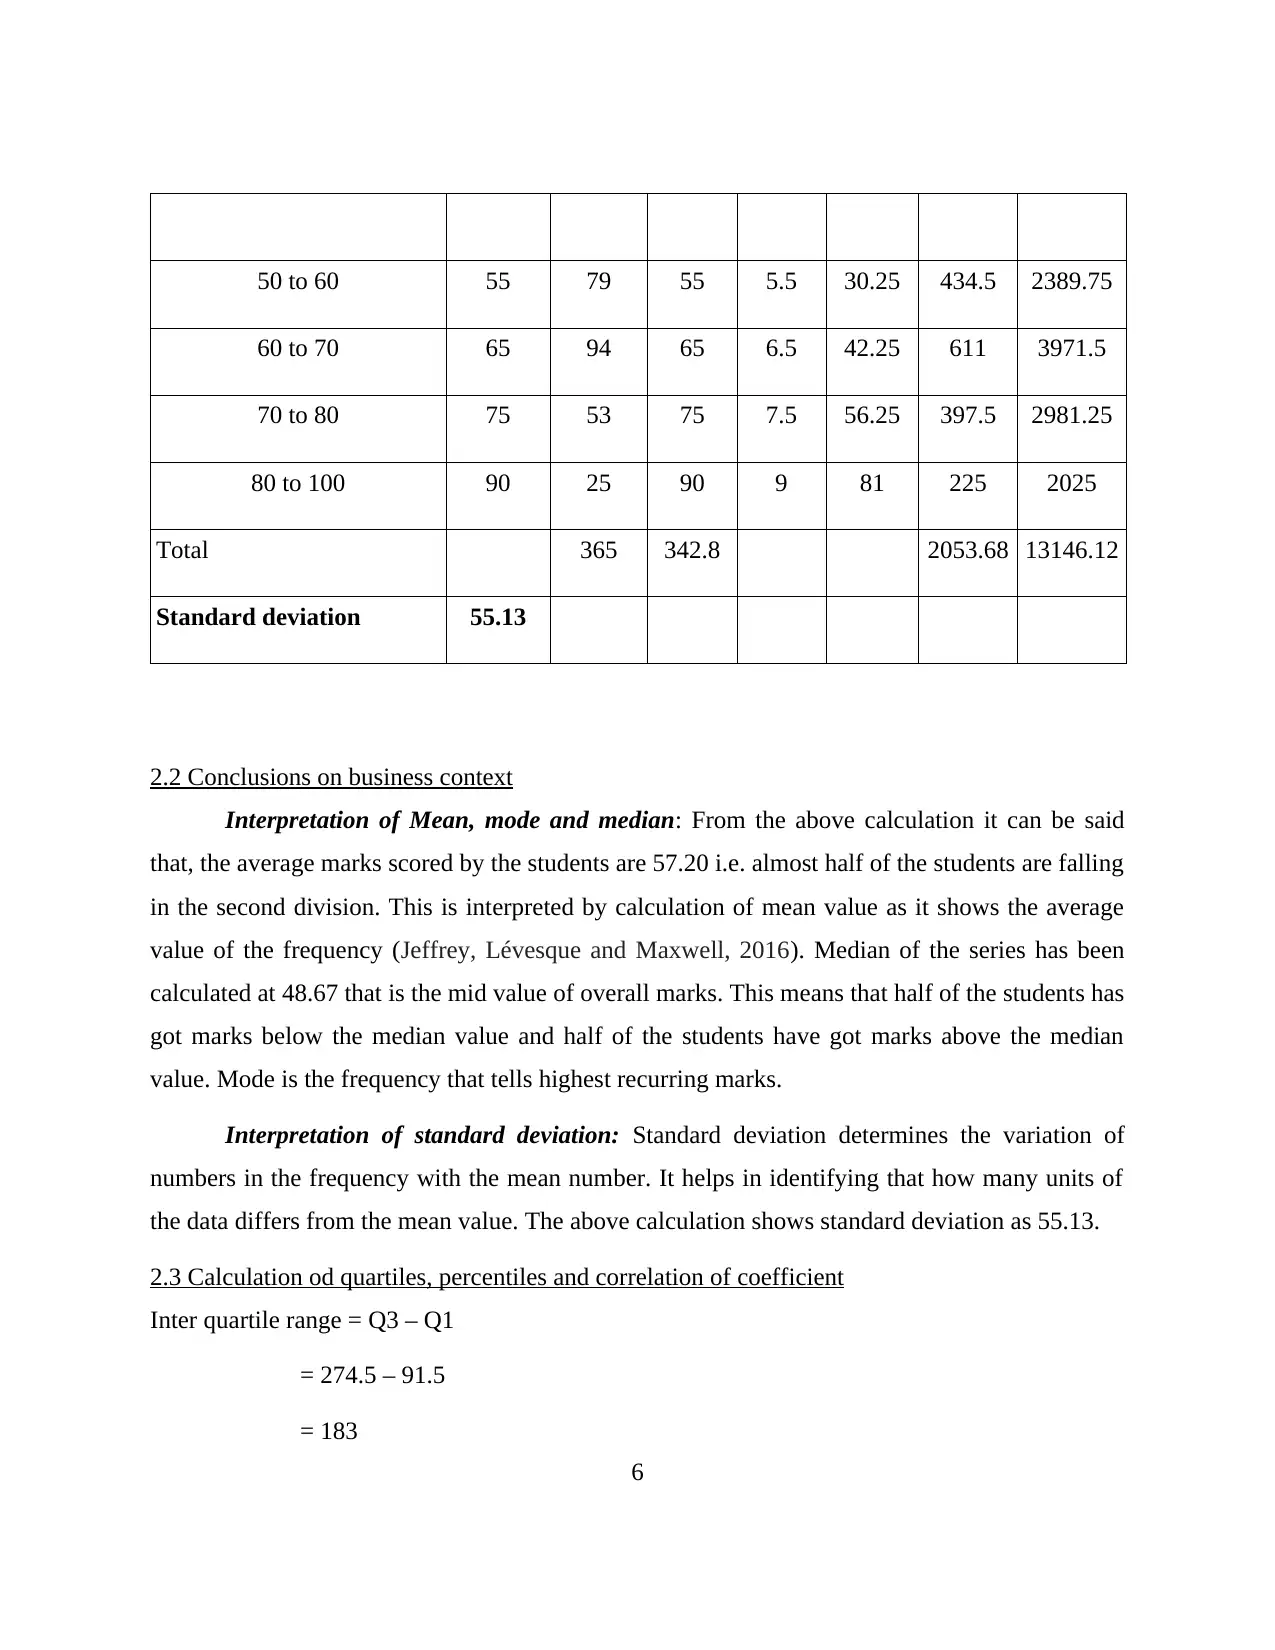
50 to 60 55 79 55 5.5 30.25 434.5 2389.75
60 to 70 65 94 65 6.5 42.25 611 3971.5
70 to 80 75 53 75 7.5 56.25 397.5 2981.25
80 to 100 90 25 90 9 81 225 2025
Total 365 342.8 2053.68 13146.12
Standard deviation 55.13
2.2 Conclusions on business context
Interpretation of Mean, mode and median: From the above calculation it can be said
that, the average marks scored by the students are 57.20 i.e. almost half of the students are falling
in the second division. This is interpreted by calculation of mean value as it shows the average
value of the frequency (Jeffrey, Lévesque and Maxwell, 2016). Median of the series has been
calculated at 48.67 that is the mid value of overall marks. This means that half of the students has
got marks below the median value and half of the students have got marks above the median
value. Mode is the frequency that tells highest recurring marks.
Interpretation of standard deviation: Standard deviation determines the variation of
numbers in the frequency with the mean number. It helps in identifying that how many units of
the data differs from the mean value. The above calculation shows standard deviation as 55.13.
2.3 Calculation od quartiles, percentiles and correlation of coefficient
Inter quartile range = Q3 – Q1
= 274.5 – 91.5
= 183
6
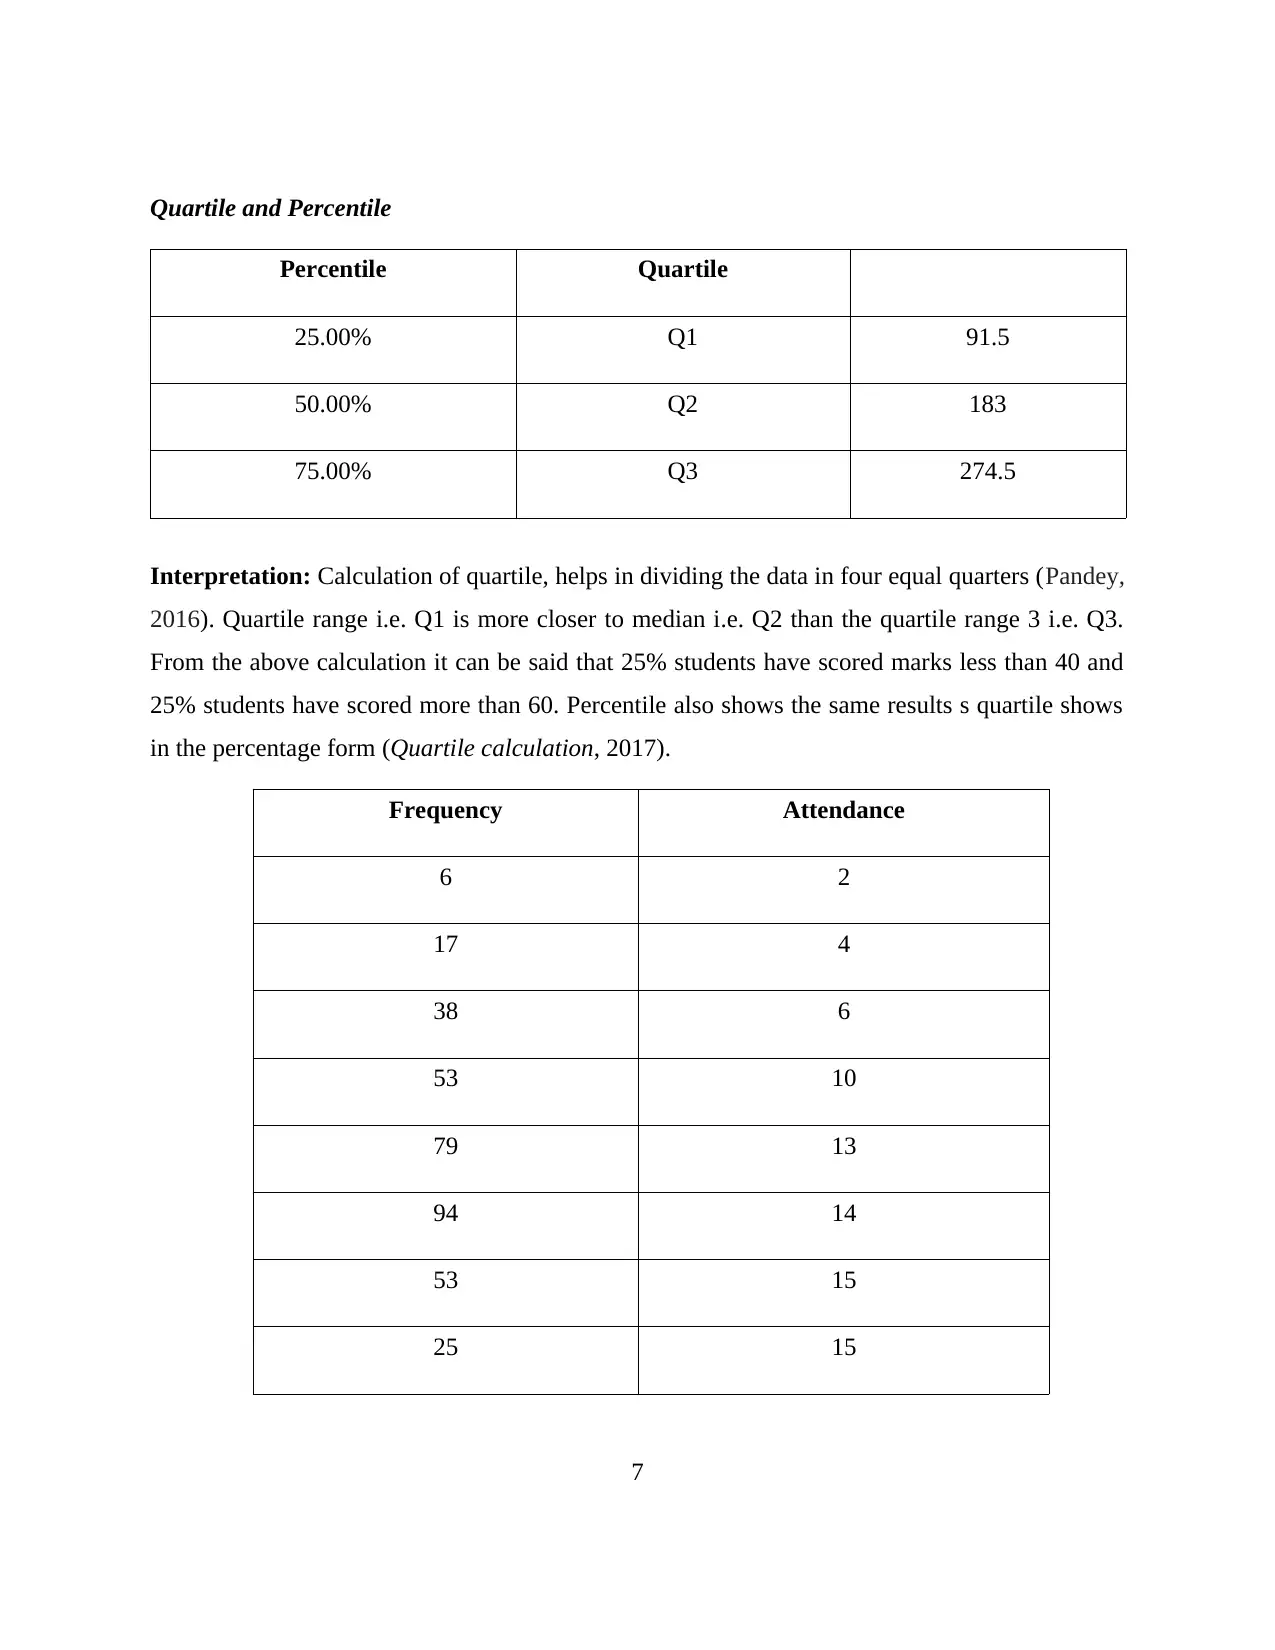
Quartile and Percentile
Percentile Quartile
25.00% Q1 91.5
50.00% Q2 183
75.00% Q3 274.5
Interpretation: Calculation of quartile, helps in dividing the data in four equal quarters (Pandey,
2016). Quartile range i.e. Q1 is more closer to median i.e. Q2 than the quartile range 3 i.e. Q3.
From the above calculation it can be said that 25% students have scored marks less than 40 and
25% students have scored more than 60. Percentile also shows the same results s quartile shows
in the percentage form (Quartile calculation, 2017).
Frequency Attendance
6 2
17 4
38 6
53 10
79 13
94 14
53 15
25 15
7
⊘ This is a preview!⊘
Do you want full access?
Subscribe today to unlock all pages.
Trusted by 1+ million students worldwide
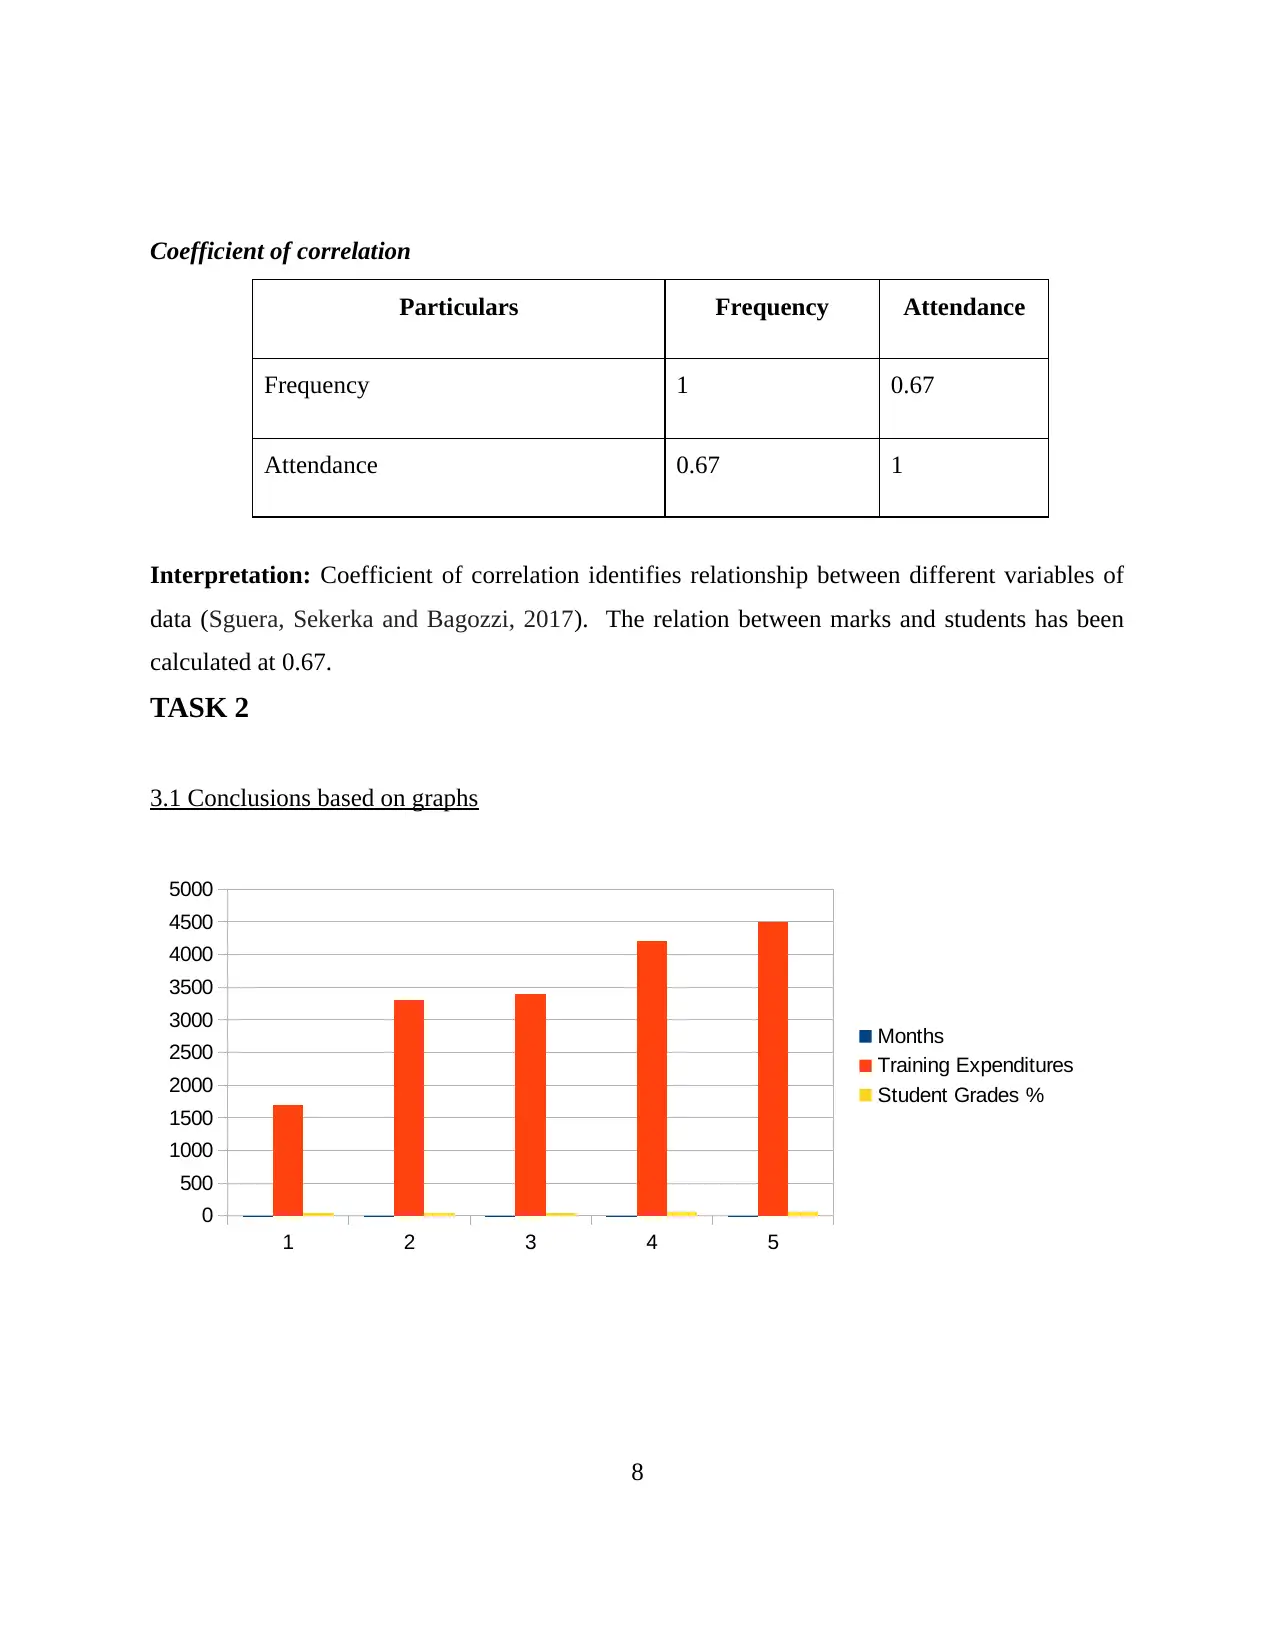
Coefficient of correlation
Particulars Frequency Attendance
Frequency 1 0.67
Attendance 0.67 1
Interpretation: Coefficient of correlation identifies relationship between different variables of
data (Sguera, Sekerka and Bagozzi, 2017). The relation between marks and students has been
calculated at 0.67.
TASK 2
3.1 Conclusions based on graphs
1 2 3 4 5
0
500
1000
1500
2000
2500
3000
3500
4000
4500
5000
Months
Training Expenditures
Student Grades %
8
Paraphrase This Document
Need a fresh take? Get an instant paraphrase of this document with our AI Paraphraser
1
2
3
4
5
0 500 1000 1500 2000 2500 3000 3500 4000 4500 5000
Student Grades %
Training Expenditures
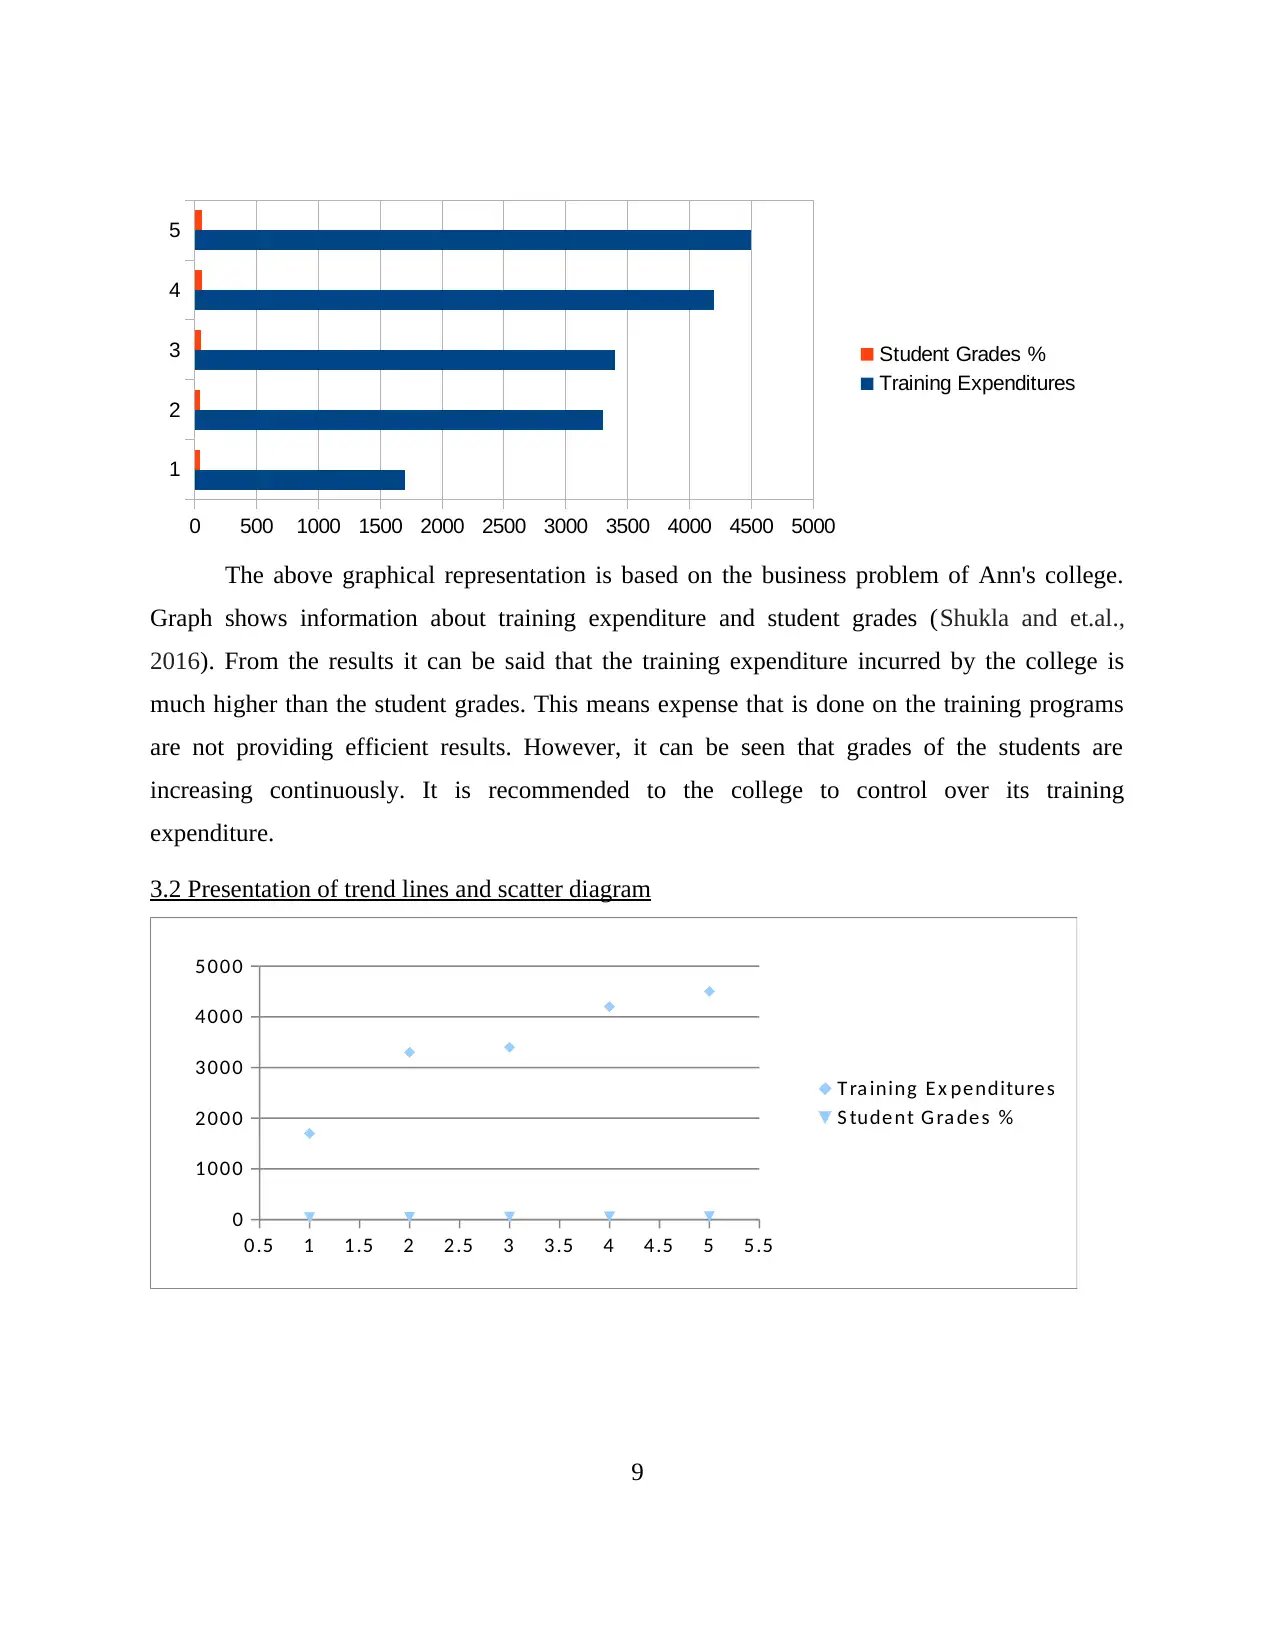
The above graphical representation is based on the business problem of Ann's college.
Graph shows information about training expenditure and student grades (Shukla and et.al.,
2016). From the results it can be said that the training expenditure incurred by the college is
much higher than the student grades. This means expense that is done on the training programs
are not providing efficient results. However, it can be seen that grades of the students are
increasing continuously. It is recommended to the college to control over its training
expenditure.
3.2 Presentation of trend lines and scatter diagram
0.5 1 1.5 2 2.5 3 3.5 4 4.5 5 5.5
0
1000
2000
3000
4000
5000
T ra ining E x penditure s
S tude nt G ra de s %
9
2
3
4
5
0 500 1000 1500 2000 2500 3000 3500 4000 4500 5000
Student Grades %
Training Expenditures
The above graphical representation is based on the business problem of Ann's college.
Graph shows information about training expenditure and student grades (Shukla and et.al.,
2016). From the results it can be said that the training expenditure incurred by the college is
much higher than the student grades. This means expense that is done on the training programs
are not providing efficient results. However, it can be seen that grades of the students are
increasing continuously. It is recommended to the college to control over its training
expenditure.
3.2 Presentation of trend lines and scatter diagram
0.5 1 1.5 2 2.5 3 3.5 4 4.5 5 5.5
0
1000
2000
3000
4000
5000
T ra ining E x penditure s
S tude nt G ra de s %
9
1 2 3 4 5
0
500
1000
1500
2000
2500
3000
3500
4000
4500
5000
Months
Training Expenditures
Student Grades %
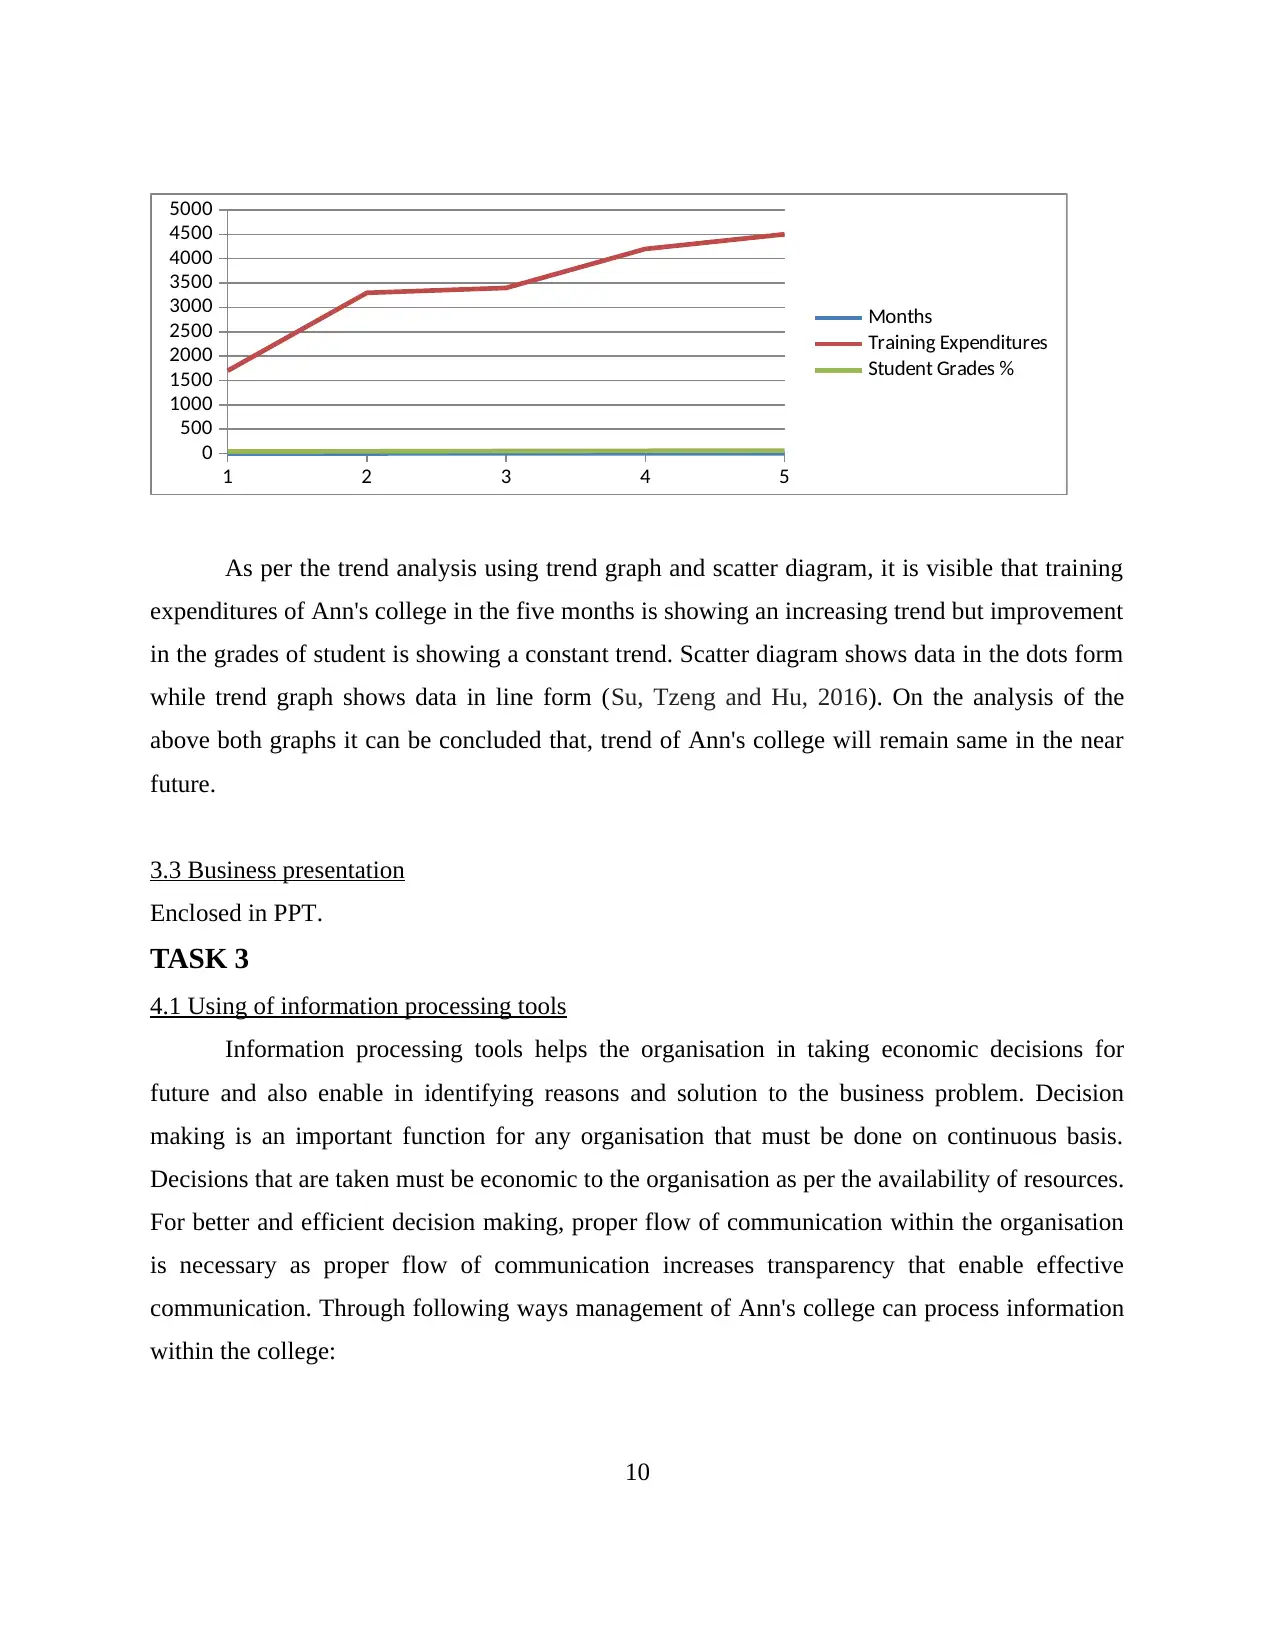
As per the trend analysis using trend graph and scatter diagram, it is visible that training
expenditures of Ann's college in the five months is showing an increasing trend but improvement
in the grades of student is showing a constant trend. Scatter diagram shows data in the dots form
while trend graph shows data in line form (Su, Tzeng and Hu, 2016). On the analysis of the
above both graphs it can be concluded that, trend of Ann's college will remain same in the near
future.
3.3 Business presentation
Enclosed in PPT.
TASK 3
4.1 Using of information processing tools
Information processing tools helps the organisation in taking economic decisions for
future and also enable in identifying reasons and solution to the business problem. Decision
making is an important function for any organisation that must be done on continuous basis.
Decisions that are taken must be economic to the organisation as per the availability of resources.
For better and efficient decision making, proper flow of communication within the organisation
is necessary as proper flow of communication increases transparency that enable effective
communication. Through following ways management of Ann's college can process information
within the college:
10
0
500
1000
1500
2000
2500
3000
3500
4000
4500
5000
Months
Training Expenditures
Student Grades %
As per the trend analysis using trend graph and scatter diagram, it is visible that training
expenditures of Ann's college in the five months is showing an increasing trend but improvement
in the grades of student is showing a constant trend. Scatter diagram shows data in the dots form
while trend graph shows data in line form (Su, Tzeng and Hu, 2016). On the analysis of the
above both graphs it can be concluded that, trend of Ann's college will remain same in the near
future.
3.3 Business presentation
Enclosed in PPT.
TASK 3
4.1 Using of information processing tools
Information processing tools helps the organisation in taking economic decisions for
future and also enable in identifying reasons and solution to the business problem. Decision
making is an important function for any organisation that must be done on continuous basis.
Decisions that are taken must be economic to the organisation as per the availability of resources.
For better and efficient decision making, proper flow of communication within the organisation
is necessary as proper flow of communication increases transparency that enable effective
communication. Through following ways management of Ann's college can process information
within the college:
10
⊘ This is a preview!⊘
Do you want full access?
Subscribe today to unlock all pages.
Trusted by 1+ million students worldwide
1 out of 18
Related Documents


Your All-in-One AI-Powered Toolkit for Academic Success.
+13062052269
info@desklib.com
Available 24*7 on WhatsApp / Email
![[object Object]](/_next/static/media/star-bottom.7253800d.svg)
Unlock your academic potential
Copyright © 2020–2026 A2Z Services. All Rights Reserved. Developed and managed by ZUCOL.