Queen Bee Beauty: Comprehensive Business Plan and Analysis Report
VerifiedAdded on 2023/06/04
|11
|823
|478
Project
AI Summary
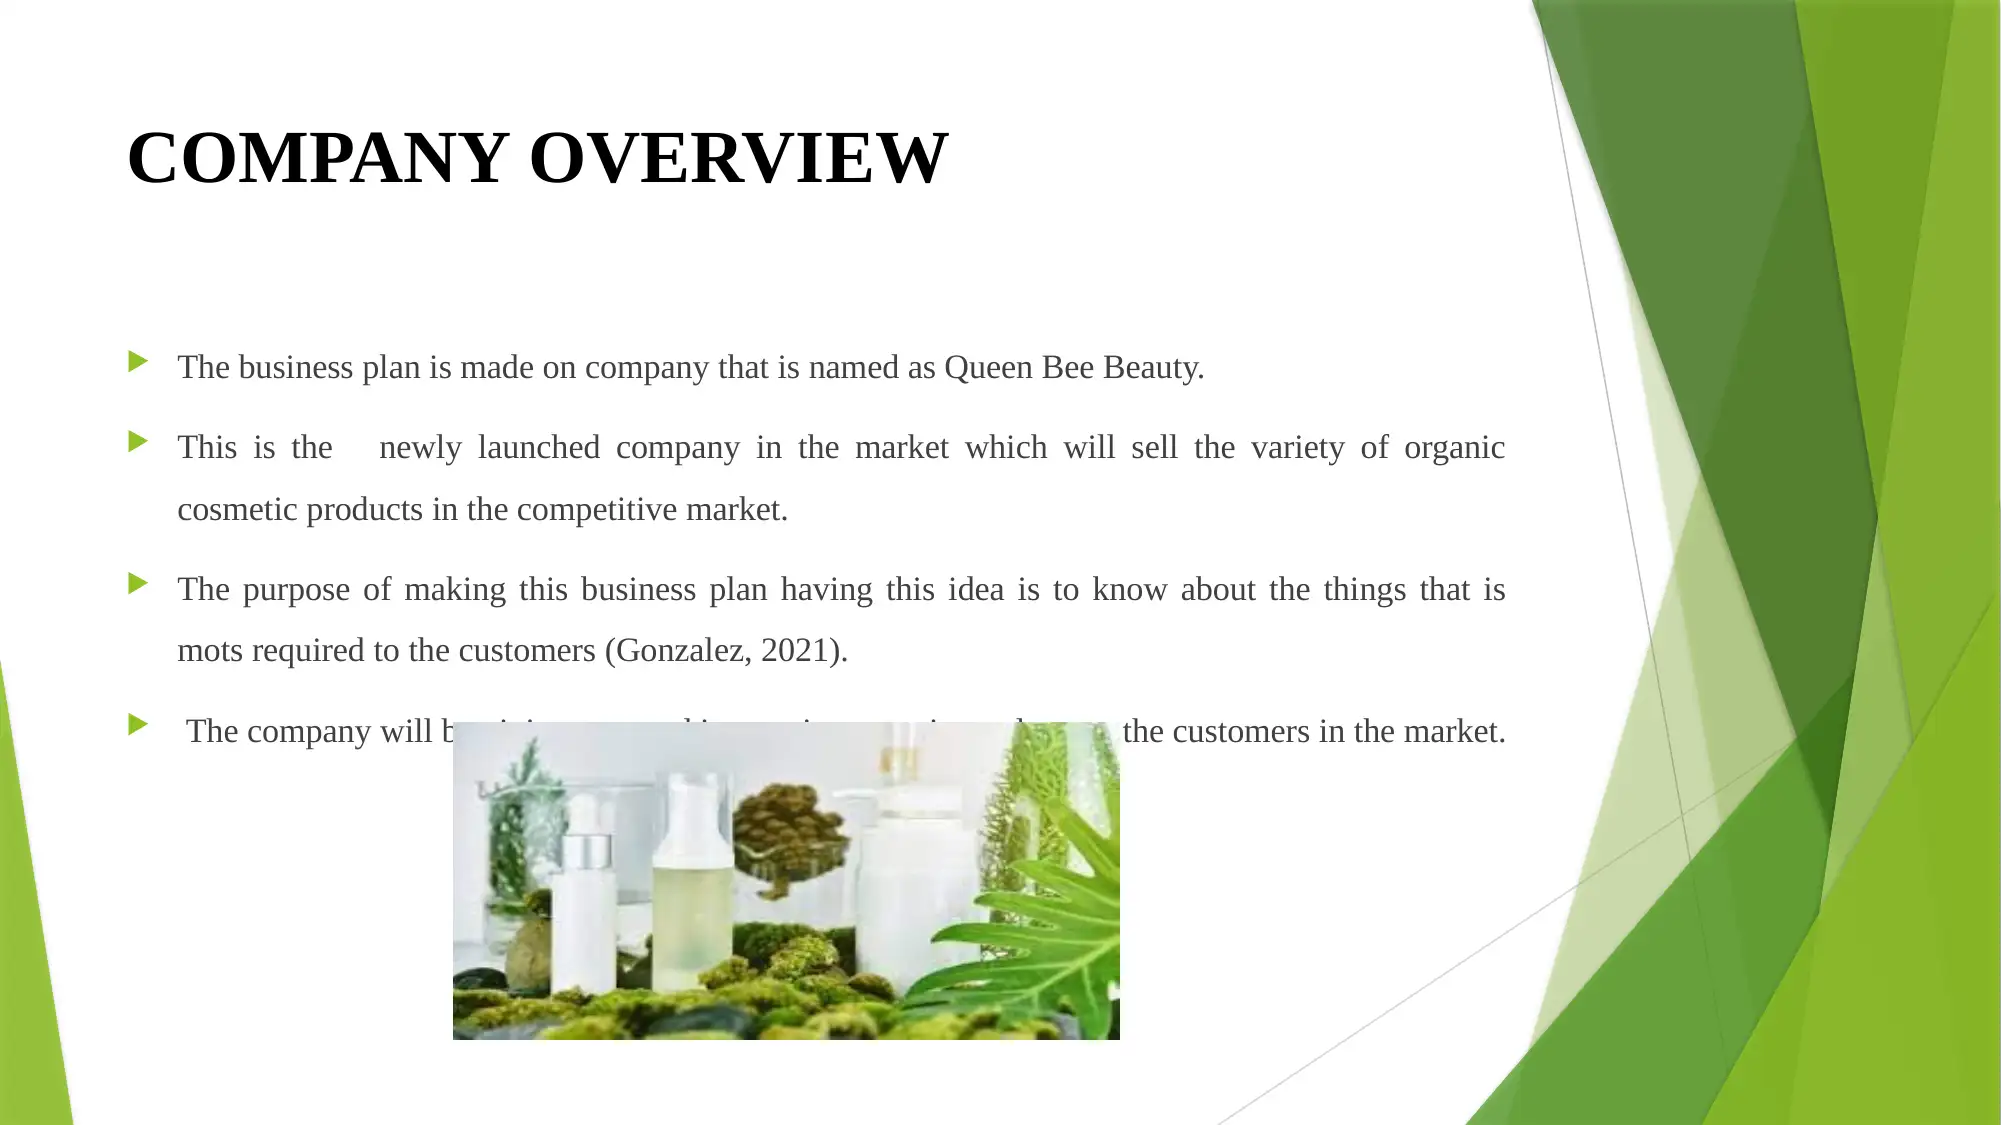
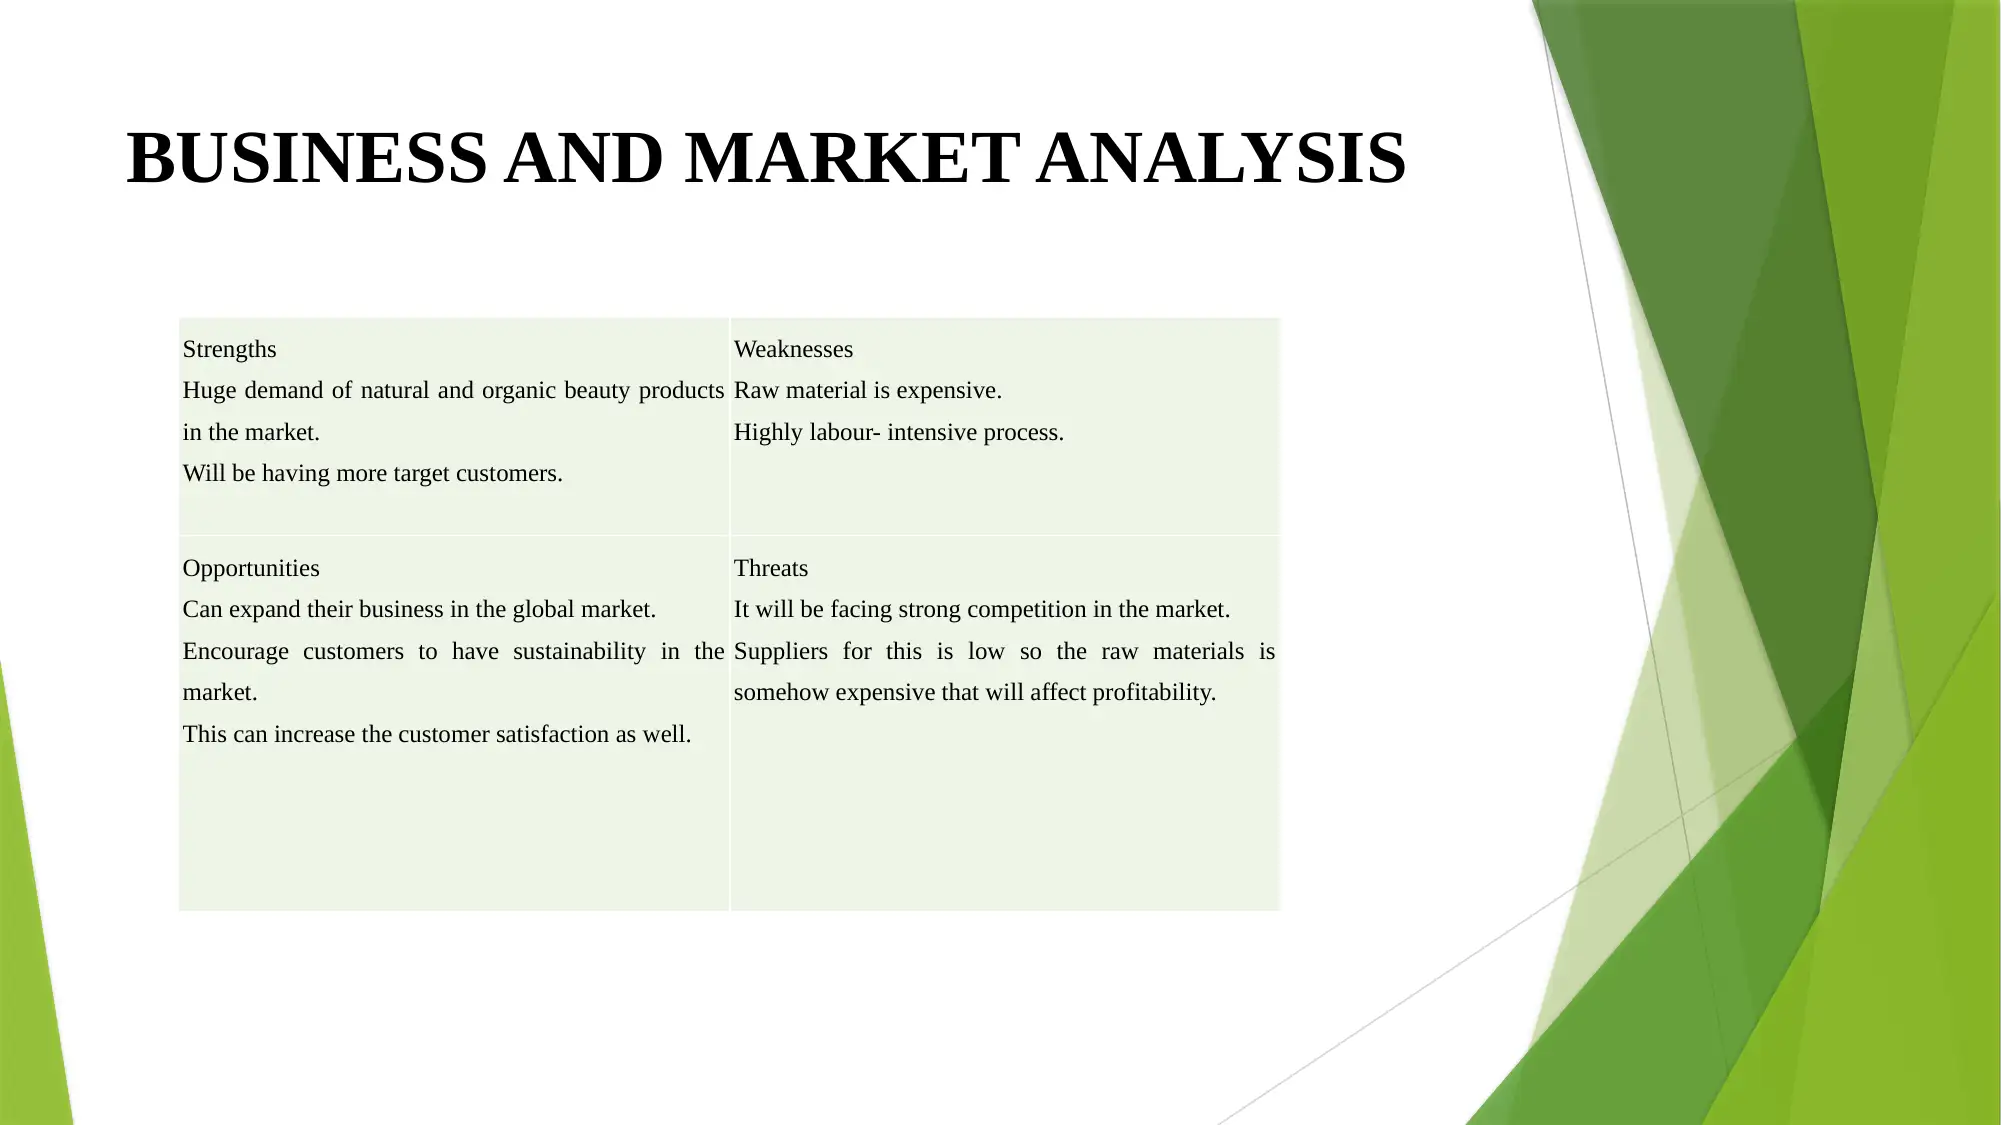
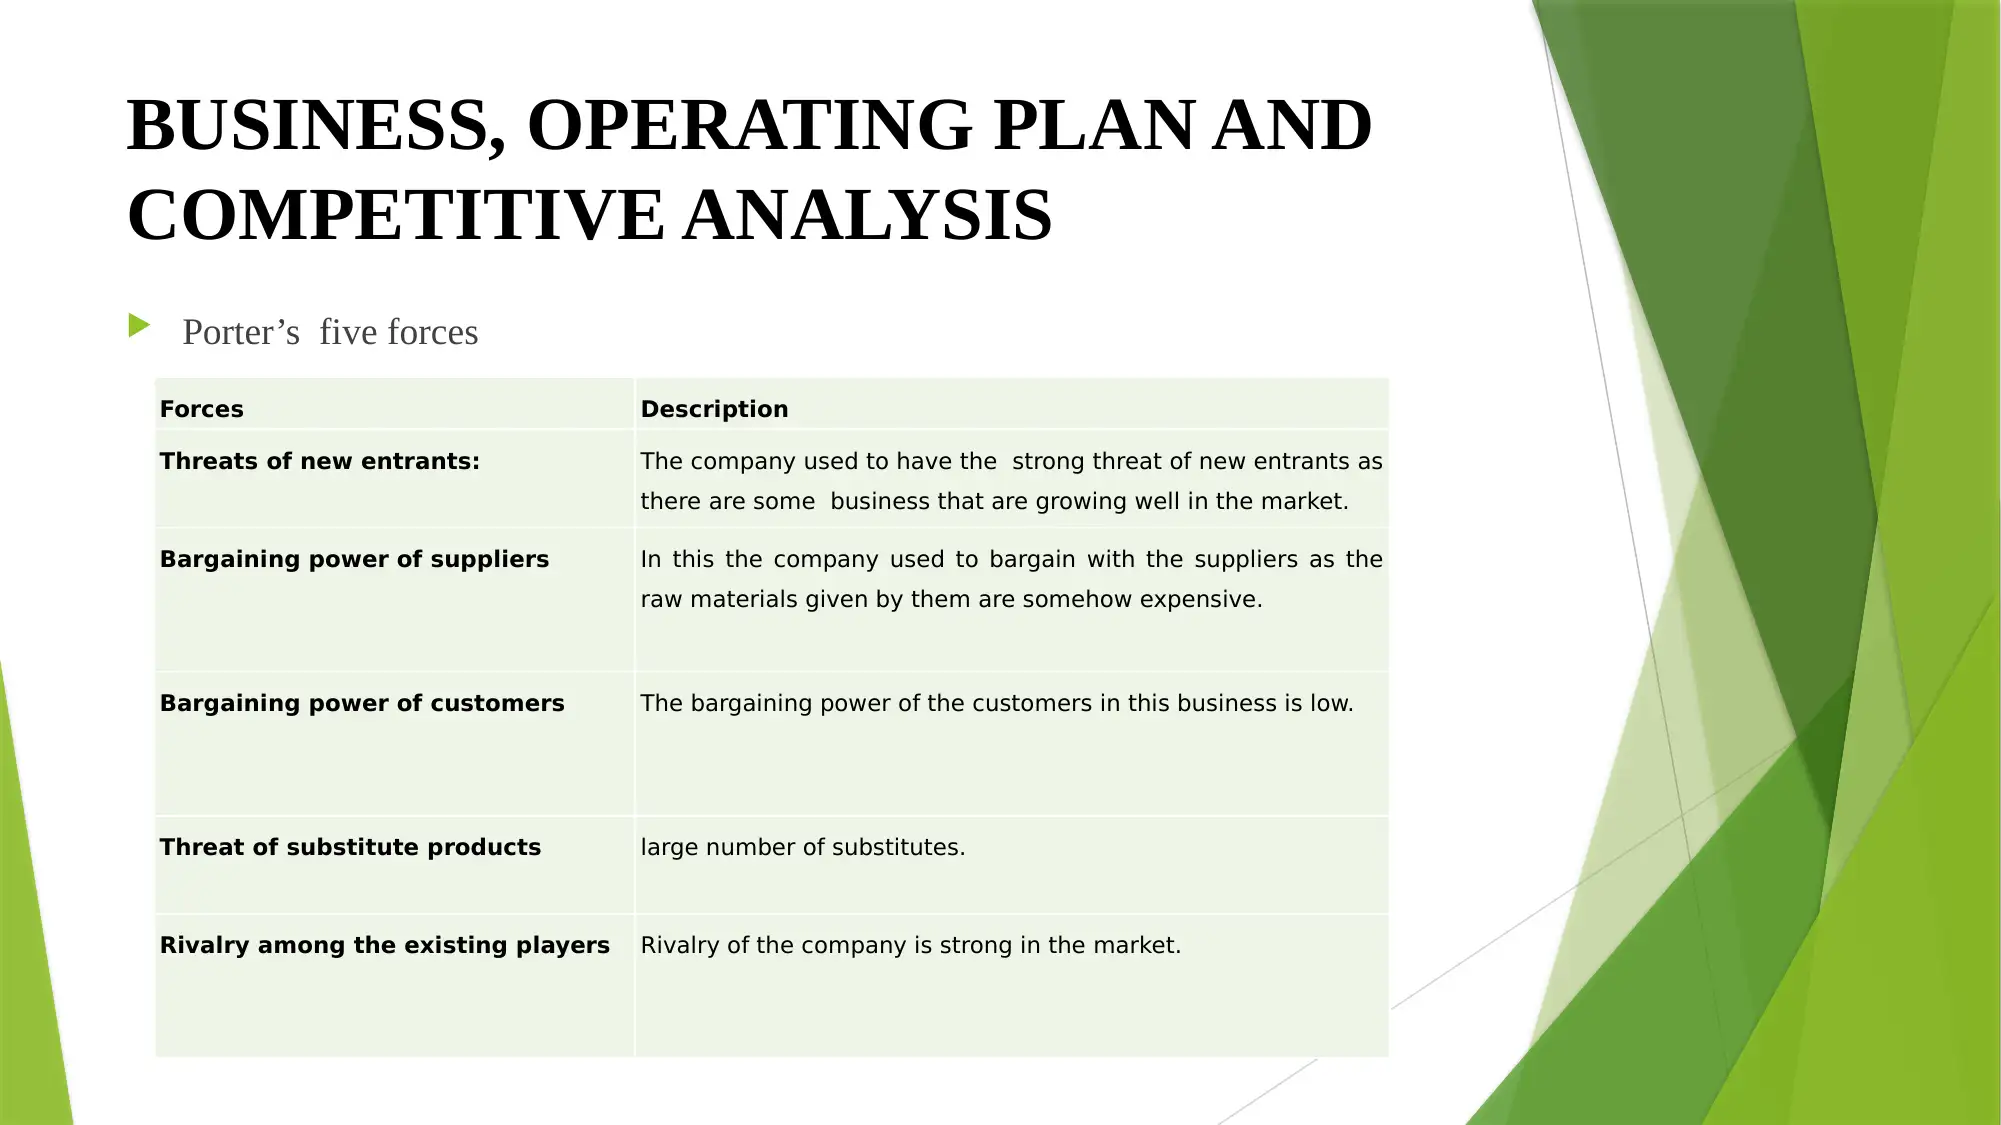
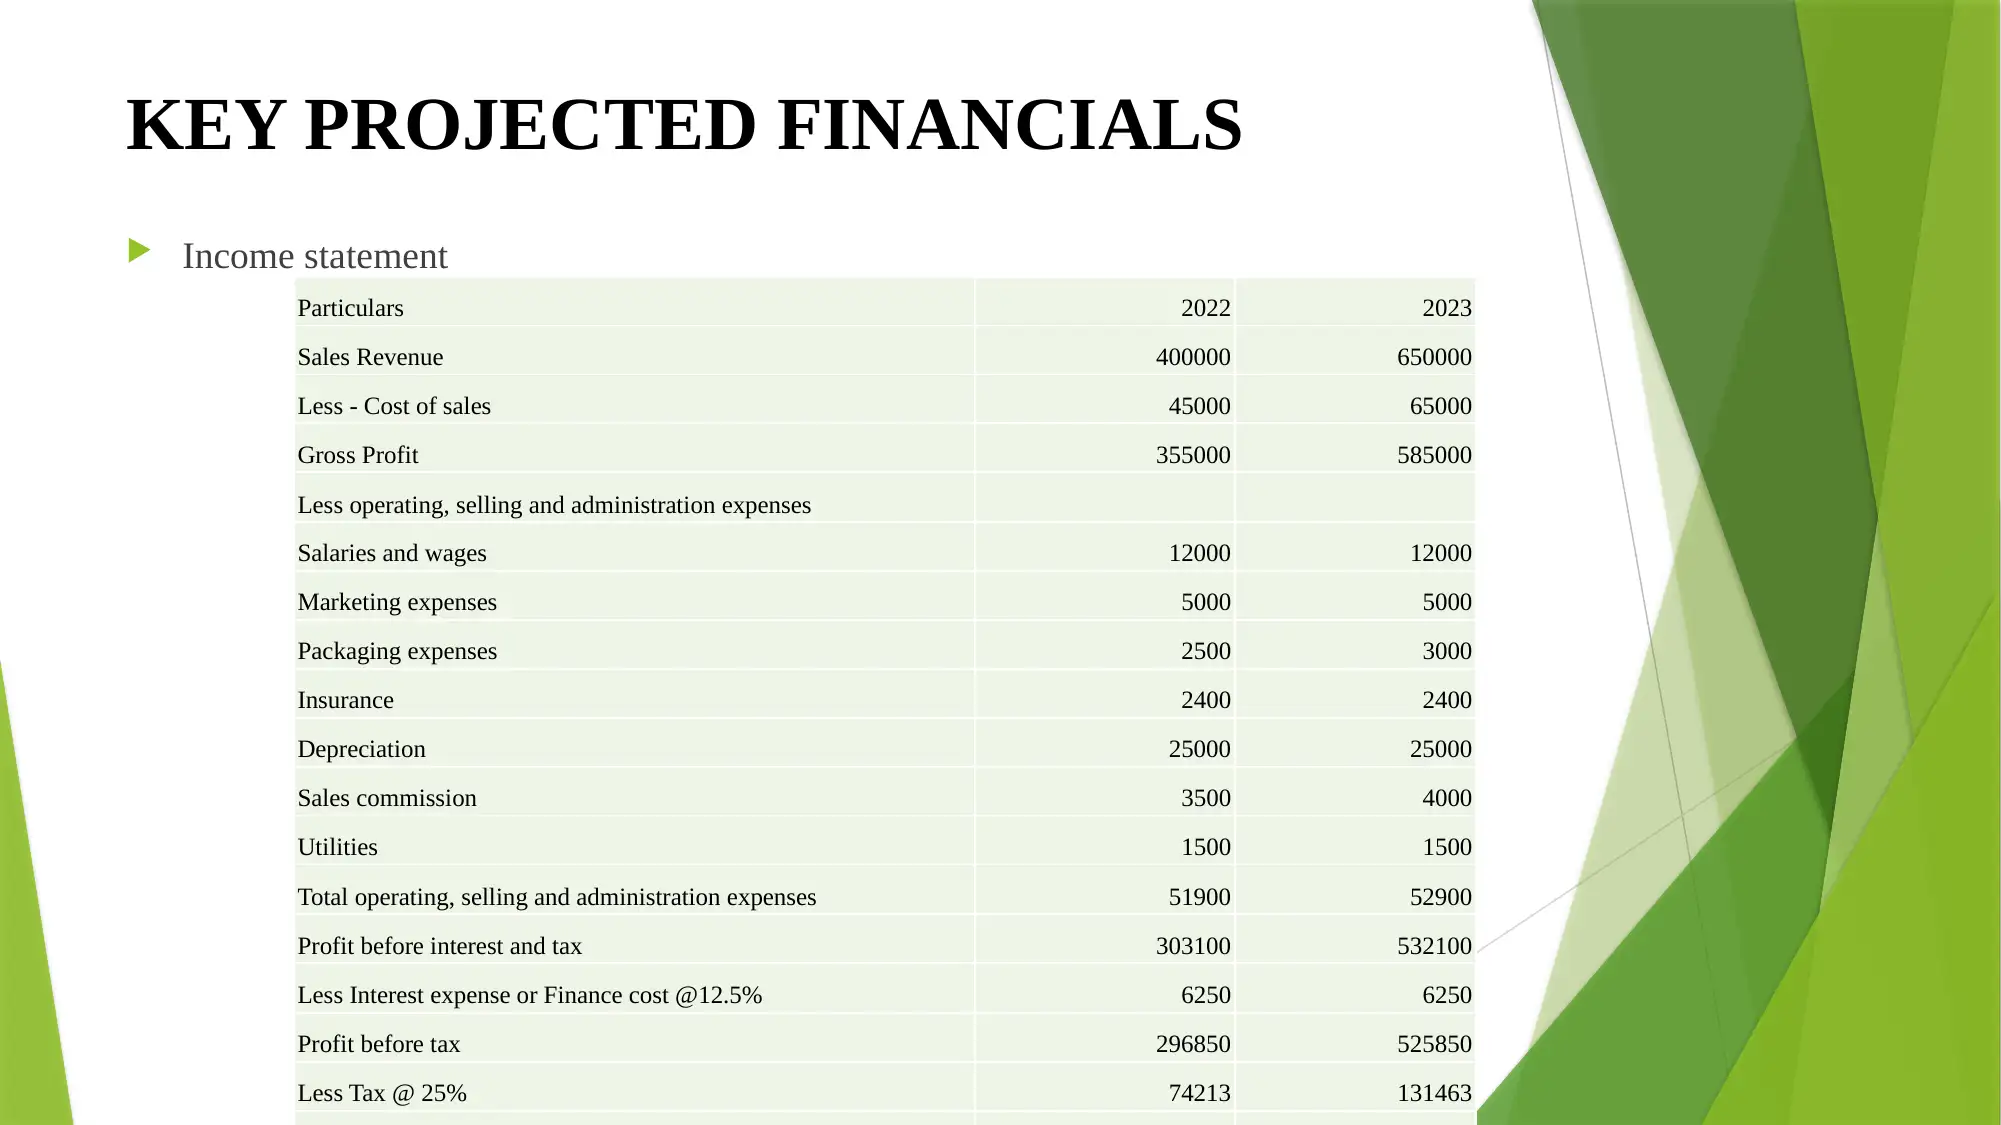
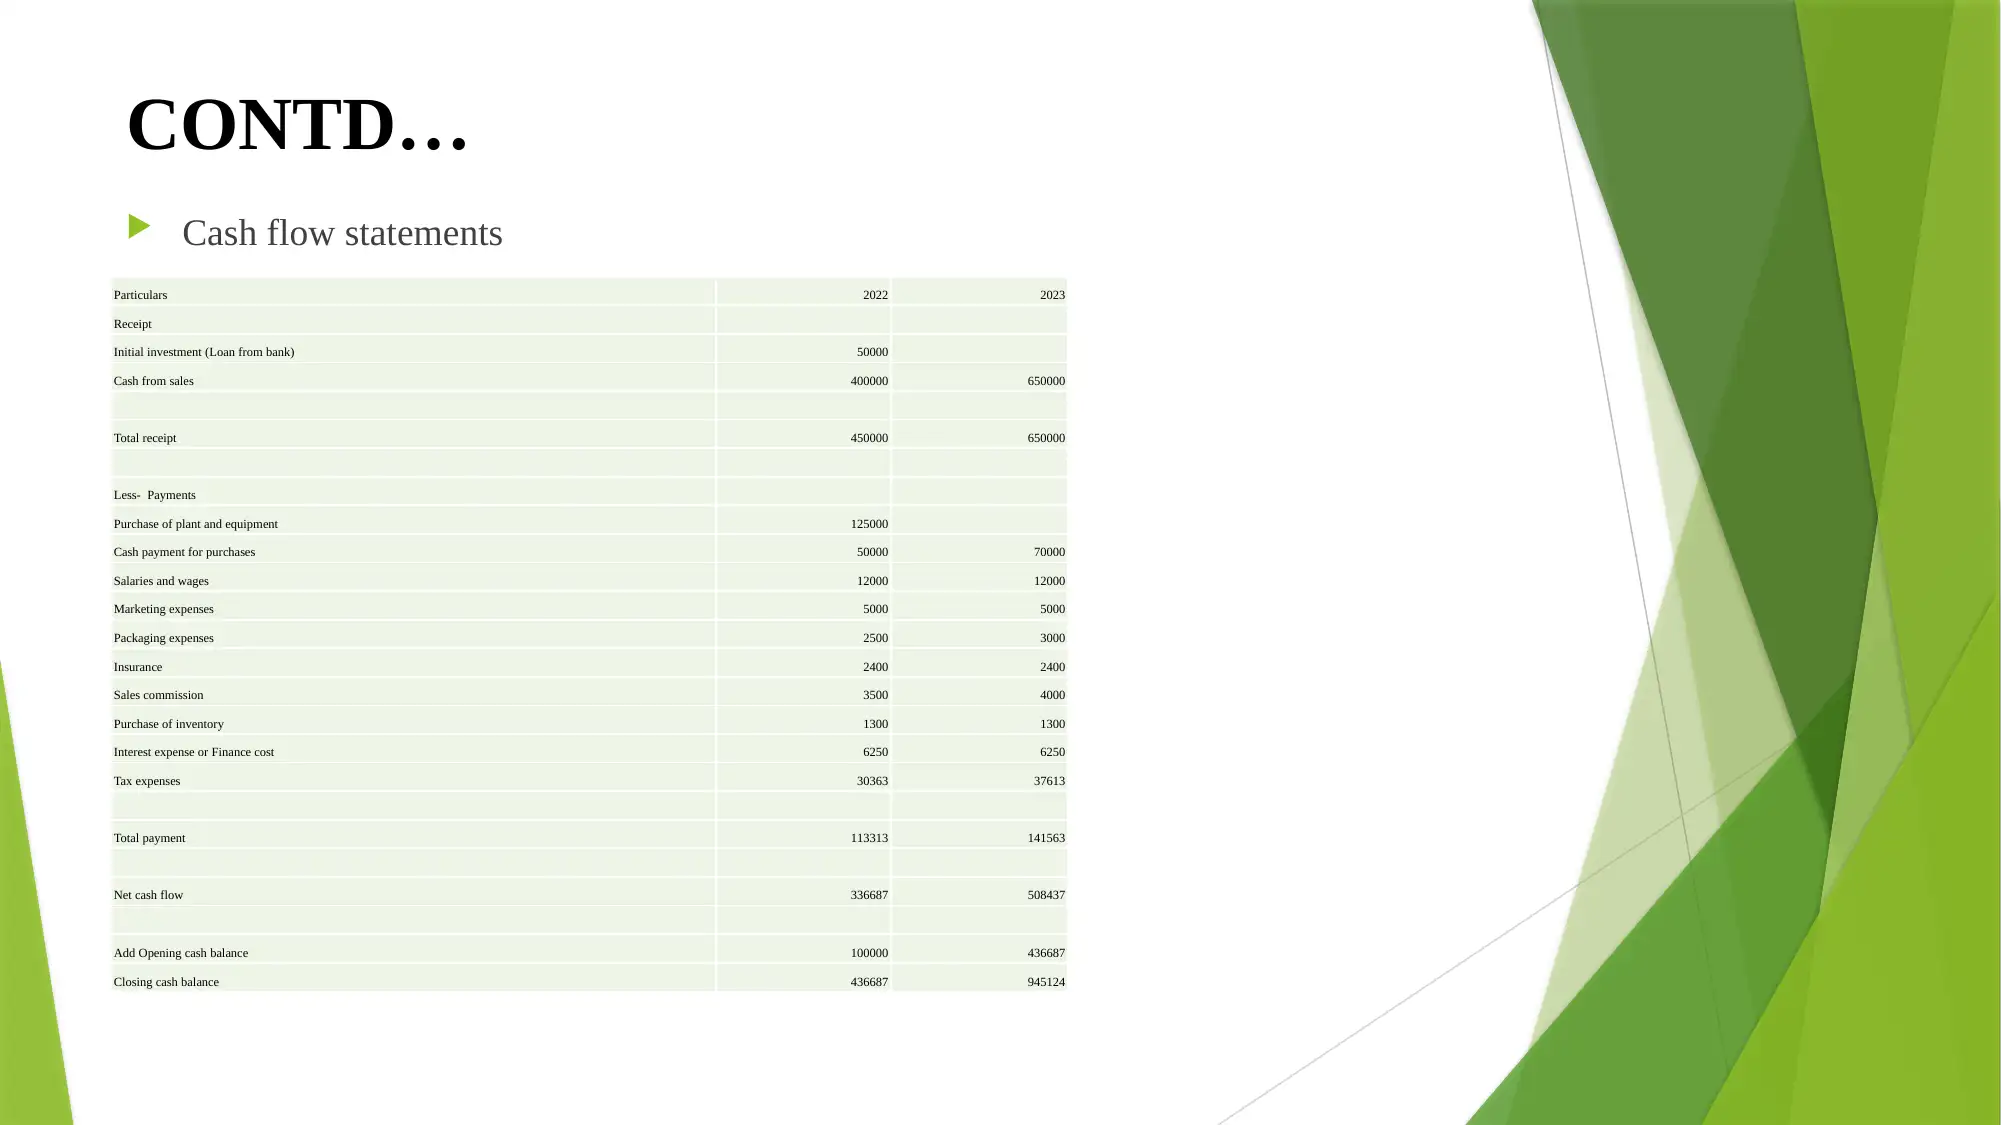
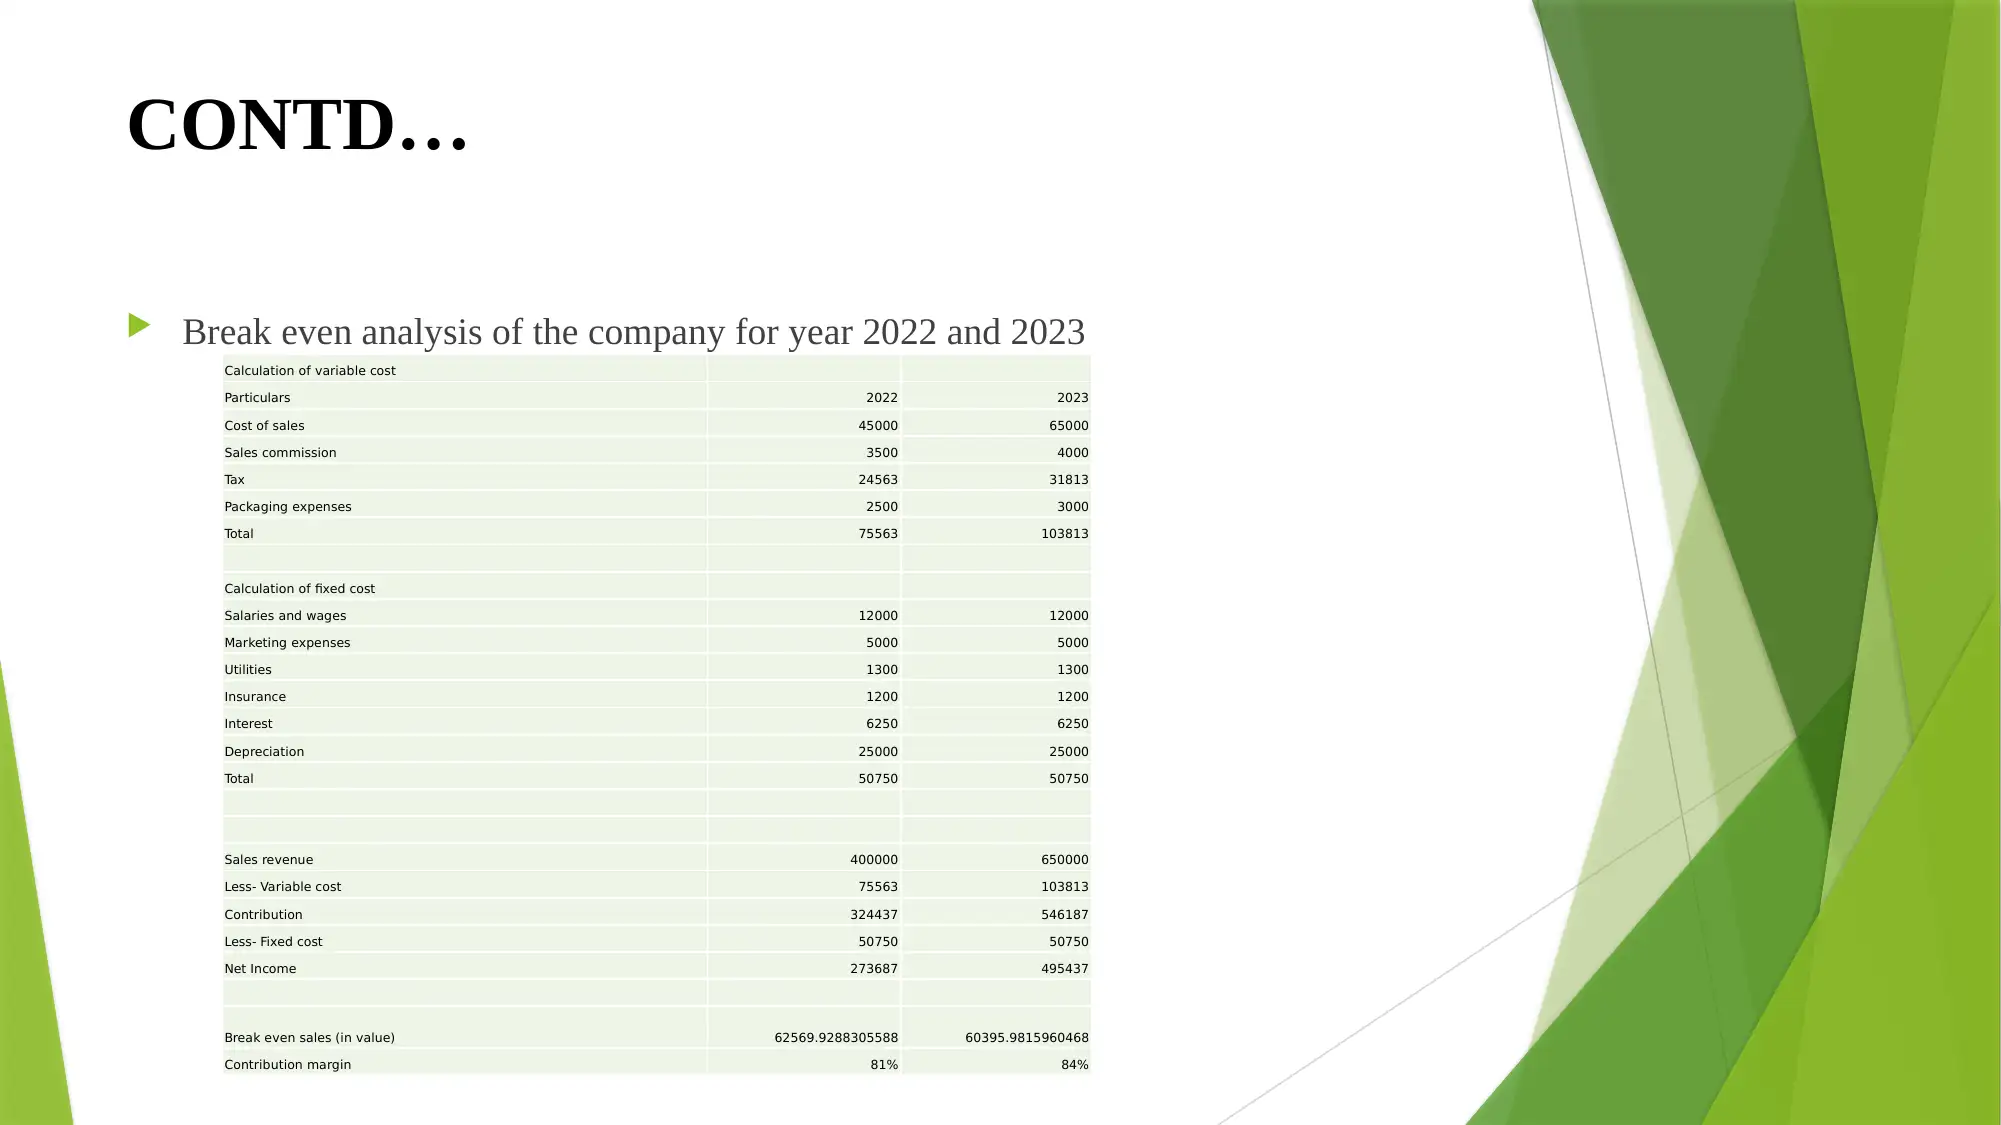
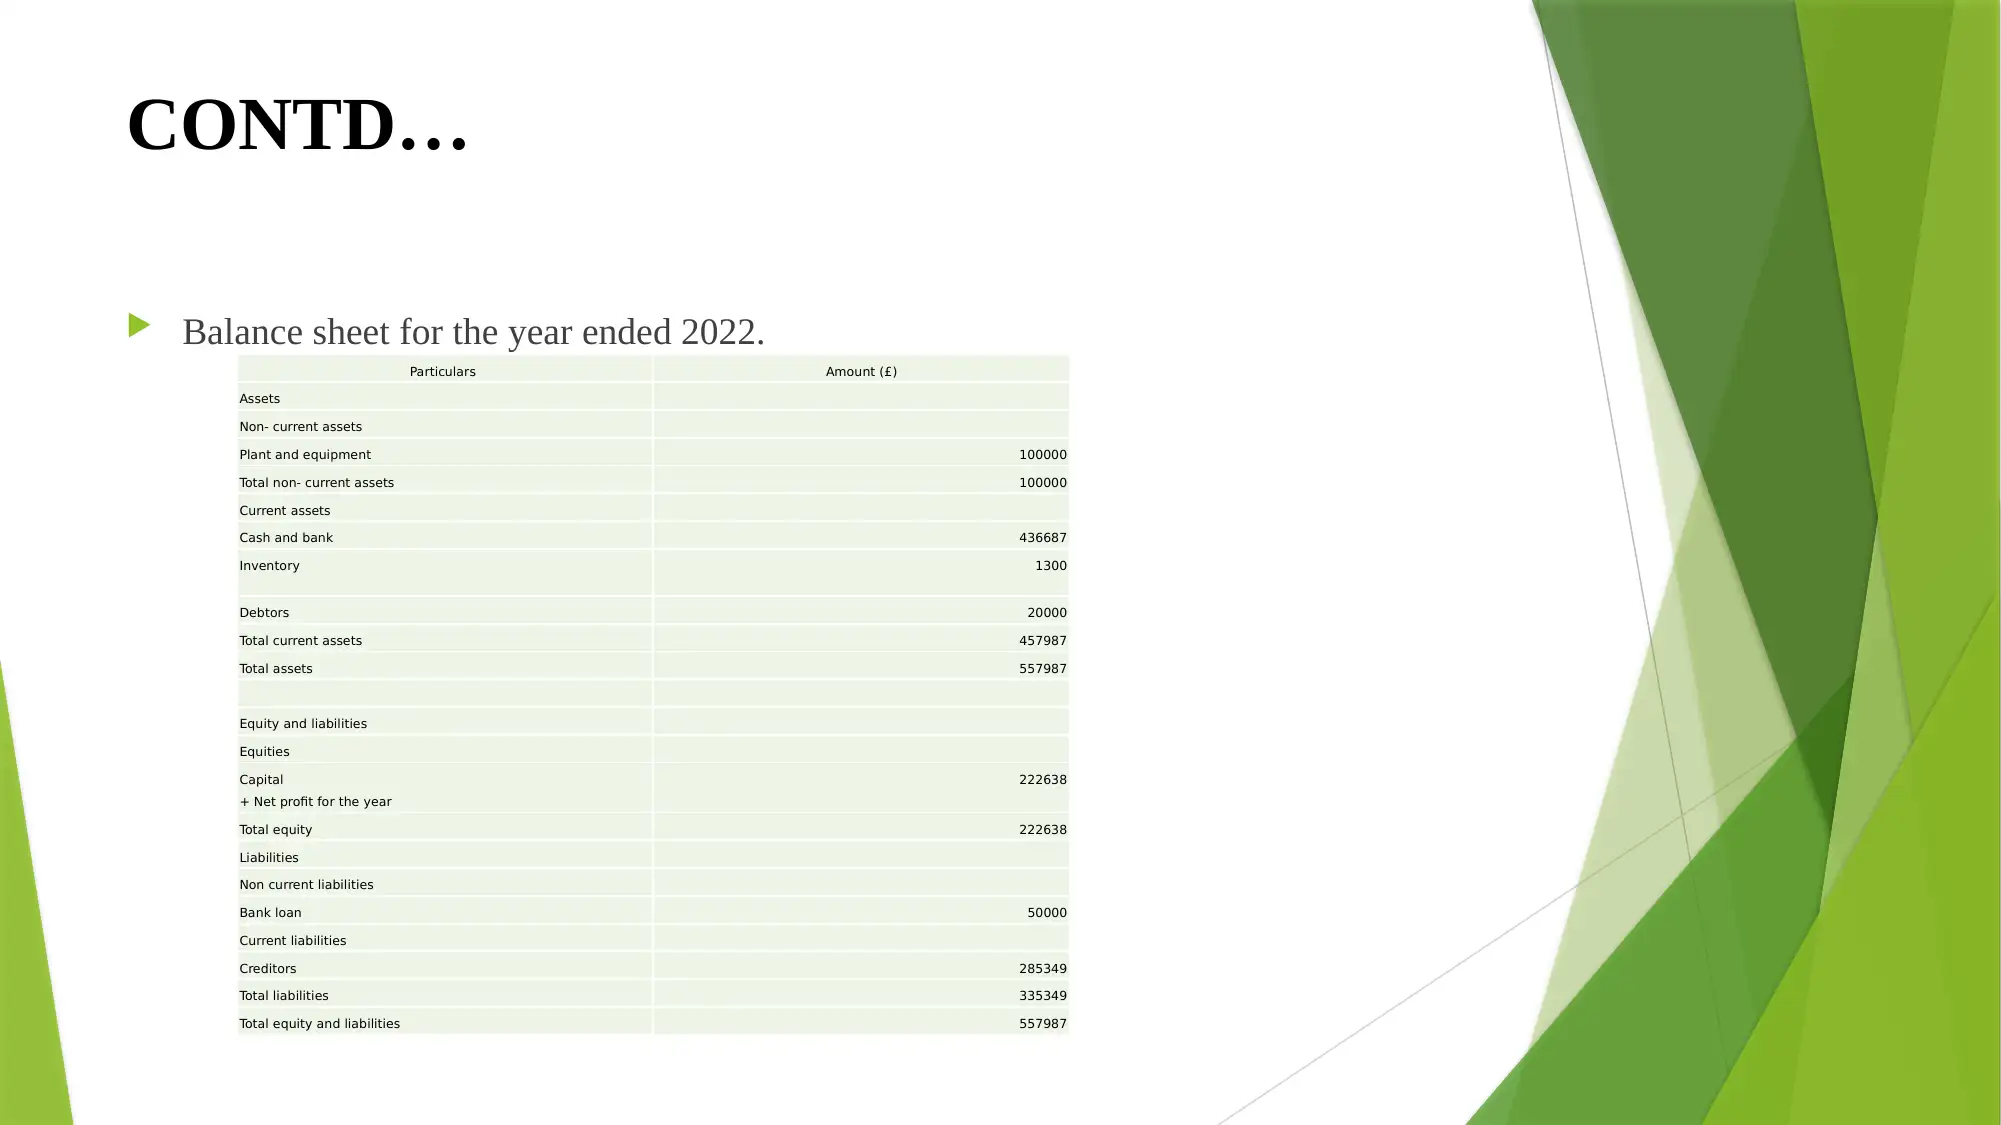
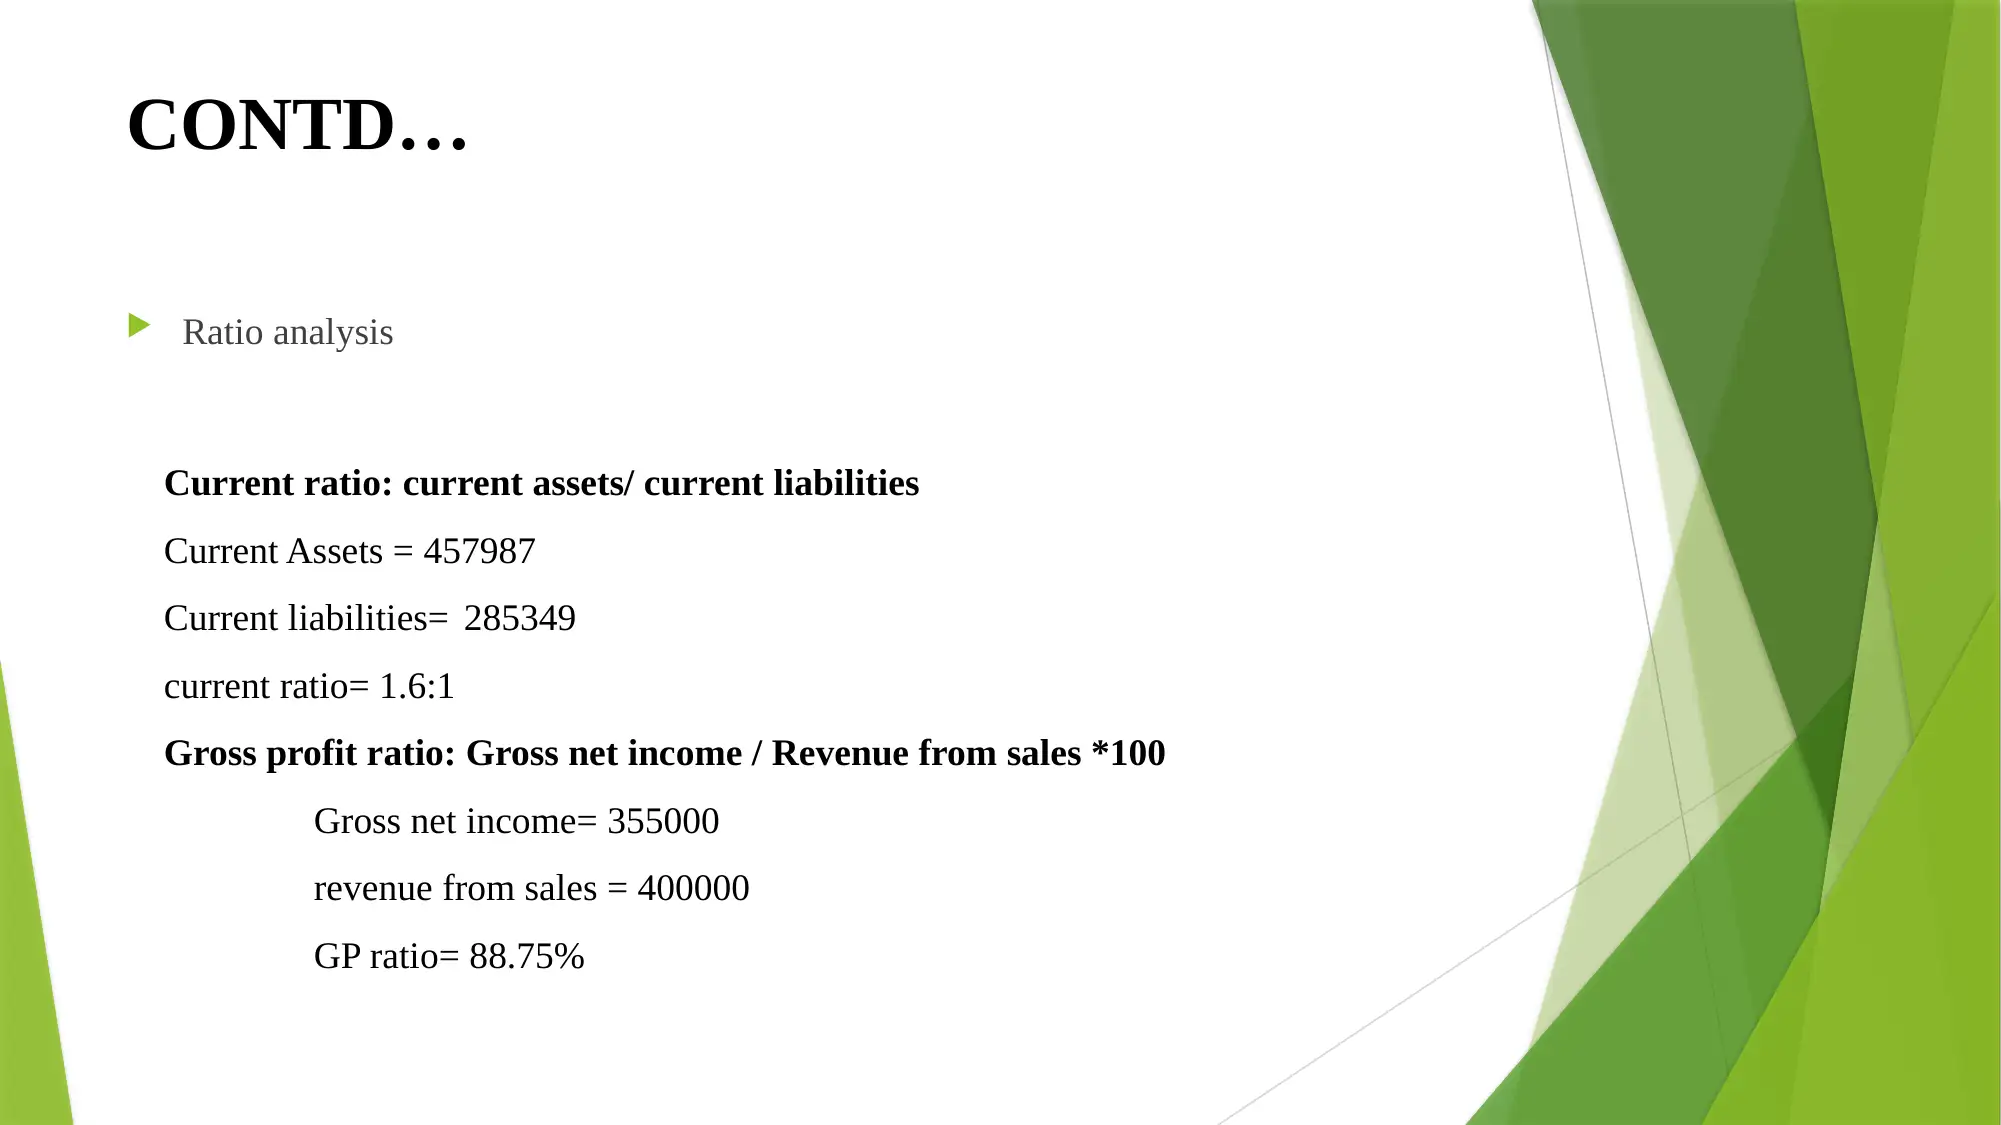
The business plan analyzes Queen Bee Beauty, a newly launched company in the organic cosmetics market. It outlines the company's strengths, weaknesses, opportunities, and threats. The plan includes a market analysis using Porter's five forces, projected financial statements (income statement, cash flow, and balance sheet), and a break-even analysis. Ratio analysis is performed to assess the company's financial health. The plan projects financial performance for 2022 and 2023, including sales revenue, cost of sales, and various expenses. The balance sheet provides a snapshot of the company's assets, liabilities, and equity. The analysis also includes a current ratio and a gross profit ratio. The plan aims to provide insights into the company's potential for success in a competitive market, focusing on organic and sustainable products. The plan also includes references to relevant academic literature.

BUSINESS PLAN AND
ANALYSIS
ANALYSIS
Paraphrase This Document
Need a fresh take? Get an instant paraphrase of this document with our AI Paraphraser

COMPANY OVERVIEW
The business plan is made on company that is named as Queen Bee Beauty.
This is the newly launched company in the market which will sell the variety of organic
cosmetic products in the competitive market.
The purpose of making this business plan having this idea is to know about the things that is
mots required to the customers (Gonzalez, 2021).
The company will be giving new and innovative organic products to the customers in the market.

BUSINESS AND MARKET ANALYSIS
Strengths
Huge demand of natural and organic beauty products
in the market.
Will be having more target customers.
Weaknesses
Raw material is expensive.
Highly labour- intensive process.
Opportunities
Can expand their business in the global market.
Encourage customers to have sustainability in the
market.
This can increase the customer satisfaction as well.
Threats
It will be facing strong competition in the market.
Suppliers for this is low so the raw materials is
somehow expensive that will affect profitability.
⊘ This is a preview!⊘
Do you want full access?
Subscribe today to unlock all pages.

Trusted by 1+ million students worldwide

BUSINESS, OPERATING PLAN AND
COMPETITIVE ANALYSIS
Porter’s five forces
Forces Description
Threats of new entrants: The company used to have the strong threat of new entrants as
there are some business that are growing well in the market.
Bargaining power of suppliers In this the company used to bargain with the suppliers as the
raw materials given by them are somehow expensive.
Bargaining power of customers The bargaining power of the customers in this business is low.
Threat of substitute products large number of substitutes.
Rivalry among the existing players Rivalry of the company is strong in the market.
Paraphrase This Document
Need a fresh take? Get an instant paraphrase of this document with our AI Paraphraser

KEY PROJECTED FINANCIALS
Income statement
Particulars 2022 2023
Sales Revenue 400000 650000
Less - Cost of sales 45000 65000
Gross Profit 355000 585000
Less operating, selling and administration expenses
Salaries and wages 12000 12000
Marketing expenses 5000 5000
Packaging expenses 2500 3000
Insurance 2400 2400
Depreciation 25000 25000
Sales commission 3500 4000
Utilities 1500 1500
Total operating, selling and administration expenses 51900 52900
Profit before interest and tax 303100 532100
Less Interest expense or Finance cost @12.5% 6250 6250
Profit before tax 296850 525850
Less Tax @ 25% 74213 131463

CONTD…
Cash flow statements
Particulars 2022 2023
Receipt
Initial investment (Loan from bank) 50000
Cash from sales 400000 650000
Total receipt 450000 650000
Less- Payments
Purchase of plant and equipment 125000
Cash payment for purchases 50000 70000
Salaries and wages 12000 12000
Marketing expenses 5000 5000
Packaging expenses 2500 3000
Insurance 2400 2400
Sales commission 3500 4000
Purchase of inventory 1300 1300
Interest expense or Finance cost 6250 6250
Tax expenses 30363 37613
Total payment 113313 141563
Net cash flow 336687 508437
Add Opening cash balance 100000 436687
Closing cash balance 436687 945124
⊘ This is a preview!⊘
Do you want full access?
Subscribe today to unlock all pages.

Trusted by 1+ million students worldwide

CONTD…
Break even analysis of the company for year 2022 and 2023
Calculation of variable cost
Particulars 2022 2023
Cost of sales 45000 65000
Sales commission 3500 4000
Tax 24563 31813
Packaging expenses 2500 3000
Total 75563 103813
Calculation of fixed cost
Salaries and wages 12000 12000
Marketing expenses 5000 5000
Utilities 1300 1300
Insurance 1200 1200
Interest 6250 6250
Depreciation 25000 25000
Total 50750 50750
Sales revenue 400000 650000
Less- Variable cost 75563 103813
Contribution 324437 546187
Less- Fixed cost 50750 50750
Net Income 273687 495437
Break even sales (in value) 62569.9288305588 60395.9815960468
Contribution margin 81% 84%
Paraphrase This Document
Need a fresh take? Get an instant paraphrase of this document with our AI Paraphraser

CONTD…
Balance sheet for the year ended 2022.
Particulars Amount (£)
Assets
Non- current assets
Plant and equipment 100000
Total non- current assets 100000
Current assets
Cash and bank 436687
Inventory 1300
Debtors 20000
Total current assets 457987
Total assets 557987
Equity and liabilities
Equities
Capital
+ Net profit for the year
222638
Total equity 222638
Liabilities
Non current liabilities
Bank loan 50000
Current liabilities
Creditors 285349
Total liabilities 335349
Total equity and liabilities 557987

CONTD…
Ratio analysis
Current ratio: current assets/ current liabilities
Current Assets = 457987
Current liabilities= 285349
current ratio= 1.6:1
Gross profit ratio: Gross net income / Revenue from sales *100
Gross net income= 355000
revenue from sales = 400000
GP ratio= 88.75%
Ratio analysis
Current ratio: current assets/ current liabilities
Current Assets = 457987
Current liabilities= 285349
current ratio= 1.6:1
Gross profit ratio: Gross net income / Revenue from sales *100
Gross net income= 355000
revenue from sales = 400000
GP ratio= 88.75%
⊘ This is a preview!⊘
Do you want full access?
Subscribe today to unlock all pages.

Trusted by 1+ million students worldwide

REFERENCES
Tong, S., Luo, X. and Xu, B., 2020. Personalized mobile marketing strategies. Journal of the
Academy of Marketing Science. 48(1). pp.64-78.
Alonso-Vazquez, M., del Pilar Pastor-Pérez, M. and Alonso-Castañón, M. A., 2018.
Management and business plan. In The Emerald Handbook of Entrepreneurship in Tourism,
Travel and Hospitality. Emerald Publishing Limited.
Gonzalez, L., 2021. Spurring inclusive entrepreneurship and student development post-C19:
synergies between research and business plan competitions. Journal of Research in Innovative
Teaching & Learning.
Paraphrase This Document
Need a fresh take? Get an instant paraphrase of this document with our AI Paraphraser

1 out of 11
Related Documents

Your All-in-One AI-Powered Toolkit for Academic Success.
+13062052269
info@desklib.com
Available 24*7 on WhatsApp / Email
Unlock your academic potential
Copyright © 2020–2025 A2Z Services. All Rights Reserved. Developed and managed by ZUCOL.